Pesticide Usage in Scotland: Soft Fruit Crops 2022
This publication presents information from a survey of pesticide use on Soft Fruit Crops in Scotland during 2022.
Part of
General trends
Crop area
It should be noted that as there was no June 2022 Agricultural Census, crop areas reported and used to estimate 2022 pesticide usage data are those returned in the 2021 census (see Appendix 4, Changes from previous years for full details).
In 2022 the estimated area of soft fruit crops grown was 2,198 hectares (based on the June 2021 Agricultural Census, Table 21). This is very similar to the estimated 2,168 ha grown in 2020(3) and a five per cent increase from 2018(4). Strawberry and raspberry areas were very similar to the 2020 survey, both changing by less than one per cent. The areas of mixed/other soft fruits and blueberries decreased since the last survey in 2020 (nine and four per cent respectively), while the area of blackcurrants increased eight per cent (Figure 1).
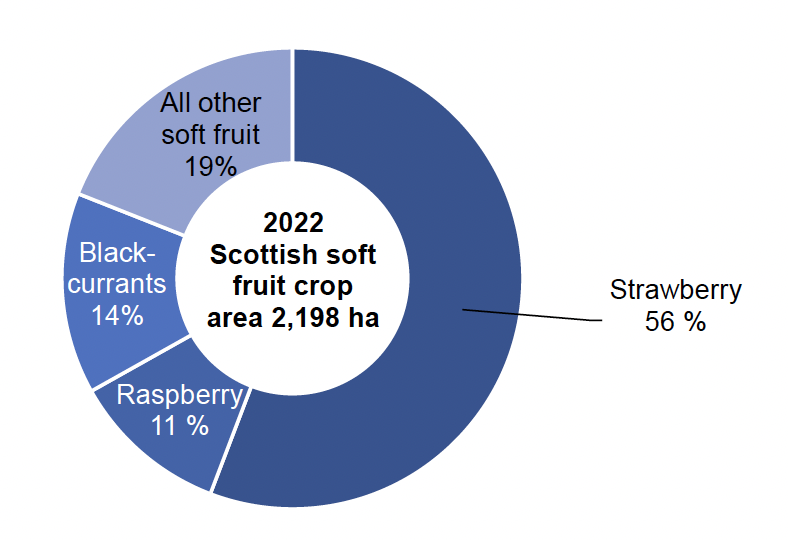
In 2022, strawberries accounted for 56 per cent of the soft fruit area, blackcurrants 14 per cent, raspberries 11 per cent, and other soft fruit crops (blueberries, blackberries, gooseberries, redcurrants and other minor crops) 19 per cent (Figure 2). The same percentages were reported in the 2020 survey(3).
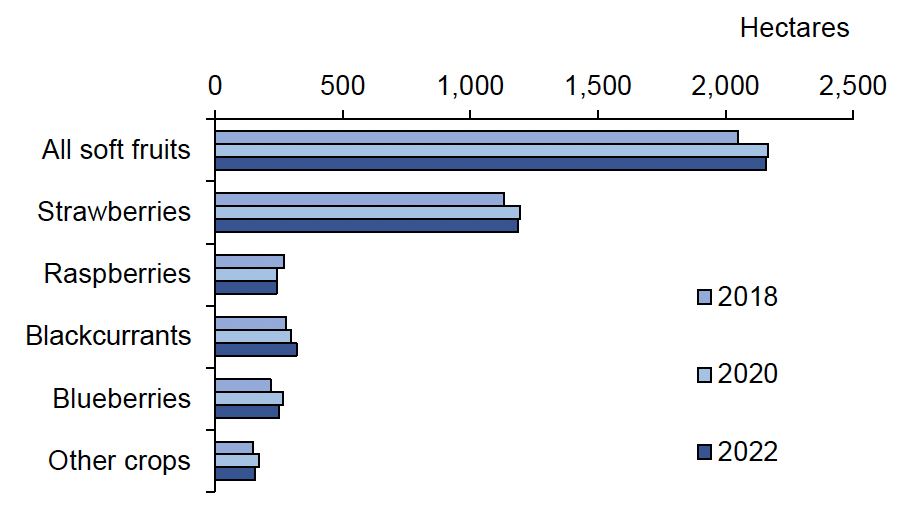
Note: areas include both non-protected and protected crops. Multi-cropping is not included. 2022 areas are based on the June 2021 Agricultural Census as there was no census in 2022 – see the changes from previous years section for further information.
Note: areas include multi-cropping.
Pesticide usage
This section refers to pesticide usage patterns in overall soft fruit crops. For a description of usage on individual protected and unprotected crops please see the subsequent 2022 Pesticide usage section (pages 13 to 34).
The majority of soft fruit crops (92 per cent) received a pesticide treatment in 2022. Strawberries and blackcurrants had the highest overall proportion of crop treated with a pesticide (100 and 97 per cent respectively, Table 1). Raspberries and other soft fruit crops were estimated to have lower proportions of treated crop (89 and 68 per cent respectively). In relation to the average number of pesticide applications, the treated area of soft fruit crops received on average 14.4 sprays, compared with 12.4 sprays in the previous survey, with the increase being driven by an increased use of biological controls. Strawberries received the highest number of applications with an average of 18.5 sprays. In contrast the “All other soft fruit” category received the lowest number of sprays, 6.7 on average (Table 1).
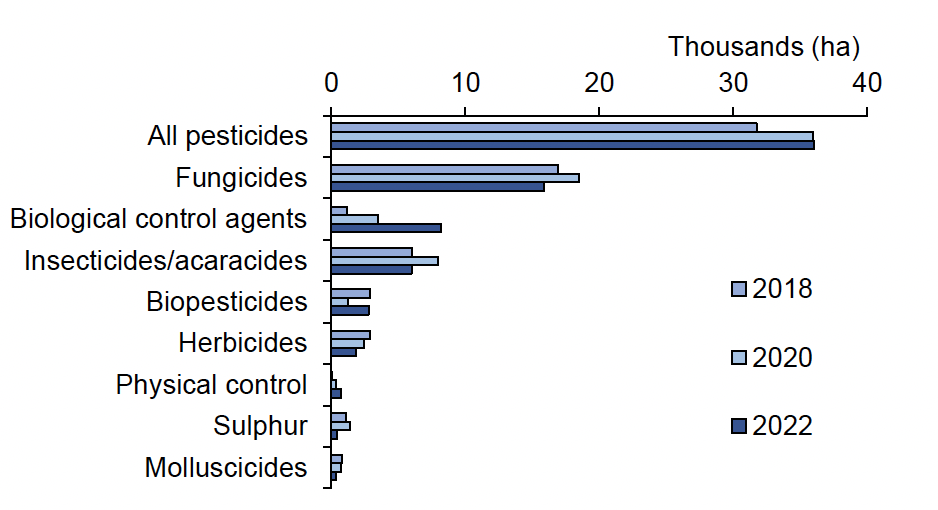
It is estimated that the area of soft fruit crops treated with a pesticide formulation (including biologicals) in 2022 and 2020 was ca. 36,000 hectares compared with ca. 31,800 hectares in 2018 (Table 20, Figure 3). This represents an increase of 13 per cent since 2018 and no change since 2020.
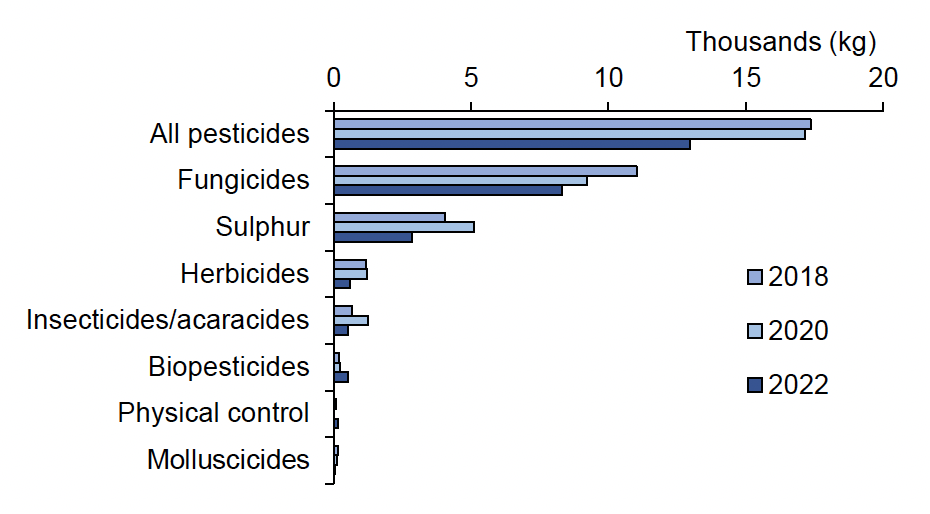
In terms of weight of pesticide applied, ca. 13 tonnes were applied in 2022 compared with ca.17.2 tonnes in 2020 and ca. 17.4 tonnes in 2018 (Figure 4). This represents a decrease of 24 per cent from 2020 and of 25 per cent from 2018.
Note: invertebrate biological control agents are applied by number of organisms rather than weight therefore data is not presented.
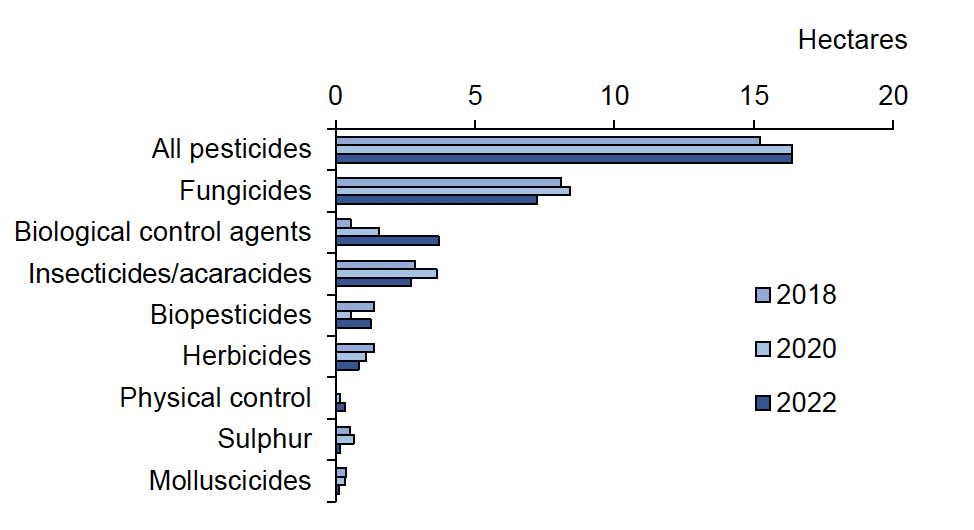
In order to make accurate comparisons between the 2022 data and that reported in previous surveys, it is important to take into account differences in crop areas between years. Therefore, the number of treated hectares per hectare of crop grown and the total weight of pesticide used per hectare of crop grown were calculated. In 2022, for each hectare of crop grown, around 16 treated hectares were recorded (Figure 5). This is unchanged from 2020 but represents an increase of eight per cent since 2018. In 2022, the number of pesticide treated hectares has decreased across all pesticide categories with the exception of biological control agents, biopesticides and physical controls which have more than doubled since the previous 2020 survey.
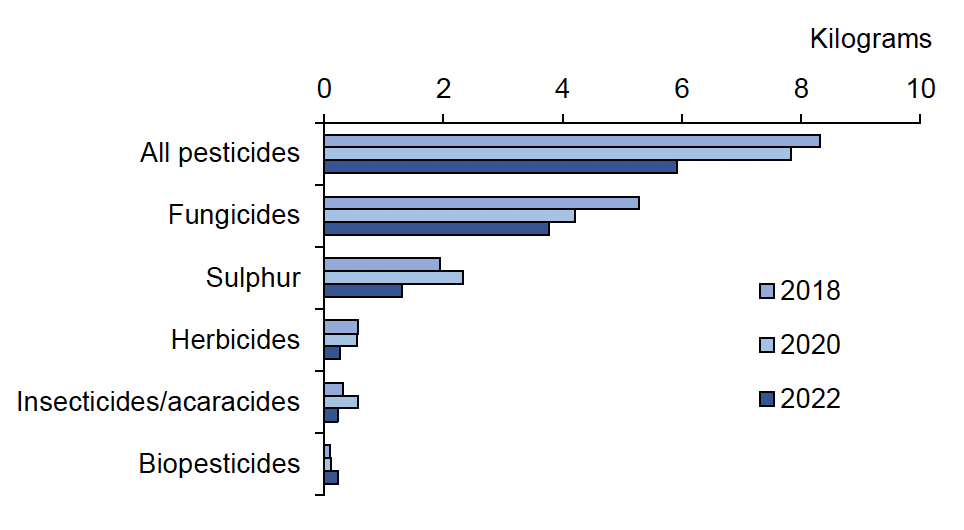
The estimated weight of pesticide applied per hectare of crop grown was almost six kilograms (Figure 6). This represents a decrease of 25 per cent from 2020 and 29 per cent from 2018. The unchanged area treated but decrease in weight applied in 2022 compared with 2020 is influenced by a large increase in the use of biological control agents, biopesticides and physical controls (increase of 135, 129 and 108 per cent in treated area respectively from 2020) and play an increasingly important part in growers Integrated Pest Management (IPM) programmes as the availability of active chemical substances become more restricted. As invertebrate biological control agents are applied by number of organisms rather than weight, only the area treated is recorded, which contributes to the reduction in overall weight of pesticides used. Biological (both biological control agents and biopesticides) and physical control products represented ca. 32 per cent of pesticide formulations used in 2022 in comparison to ca. 14 per cent in 2020.
Note: molluscicides and physical control have been excluded as their use represents less than 0.1 kg per hectare of crop grown. Invertebrate biological control agents are applied by number of organisms rather than weight therefore data are not presented.
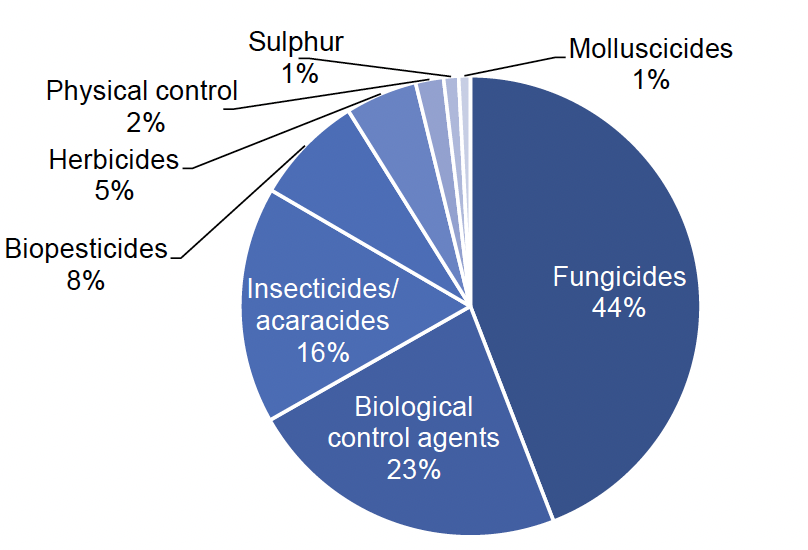
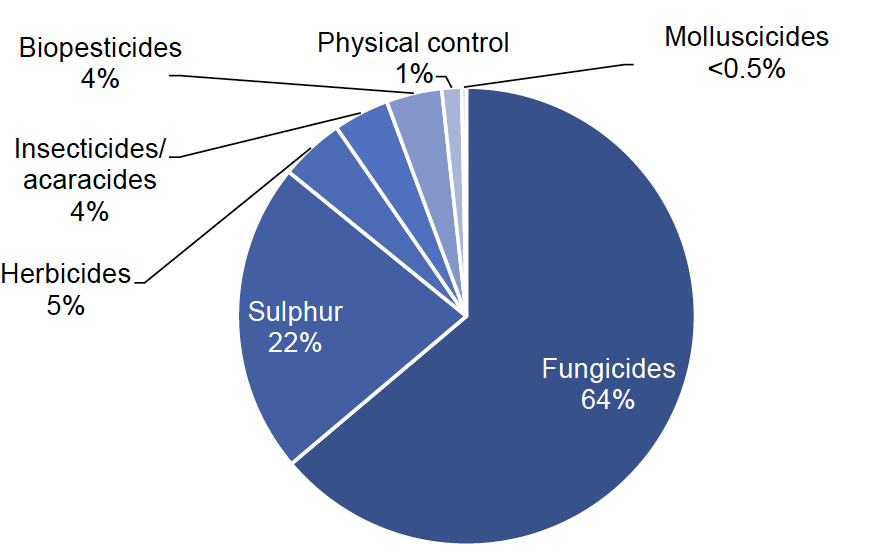
In 2022, fungicides were the most frequently used pesticides by area treated on soft fruit crops, followed by biological control agents, insecticide/acaricides and biopesticides (Figure 7). Fungicides accounted for 44 per cent of the total pesticide treated area and 64 per cent of the total weight of pesticides applied (Figures 7 and 8). When changes in crop area are taken into account decreases were seen for both area treated and weight applied. The area treated with fungicide formulations decreased by 14 per cent from 2020 to 2022 and by 11 per cent from 2018 to 2022 (Figure 5). Similarly, there was a decrease of 10 per cent in the weight of fungicides used per hectare of crop grown from 2020 to 2022 and a 28 per cent drop from 2018 to 2022 (Figure 6). A cool, dry spring may have reduced disease pressure in 2022. An increased use of biological control agents and biopesticides may also be a factor (discussed later).
Sulphur can be applied as a fungicide but is also used as an insecticide on blackcurrants. Sulphur accounted for one per cent of the total treated area and 22 per cent of the total weight of pesticides applied (Figures 7 and 8). When changes in area grown are taken into account, there was a 73 per cent decrease in the use of sulphur between 2020 and 2022, and a 67 per cent decrease from 2018 to 2022 (Figure 5). The weight of sulphur applied per hectare of crop grown also decreased by 44 per cent from 2020 to 2022 and by 33 per cent from 2018 to 2022 (Figure 6). When crop area is taken into account, the mean applications of sulphur were 1.3 kg/ha in 2022, 2.3 kg/ha in 2020 and 1.9 kg/ha in 2018. Sulphur was primarily applied to control big bud mite on blackcurrants, the vector for blackcurrant reversion virus, and being an essential macronutrient that can be applied as a foliar spray, sulphur helps supports plant functions that can affect yield, quality and marketability.
Note: invertebrate biological control agents are applied by number of organisms rather than weight therefore data are not presented.
In 2022, insecticides and acaricides accounted for 16 per cent of the total pesticide treated area and four per cent of the total weight of pesticides applied (Figures 7 and 8). When changes in crop area are taken into account, there is a 25 per cent decrease from 2020 to 2022 and a five per cent decrease from 2018 to 2022 in the area treated with insecticide/acaricide formulations (Figure 5). In terms of weight of insecticide applied, when area of crop grown is taken into account, there is a 59 per cent decrease from 2020 to 2022 and a 25 per cent decrease from 2018 to 2022 (Figure 6). The decrease in insecticide use in 2022 may have been influenced by a number of factors, such as the withdrawal of active substances and an increased use of biological control agents and biopesticides for managing insect pests and disease in soft fruit crops as part of an IPM system. Thiacloprid was the second most used insecticide in the previous survey in 2020 (applied to ca. 1500 ha), however this was withdrawn from use in February 2021. Use of the pyrethroid lambda-cyhalothrin decreased by 28 per cent; in contrast the use of spirotetramat increased by nine per cent. Unlike pyrethroids, which can have adverse effects on non-target insects, the use of spirotetramat is generally more compatible with IPM programmes.
Herbicides and desiccants accounted for five per cent of both the total pesticide treated area and the total weight of pesticides applied (Figures 7 and 8). When changes in crop area are taken into account, there was a decrease in area treated with herbicide and desiccant formulations of 25 per cent from 2020 and a decrease of 40 per cent from 2018 (Figure 5). In terms of weight of pesticide applied, when area of crop is taken into account, there was a decrease of 52 per cent from 2020 to 2022 and a decrease of 53 per cent from 2018 to 2022 (Figure 6). Dry weather in spring and summer 2022 kept weed pressure low.
In 2022, biopesticides accounted for eight per cent of the total pesticide treated area and four per cent of the total weight of pesticides applied (Figures 7 and 8). When changes in crop area are taken into account, there was an increase of 129 per cent from 2020 to 2022 and a decrease of 10 per cent from 2018 to 2022 in the area treated with biopesticide formulations (Figure 5). In terms of weight of pesticide applied, there is an increase of 117 per cent from 2020 to 2022 and an increase of 145 per cent from 2018 to 2022. Biopesticides were recorded on strawberry, raspberry and on other soft fruit crops. The majority of biopesticides were applied to strawberry crops for the control of botrytis and powdery mildew.
Biological control agents accounted for 23 per cent of the total pesticide treated area (Figure 7). As biological control agents are applied by the number of organisms rather than the weight, no weight data are presented. When changes in crop area are taken into account, there is an increase of 135 per cent from 2020 to 2022 and an increase of 587 per cent from 2018 to 2022 in area treated. Biological control agents were used on semi protected and protected strawberry, raspberry and other soft fruit crops such as blueberry and honeyberry. This demonstrates a continuing trend towards increased use of biological control agents and biopesticides for managing insect pests and disease in soft fruit crops as part of an integrated pest management system.
In this survey, molluscicides accounted for one per cent of the total pesticide treated area and less than one per cent of the total weight of pesticides applied (Figures 7 and 8). When changes in crop areas between years are taken into account, there is a decrease in molluscicide applications per unit area of 59 per cent between 2020 and 2022 and 66 per cent between 2018 and 2022 (Figure 5). The weight of molluscicides applied per hectare of crop grown decreased by 63 per cent from 2020 to 2022 and by 73 per cent from 2018 to 2022 (Figure 6). Molluscicide use varies significantly from year to year as slug populations are closely linked to climatic conditions. Ferric phosphate is now the only molluscicide active substance available to growers (applied to 294 ha). Metaldehyde was withdrawn from the market with a final use date of March 2022.
Pesticides classified as physical control agents accounted for two per cent of the total pesticide treated area (Figures 7). When changes in crop areas between years are taken into account, there was an increase in physical control agent applications per unit area of 108 per cent between 2020 and 2022 and 1,240 per cent between 2018 and 2022. Physical control agents are substances that have a physical action against insect pests, for example by blocking insect spiracles and causing death by suffocation. Physical control agents were predominately recorded on protected crops for the control of aphids, spider mite, whitefly and thrips.
As well as changes in overall trends in application of pesticide groups since the previous survey, there has been variation in the use of individual active substances. The use of the biological control agents Neoseiulus cucumeris and Phytoseiulus persimilis have increased by 208 and 199 per cent in terms of area treated between 2020 and 2022. Neoseiulus cucumeris was the most used active substance by area treated in 2022 (Table 18). The use of biopesticide Bacillus subtilis strain QST 713 increased by 151 per cent in terms of area treated from 2020 to 2022. As noted previously, the trend of increased use of biopesticides may be influenced by the withdrawal of fungicide active substances. Additionally, since 2016, there has a been a focus on the promotion of IPM and the introduction of mandatory completion of IPM plans within some key farm assurance schemes to help growers make the best possible and most sustainable use of all available methods of pest control.
All sixteen new active substances recorded for the first time in the soft fruit survey were biological control agents and biopesticides. The thirteen new biological control agents encountered included Aphidius ervi, Aphidius colemani, Aphelinus abdominalis, Aphidius matricariae, Praon volucre and Ephedrus cerasicola and the three biopesticides were Cerevisane (saccharomyces cerevisiae strain LAS 117), Gliocladium catenulatum strain J1446 and Trichoderma harzianum (Table 17). This highlights, what appears to be, an increased assurance and capability by growers to use these products to protect high value crops from pests and diseases, coupled with greater availability of biological products to growers.
Contact
Email: psu@sasa.gov.scot