Pesticide Usage in Scotland: Soft Fruit Crops 2022
This publication presents information from a survey of pesticide use on Soft Fruit Crops in Scotland during 2022.
Part of
Appendix 4 – Survey methodology
Sampling and data collection
Using the May 2022 Single Application Form (SAF) data, two samples were representing soft fruit cultivation in Scotland. The first sample was selected from holdings growing soft fruit crops grown in the open (non-protected crops) and the second from holdings growing soft fruit crops in glasshouses or under walk-in plastic structures (protected crops). Protected and non-protected crops are recorded separately in the SAF and Agricultural Census. Separate samples were drawn to ensure non-protected crops were not under-represented in the sample; however, pesticide information was collected for all soft fruit crops grown on all holdings.
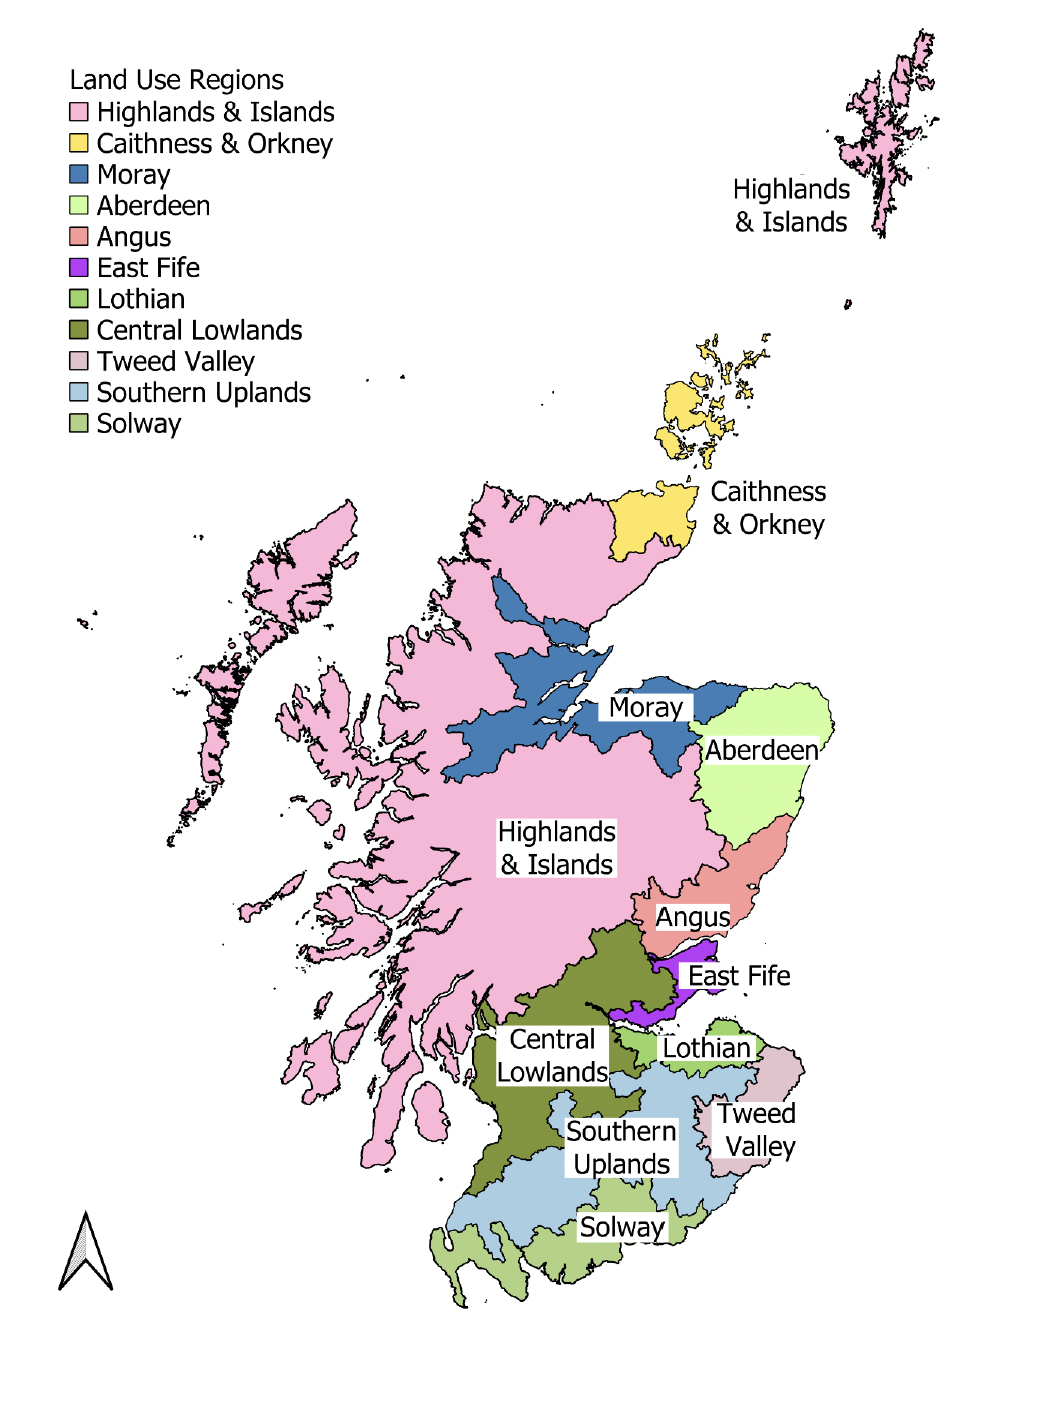
The country was divided into 11 land-use regions (Figure 19). Each sample was stratified by these land-use regions and according to holding size. The holding size groups were based on the total area of soft fruit crops grown. The sampling fractions used within both regions and size groups were based on the areas of relevant crops grown rather than number of holdings, so that smaller holdings would not dominate the sample.
The survey covered pesticide applications to soft fruit crops where all or the majority of the growing season was in 2022. As well as recording treatments applied directly to the crop, data was also collected on land preparation treatments prior to sowing or planting the crop.
Following an introductory letter and phone call, data were collected during a phone interview or by email. Where necessary, information was also collected from agronomists and contractors. In total, information was collected from 81 holdings growing soft fruit crops (Table 22). These holdings represent 61 per cent of the total crop area grown.
Raising factors
National pesticide use was estimated by ratio raising. This is a standard statistical technique for producing estimates from a sample. It is the same methodology used by the other UK survey teams and has been used for all historical datasets produced by the Pesticide Survey Unit, allowing comparability over time. The sample data were multiplied by raising factors (Table 27 and 28). These factors were calculated by comparing the sample area in each of the two samples to the areas recorded in the June 2021 Agricultural Census within each region and size group (please see changes from previous years section for further detail). An adjustment (Table 29 and 30) was made for each crop within each region by applying the raising factors to the sample area of each crop grown and comparing this with the census area. This adjustment modifies the estimate to take into account differences in composition of crops encountered in the sample and those present in the population. A second adjustment is applied if crops which are present in the population are not encountered in the sample in some strata. Due to the distribution of soft fruit crops in Scotland the land use regions were amalgamated into three areas before raising; the North (Highlands & Islands, Caithness & Orkney, Moray and Aberdeen), Angus (the main fruit growing region in Scotland) and the South (East Fife, Lothian, Central Lowlands, Tweed Valley, Southern Uplands and Solway).
Changes from previous surveys
There are a number of changes which should be noted when comparing the 2022 data with the previous survey.
For previous reports, the June Agricultural Census was used to draw a sample of farmers growing the relevant crops to participate in the survey. National pesticide use was then estimated by ratio raising, by comparing the sample area to the areas recorded in the June Agricultural Census data.
To allow for the Agricultural Statistics Transformation Programme(9), the June 2022 Agricultural Census was paused. This pause was agreed with the Office for Statistical Regulation and data users.
For this report, the May 2022 Single Application Form (SAF) data was used to draw the sample. SAF data does not account for the majority of land area for soft fruit crops (smaller holdings are often excluded). The sample drawn is based on area of crop grown, rather than number of holdings. Therefore, to provide better pesticide usage estimates, the 2022 sample data was raised to the June 2021 Agricultural Census data rather than to SAF data. Using SAF data during the raising process would have underestimated total areas grown and therefore pesticide usage estimates. However, using 2021 census data during the raising process will also have impacted pesticide use estimates, though the magnitude of impact is unclear. The June Agricultural Census has been paused only for one year therefore up to date census areas will be available for future surveys.
Some data published in previous reports such as modes of action data, reasons for use and timing of applications data have been excluded from the current survey due to resource and time constraints.
The previous report contained information about grower adoption of Integrated Pest Management (IPM). IPM data was not collected during the 2022 survey. It is anticipated that IPM data will be collected and published every 4 years. This allows IPM uptake to be monitored over time but reduces the burden on growers and surveyors.
Data quality assurance
The dataset undergoes several validation processes as follows; (i) checking for any obvious errors upon data receipt (ii) checking and identifying inconsistencies with use and pesticide approval conditions once entered into the database (iii) checking of data held in the database against the raw data. Where inconsistencies are found these are checked against the records and with the grower if necessary. Additional quality assurance is provided by sending reports for review to members of the Working Party on Pesticide Usage Surveys and other agricultural experts. In addition, the Scottish pesticide survey unit is accredited to ISO 9001:2015. All survey related processes are documented in Standard Operating Procedures (SOPs) and our output is audited against these SOPs by internal auditors annually and by external auditors every three years.
Main sources of bias
The use of a random stratified sample is an appropriate survey methodology. A stratified random sample, grouped by farm size and region, is used to select holdings used in this survey. Sampling within size groups is based on area rather than numbers of holdings, so that smaller size groups are not over-represented in the sample. The pesticide survey may be subject to measurement bias as it is reliant on farmers/growers recording data accurately. As this survey is not compulsory it may also subject to non-response bias, as growers on certain farm/holding types may be more likely to respond to the survey than others. Reserve lists of holdings are held for each stratum to allow non-responding holdings to be replaced with similar holdings.
Experience indicates that stratified random sampling, including reserves, coupled with personal interview technique, delivers the highest quality data and minimises non-response bias.
Contact
Email: psu@sasa.gov.scot