Pesticide Usage in Scotland: Soft Fruit Crops 2022
This publication presents information from a survey of pesticide use on Soft Fruit Crops in Scotland during 2022.
Part of
2022 Pesticide usage
All strawberries (protected and non-protected crops)
- An estimated 1,226 hectares of strawberries were grown in Scotland in 2022 (based on June 2021 Census areas – see changes from previous years section for further explanation). This consists of 37 ha of non-protected crop and 1,190 ha of protected crop
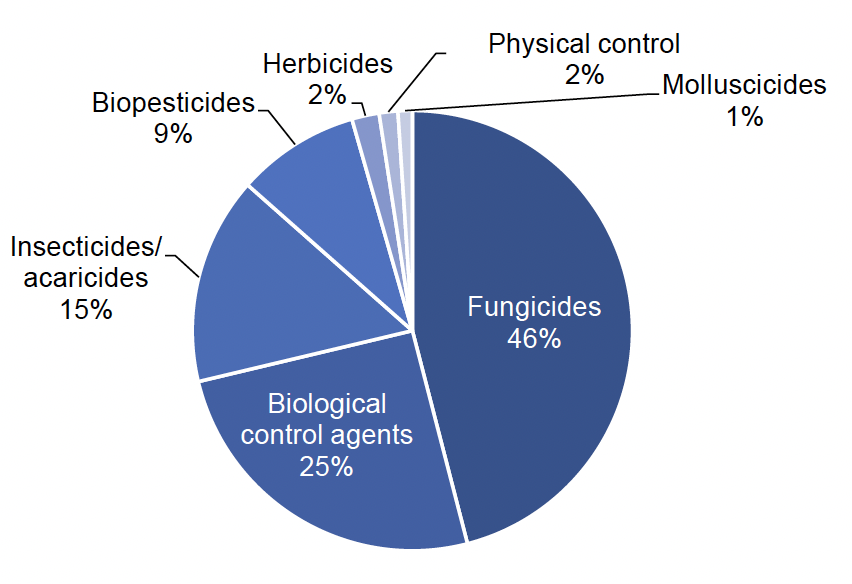
- Almost all of the crop was treated with a pesticide (see Figure 9 for types of pesticides used)
- Pesticide formulations were applied to 28,001 treated hectares with 7,863 kilograms of pesticide applied in total (see summary table)
- Strawberry crops received on average 18.5 applications (Table 1). These included 9.9 biological applications, 8.7 fungicide applications and 3.5 insecticide applications (applied to 77, 99 and 86 per cent of the crop area). They also received on average 2.4 physical control, 1.3 herbicide/desiccant and 1.2 molluscicide applications (applied to 13, 18 and 20 per cent respectively)
- Ten per cent of strawberries encountered in the sample were under one year old, 77 per cent were between one and two years old, five per cent were over two years old with the remainder unknown
- Sixty-eight per cent of the crop sampled was grown in a raised or table top system. Fifty-eight per cent of the crop sampled was grown in bags, 32 per cent was grown in soil and three per cent in troughs, with the remainder unknown
- Fifty-nine per cent of the crop sampled was grown using a ground mulch or straw
- Ninety-eight per cent of the crop sampled was grown under protection, of this 45 per cent was in permanent tunnels and 53 per cent was in temporary tunnels
- Pollinators were used on 90 per cent of the strawberry crop sampled. Of the area using pollinators, 57 per cent used bumble bees, 11 per cent used honey bees and 22 per cent used both bumble bees and honey bees
- All of the strawberry crops surveyed were harvested in 2022. Ninety-eight per cent were for fresh market, one per cent for pick-your-own and less than one per cent for processing
- The most common varieties encountered were Magnum, Malling Centenary and Murano (accounting for 25, 22 and 18 per cent of the sample area respectively)
| Pesticide group | Formulation area treated | Weight of pesticides applied | Percentage of crop treated | Most used formulations |
|---|---|---|---|---|
| ha | kg | % | ha | |
| Fungicides | 12,873 | 6,771 | 99 | Difenoconazole/ fluxapyroxad (1,639), cyprodinil/fludioxonil (1,343) |
| Biological control agents | 7,086 | [z] | Neoseiulus cucumeris (2,980) | |
| Insecticides/ acaricides | 4,270 | 323 | 86 | Spirotetramat (1,134), lambda-cyhalothrin (883), spinosad (617) |
| Biopesticides | 2,531 | 468 | Bacillus subtilis strain QST 713 (1,618) | |
| Herbicides | 563 | 138 | 18 | Carfentrazone-ethyl (258) |
| Physical control | 384 | 121 | 13 | Unspecified physical control agents(1) (220), carbonic acid diamide/urea (164) |
| Molluscicides | 294 | 43 | 20 | Ferric phosphate (294) |
| All pesticides | 28,001 | 7,863 | 100 |
(1) Refer to Appendix 3 for definitions.
Note: some shorthand is used in this table: [z] = not applicable.
Non-protected strawberries
- An estimated 37 hectares of non-protected strawberry were grown in Scotland in 2022 (based on June 2021 Census areas – see changes from previous years section for further explanation). This included an estimated one hectare recorded in the mixed and other soft fruit section of the census
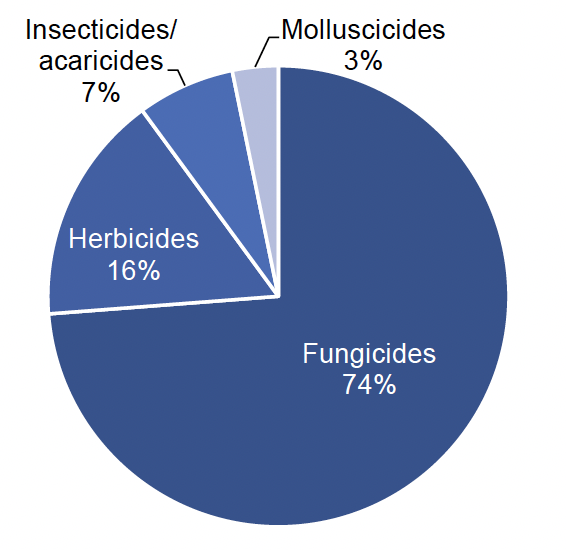
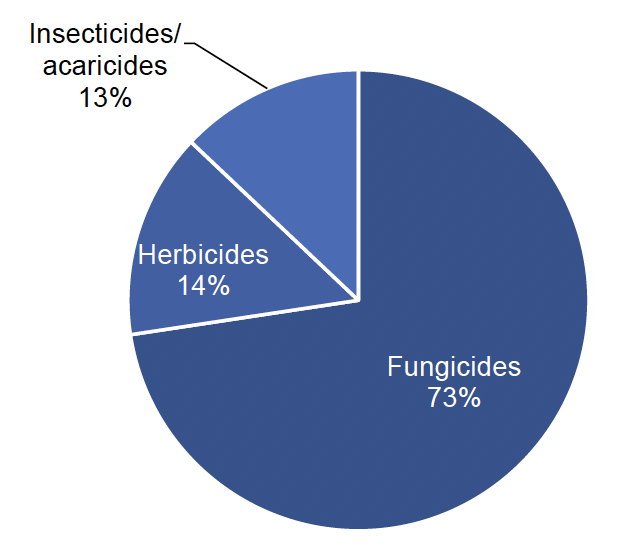
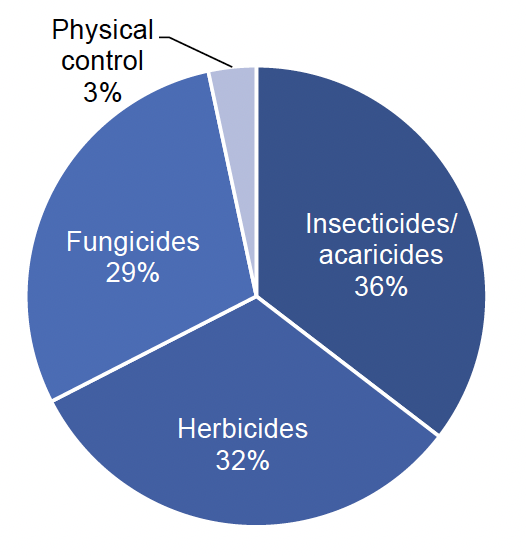
- Ninety-eight per cent of the crop was treated with a pesticide (see Figure 10 for types of pesticides used)
- Pesticide formulations were applied to 255 treated hectares with 124 kilograms of pesticide applied in total (see summary table below)
- The 98 per cent of non-protected strawberry crop treated with a pesticide received on average 4.9 spray applications (Table 1). These included 3.5 fungicide applications, 2.1 herbicide/desiccant applications and 1.4 insecticide applications (applied to 98, 42 and 35 per cent of the crop respectively). Molluscicides were applied to 22 per cent of the crop averaging one application over the season
- The most common varieties encountered were Symphony and Solero, accounting for 37 and 32 per cent of the sample area respectively
| Pesticide group | Formulation area treated | Weight of pesticides applied | Percentage of crop treated | Most used formulations |
|---|---|---|---|---|
| ha | kg | % | ha | |
| Fungicides | 188 | 86 | 98 | Cyprodinil/fludioxonil (41), potassium hydrogen carbonate (34) |
| Herbicides | 41 | 37 | 42 | Isoxaben (13), pendimethalin (11) |
| Insecticides/ acaricides | 17 | <0.5 | 35 | Lambda-cyhalothrin (9) |
| Molluscicides | 8 | 1 | 22 | Ferric phosphate (8) |
| All pesticides | 255 | 124 | 98 |
Protected strawberries
- An estimated 1,190 hectares of protected strawberry were grown in Scotland in 2022 (based on June 2021 Census areas – see changes from previous years section for further explanation), including 39 hectares of multi-cropping
- Based on the ratio encountered in the sample, it is estimated that 50 per cent of the crop was semi-protected (grown under temporary tunnels) and 50 per cent permanently protected (grown in permanent tunnels or glasshouses)
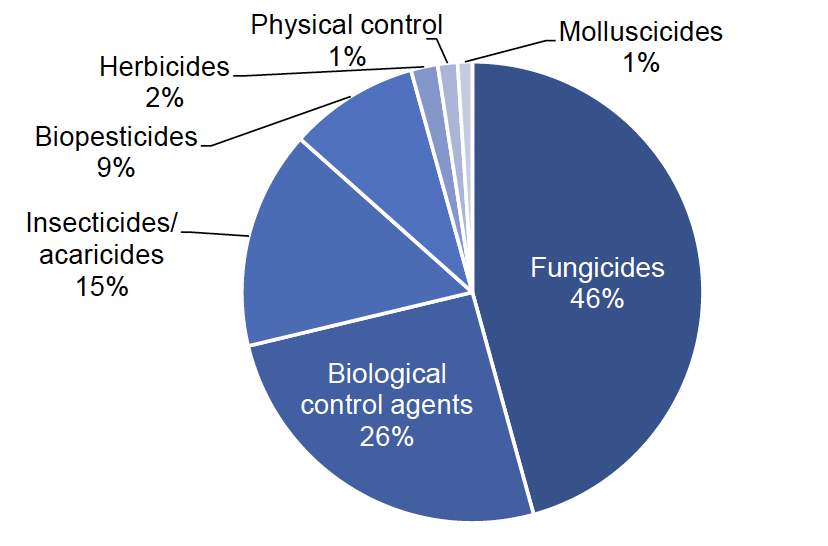
- All of the crop was treated with a pesticide (see Figure 11 for types of pesticides used)
- Pesticide formulations were applied to 27,746 treated hectares with 7,739 kilograms of pesticides applied in total (see summary table below)
- Protected strawberry crops received on average 18.9 pesticide applications (Table 1). These included 9.9 biological applications, 8.8 fungicide applications, 3.5 insecticide applications, 2.4 physical control applications, 1.3 herbicide/desiccant applications and 1.2 molluscicide applications (applied to 80, 99, 88, 13, 17, and 20 per cent of the crop respectively)
- The most common varieties encountered were Magnum and Malling Centenary, accounting for 26 and 22 per cent of the sample area respectively
| Pesticide group | Formulation area treated | Weight of pesticides applied | Percentage of crop treated | Most used formulations |
|---|---|---|---|---|
| ha | kg | % | ha | |
| Fungicides | 12,685 | 6,685 | 99 | Difenoconazole/ fluxapyroxad (1,630), cyprodinil/fludioxonil (1,302) |
| Biological control agents | 7,086 | [z] | Neoseiulus cucumeris (2,980) | |
| Insecticides/ acaricides | 4,252 | 323 | 88 | Spirotetramat (1,134), lambda-cyhalothrin (874), spinosad (617) |
| Biopesticides | 2,531 | 468 | Bacillus subtilis strain QST 713 (1,618) | |
| Herbicides | 522 | 102 | 17 | Carfentrazone-ethyl (258) |
| Physical control | 384 | 121 | 13 | Unspecified physical control agents(1) (220), carbonic acid diamide/urea (164) |
| Molluscicides | 286 | 41 | 20 | Ferric phosphate (286) |
| All pesticides | 27,746 | 7,739 | 100 |
(1) Refer to Appendix 3 for definitions.
Note: some shorthand is used in this table: [z] = not applicable.
All raspberries (protected and non-protected crops)
- An estimated 243 hectares of raspberries were grown in Scotland in 2022 (based on June 2021 Census areas – see changes from previous years section for further explanation). This consisted of 92 hectares of non-protected crops and 152 hectares of protected crop
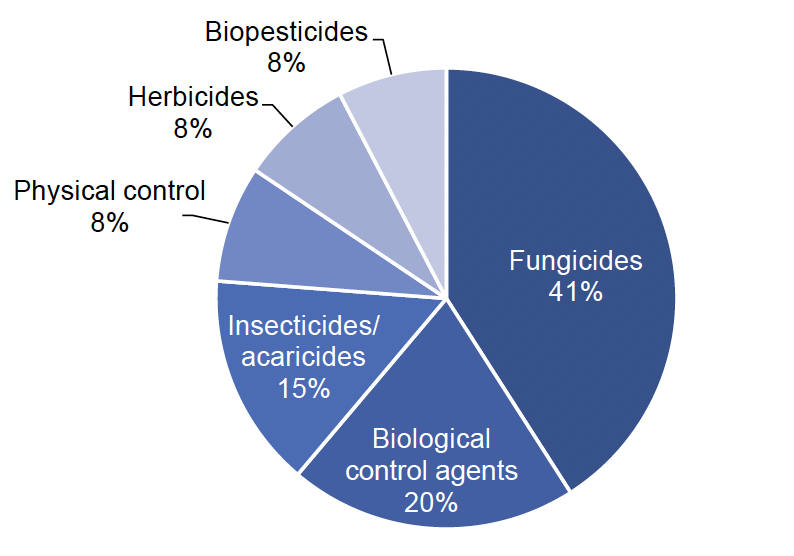
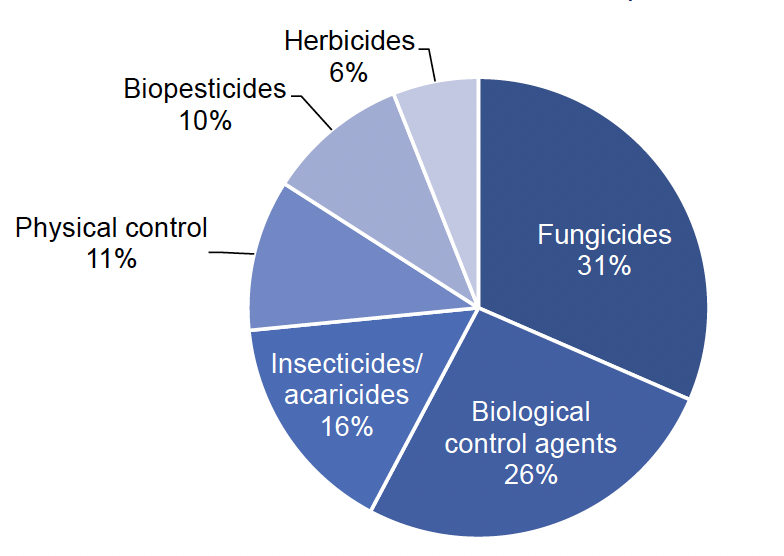
- Eighty-nine per cent of the crop was treated with a pesticide (See Figure 12 for the types of pesticides used)
- Pesticide formulations were applied to 2,192 treated hectares with 742 kilograms of pesticides applied in total (see summary table)
- The 89 per cent of raspberry crop treated with a pesticide received on average 8.9 pesticide sprays (Table 1). These included 5.1 biological applications, 3.8 fungicide applications, 2.2 physical control applications, 1.6 insecticide applications and 1.1 herbicide/desiccant applications (applied to 49, 86, 34, 84 and 53 per cent of the crop respectively)
- Fifty per cent of the raspberries encountered in the sample were under two years old, 23 per cent were between two and five years old and 15 per cent were over five years old. The age of the remainder (12 per cent) was unknown
- Eighty-four per cent of the crop sampled was grown in pots and 16 per cent was grown directly in the soil
- Seventy-seven per cent of the crop encountered was grown using a ground mulch
- Seventeen per cent of the raspberry crop sampled was grown outdoors, 33 per cent were in temporary tunnels and 50 per cent was grown under permanent tunnels
- Pollinators were used on 95 per cent of the raspberry crops surveyed. Of the sample area using pollinators, 50 per cent were bumble bees, 22 per cent were honeybees and 23 per cent used both bumble bees and honey bees
- Ninety-nine per cent of the raspberry crops surveyed were harvested in 2022. Eighty-three per cent were for fresh market, 16 per cent for processing and one per cent for pick-your-own
- The most common variety encountered was Glen Ample, accounting for 35 per cent of the sample area
| Pesticide group | Formulation area treated | Weight of pesticides applied | Percentage of crop treated | Most used formulations |
|---|---|---|---|---|
| ha | kg | % | ha | |
| Fungicides | 897 | 482 | 86 | Boscalid/pyraclostrobin (186) |
| Biological control agents | 443 | [z] | Amblyseius andersoni (137) | |
| Insecticides/ acaricides | 330 | 101 | 84 | Deltamethrin (182) |
| Physical control | 180 | 52 | 34 | Unspecified physical control agents(1) (110), carbonic acid diamide/urea (69) |
| Herbicides | 174 | 86 | 53 | Propyzamide (69) |
| Biopesticides | 168 | 21 | Bacillus subtilis strain QST 713 (135) | |
| All pesticides | 2,192 | 742 | 89 |
(1) Refer to Appendix 3 for definitions.
Note: some shorthand is used in this table: [z] = not applicable.
Non-protected raspberries
- An estimated 92 hectares of non-protected raspberries were grown in Scotland in 2022 (based on June 2021 Census areas – see changes from previous years section for further explanation). This included an estimated one hectare recorded in the mixed and other crop category in the census
- Seventy-one per cent of the crop was treated with a pesticide (see Figure 13 for types of pesticides used)
- Pesticide formulations were applied to 502 treated hectares with 198 kilograms of pesticide applied in total (see summary table below)
- Glen Ample was the most common named variety encountered, accounting for 93 per cent of the area sampled
| Pesticide group | Formulation area treated | Weight of pesticides applied | Percentage of crop treated | Most used formulations |
|---|---|---|---|---|
| ha | kg | % | ha | |
| Fungicides | 365 | 160 | 70 | Boscalid/pyraclostrobin (123) |
| Herbicides | 73 | 37 | 68 | Propyzamide (62) |
| Insecticides/ acaricides | 65 | 1 | 71 | Deltamethrin (57) |
| All pesticides | 502 | 198 | 71 |
(1) Refer to Appendix 3 for definitions.
Note: some shorthand is used in this table: [z] = not applicable.
Protected raspberries
- An estimated 152 hectares of protected raspberries were grown in Scotland in 2020 (based on June 2021 Census areas – see changes from previous years section for further explanation)
- Based on the ratio encountered in the sample, it is estimated that 65 per cent of the crop was semi-protected (grown under temporary tunnels) and 35 per cent was permanently protected (grown in permanent tunnels or glasshouses)
- More than ninety-nine per cent of the crop was treated with a pesticide (see Figure 14 for types of pesticides used)
- Pesticide formulations were applied to 1,690 treated hectares with 545 kilograms of pesticides applied in total (see summary table below)
- The protected raspberry crop received on average 9.8 pesticide applications (Table 1). These included 5.1 biological applications, 3.5 fungicide applications, 2.2 physical control applications, 1.8 insecticide applications, and 1.1 herbicide/desiccant applications (applied to 78, 95, 54, 91 and 43 per cent of the crop respectively)
- The most common varieties encountered were Driscoll’s Maravilla and Lagorai (24 per cent each) followed by Glen Ample accounting for 22 per cent of the sample area
| Pesticide group | Formulation area treated | Weight of pesticides applied | Percentage of crop treated | Most used formulations |
|---|---|---|---|---|
| ha | kg | % | ha | |
| Fungicides | 533 | 323 | 95 | Fenhexamid (169) |
| Biological control agents | 443 | [z] | Amblyseius andersoni (137) | |
| Insecticides/ acaricides | 265 | 101 | 91 | Deltamethrin (125) |
| Physical control | 180 | 52 | 54 | Unspecified physical control agents(1) (110), carbonic acid diamide/urea (69) |
| Biopesticides | 168 | 21 | Bacillus subtilis strain QST 713 (135) | |
| Herbicides | 101 | 49 | 43 | Carfentrazone-ethyl (42) |
| All pesticides | 1,690 | 545 | 99 |
(1) Refer to Appendix 3 for definitions.
Note: some shorthand is used in this table: [z] = not applicable.
Blackcurrants
- The total estimated area of blackcurrants grown in Scotland in 2022 was 311 hectares (based on June 2021 Census areas – see changes from previous years section for further explanation). This includes one hectare which was included in the mixed and other soft fruit census category
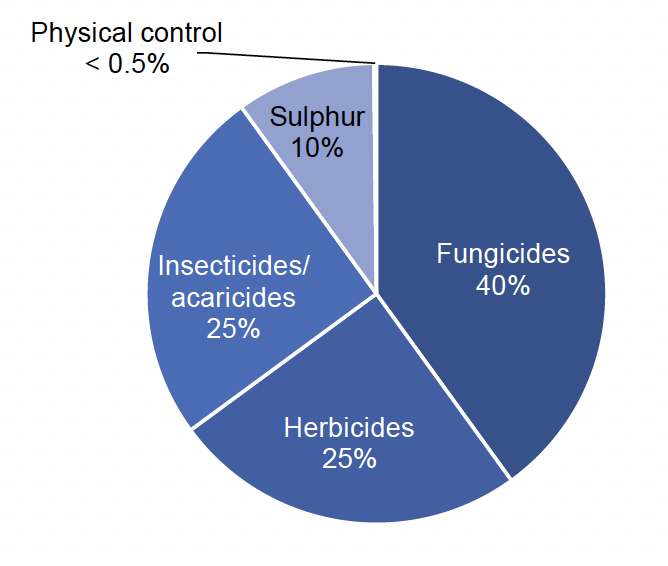
- Ninety-seven per cent of the cop was treated with a pesticide (see Figure 15 for types of pesticides used)
- Pesticide formulations were applied to 3,807 treated hectares with 3,921 kilograms of pesticide applied in total (see summary table below)
- The blackcurrant crop treated with a pesticide received on average 9.0 pesticide applications (Table 1). These included 6.1 fungicide applications, 3.1 insecticide applications, 1.8 herbicide/desiccant applications and 1.3 sulphur applications (applied to 91, 95, 94 and 91 per cent of the crop respectively)
- The most common variety encountered was Ben Starav, accounting for 33 per cent of the area sampled followed by Ben Klibreck at 29 per cent
- Seventy-three per cent of blackcurrants encountered were five years old or less, eight per cent were between six and 10 years old and below one per cent were older than 10 years with the remainder (19 per cent) unknown
- All blackcurrant crops sampled were grown in soil without protection
- Ninety-seven per cent of the blackcurrant crops surveyed were harvested in 2022
- Over ninety-nine per cent of the blackcurrant crops harvested were for processing, and under one per cent for fresh market and pick-your-own
| Pesticide group | Formulation area treated | Weight of pesticides applied | Percentage of crop treated | Most used formulations |
|---|---|---|---|---|
| ha | kg | % | ha | |
| Fungicides | 1,524 | 686 | 91 | Boscalid/pyraclostrobin (559) |
| Herbicides | 948 | 342 | 94 | Glyphosate (289) |
| Insecticides/ acaricides | 956 | 57 | 95 | Spirotetramat (343) |
| Sulphur | 373 | 2,838 | 91 | [z] |
| Physical control | 7 | [z] | 2 | Unspecified physical control agents(1) (7) |
| All pesticides | 3,807 | 3,923 | 97 |
(1) Refer to Appendix 3 for definitions.
Note: some shorthand is used in this table: [z] = not applicable.
All other soft fruit crops (protected and non-protected crops)
- An estimated 418 hectares of other soft fruit was grown in Scotland in 2022 (based on June 2021 Census areas – see changes from previous years section for further explanation). This consists of 157 hectares of non-protected crop and 261 hectares of protected crop
- The crops encountered in this category were blueberry, blackberry, gooseberry, honeyberry and redcurrant as well as minor crops; elderberry, loganberry, saskatoon and tayberry
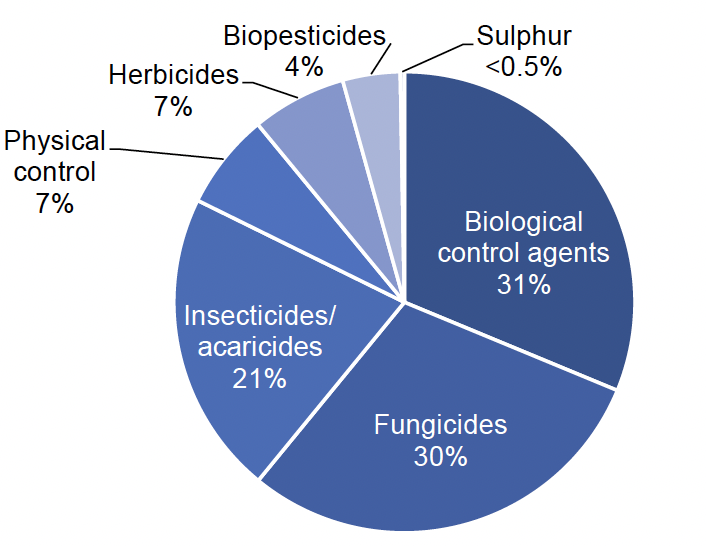
- Sixty-eight per cent of the other soft fruit crop was treated with a pesticide (see Figure 16 for types of pesticides used)
- Pesticide formulations were applied to 2,028 treated hectares with 466 kilograms of pesticide applied in total (see summary table below)
- The area of the crop treated with a pesticide received on average 6.7 pesticide applications (Table 1). These included 5.2 biological applications, 3.1 fungicide applications, 1.6 insecticide applications, 1.2 physical control applications and 1.1 herbicide/desiccant applications, (applied to 32, 46, 63, 26 and 28 per cent of the crop respectively)
- Forty-three per cent of other soft fruit crops sampled were five years old or less, 24 per cent were six to 10 years old, six per cent were over 10 years old and 27 per cent of the crop were an unknown age
- Forty per cent of the other soft fruit crops surveyed was grown in the soil and 57 per cent was grown in pots. Three per cent were grown in bags and troughs
- Eighteen per cent of the crop was grown outdoors, 54 per cent was grown under temporary tunnels and 28 per cent was grown under permanent protection
- Eighty-five per cent of the sampled crop was grown using a ground mulch
- Pollinators were used on 87 per cent of the other soft fruit crops sampled and thirteen per cent used no pollinators. Of the sample area using pollinators, 37 per cent were bumble bees, 38 per cent were both bumble bees and honey bees and 12 per cent were honey bees
- Ninety-six per cent of the crops surveyed were harvested in 2022. Of the crops harvested, 92 per cent was for fresh market, seven per cent was for processing and one per cent was for pick-your-own
| Pesticide group | Formulation area treated | Weight of pesticides applied | Percentage of crop treated | Most used formulations |
|---|---|---|---|---|
| ha | kg | % | ha | |
| Biological control agents | 634 | [z] | Steinernema kraussei (509) | |
| Fungicides | 602 | 358 | 46 | Fenhexamid (222) |
| Insecticides/ acaricides | 433 | 31 | 63 | Spinosad (246) |
| Physical control | 137 | 9 | 26 | Unspecified physical control agents(1) (126), carbonic acid diamide/urea (11) |
| Herbicides | 135 | 24 | 28 | Carfentrazone-ethyl (97) |
| Biopesticides | 82 | 21 | Bacillus subtilis strain QST 713 (40) | |
| Sulphur | 6 | 23 | 1 | [z] |
| All pesticides | 2,028 | 466 | 68 |
(1) Refer to Appendix 3 for definitions.
Note: some shorthand is used in this table: [z] = not applicable.
Non-protected other soft fruit crops
- An estimated area of 157 hectares of non-protected other soft fruit crops were grown in Scotland in 2022 (based on June 2021 Census areas – see changes from previous years section for further explanation)
- The crops encountered in this category were blueberry, gooseberry, honeyberry and redcurrant as well as minor crops; elderberry, loganberry, saskatoon and tayberry
- Twenty-two per cent of the crop was treated with a pesticide (see Figure 17 for the types of pesticides used)
- Pesticide formulations were applied to 89 treated hectares with 29 kilograms of pesticide applied in total (see summary table below)
- The treated area of the non-protected other soft fruit crop received on average 2.2 pesticide applications (Table 1). These applications included 1.4 insecticide applications and 1.3 herbicide/desiccant applications (applied to 14 and 11 per cent of the crop area)
| Pesticide group | Formulation area treated | Weight of pesticides applied | Percentage of crop treated | Most used formulations |
|---|---|---|---|---|
| ha | kg | % | ha | |
| Insecticides/ acaricides | 31 | 1 | 14 | Lambda-cyhalothrin (25) |
| Herbicides | 28 | 17 | 11 | Glyphosate (15) |
| Fungicides | 26 | 12 | 4 | Boscalid/pyraclostrobin (5), cyprodinil/fludioxonil (5), myclobutanil (5) |
| Physical control | 3 | [z] | 2 | Unspecified physical control agents(1) (3) |
| All pesticides | 89 | 29 | 22 |
(1) Refer to Appendix 3 for definitions.
Note: some shorthand is used in this table: [z] = not applicable.
Protected other soft fruit crops
- The total estimated area of protected other soft fruit crops in 2022 was 261 hectares (based on June 2021 Census areas – see changes from previous years section for further explanation). It is estimated that 80 per cent of the crop was semi-protected (grown under temporary tunnels) with 20 per cent grown under permanent tunnels or glasshouses
- The crops encountered in this category were blueberry, blackberry and redcurrants
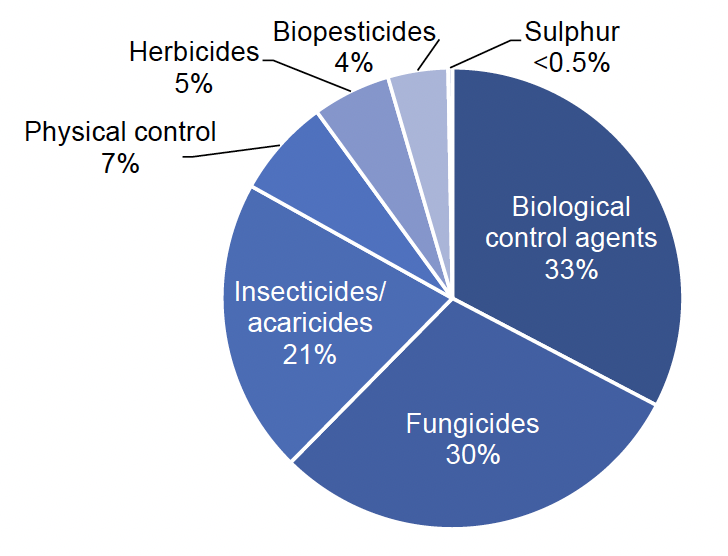
- Ninety-six per cent of the crop area was treated with a pesticide (see Figure 18 for types of pesticides used)
- Pesticide formulations were applied to 1,939 treated hectares with 437 kilograms of pesticide applied in total (see summary table below)
- The protected other soft fruit crop received on average 7.3 pesticide applications (Table 1). These applications included 5.2 biological applications, 3.1 fungicide applications, 1.6 insecticide applications, 1.2 physical control applications and one application of herbicide/desiccant (applied to 52, 71, 93, 41 and 37 per cent of the crop)
| Pesticide group | Formulation area treated | Weight of pesticides applied | Percentage of crop treated | Most used formulations |
|---|---|---|---|---|
| ha | kg | % | ha | |
| Biological control agents | 634 | [z] | Steinernema kraussei (509) | |
| Fungicides | 576 | 346 | 71 | Fenhexamid (220) |
| Insecticides/ acaricides | 402 | 30 | 93 | Spinosad (242) |
| Physical control | 134 | 9 | 41 | Unspecified physical control agents(1) (123) |
| Herbicides | 106 | 7 | 37 | Carfentrazone-ethyl (95) |
| Biopesticides | 82 | 21 | Bacillus subtilis strain QST 713 (40) | |
| Sulphur | 6 | 23 | 2 | [z] |
| All pesticides | 1,939 | 437 | 96 |
(1) Refer to Appendix 3 for definitions.
Note: some shorthand is used in this table: [z] = not applicable.
Contact
Email: psu@sasa.gov.scot