Pesticide usage in Scotland: soft fruit 2020
This publication presents information from a survey of pesticide use on soft fruit crops grown in Scotland during 2020.
Part of
2020 Pesticide usage
All strawberries (protected and non-protected crops)
- An estimated 1,221 hectares of strawberries were grown in Scotland in 2020. This consists of 31 ha of non-protected crops and 1,190 ha of protected crop
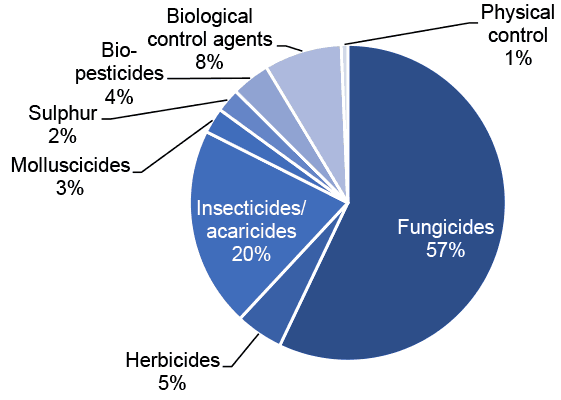
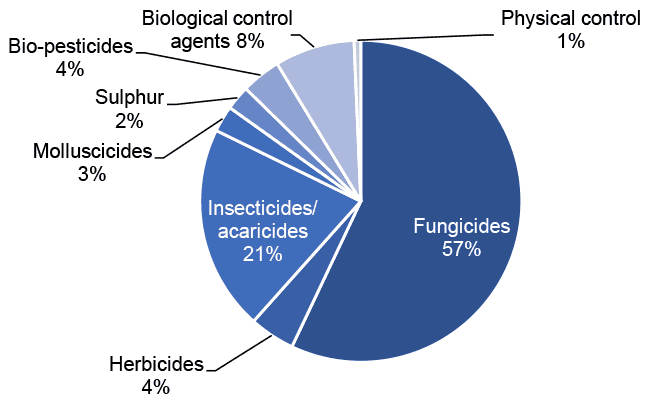
- Ninety-nine per cent of the crop was treated with a pesticide (see Figure 9 for types of pesticides used)
- Pesticide formulations were applied to 27,091 treated hectares with 10,511 kilograms of pesticide applied in total (see summary table)
- Strawberry crops received on average 14.9 applications (Table 1). These included 9.8 fungicide applications and 3.8 insecticide applications (applied to 99 and 93 per cent of the crop area). They also received on average 3.8 biological, 2 herbicide/desiccant and 1.5 molluscicide and sulphur applications (applied to 59, 27, 39 and 36 per cent respectively
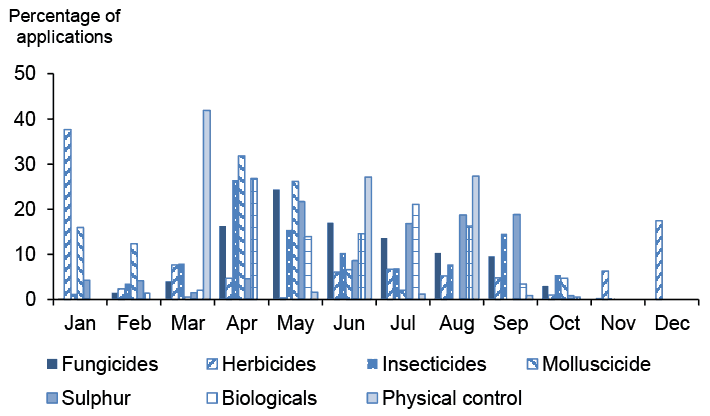
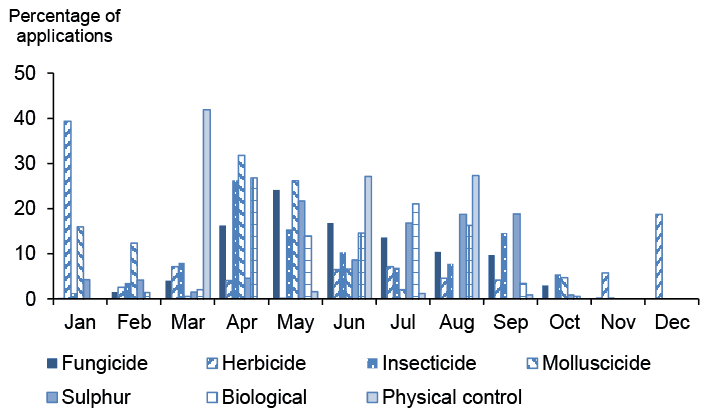
- Timings of pesticide applications are shown in Figure 10. The most common varieties encountered were Sonata and Malling Centenary, accounting for 28 and 24 per cent of the sample area respectively
- Reasons for fungicide use were supplied for 67 per cent of total use; 31 per cent for control of botrytis, 24 per cent for control of powdery mildew and 12 per cent for control of mildew. Three other reasons for fungicide use were all recorded at below one per cent
- Reasons for herbicide use were supplied for nine per cent of total use; slightly less than nine per cent for general weed control. Two other reasons accounted for less than one per cent each
- Reasons were supplied for 65 per cent of insecticide use; 22 per cent for the control of aphids, 15 per cent for spider mites, seven per cent for capsids, six per cent for thrips, three per cent each for two-spotted spider mite and general pests, two per cent for both tarsonemid mites and caterpillar control, and one per cent for control of flower thrips. Four other reasons accounted for less than one per cent in total
- Reasons for the use of biological control agents were supplied for 84 per cent of use; 22 per cent for two-spotted spider mite, 15 per cent for thrips, 12 per cent for vine weevil, 11 per cent for powdery mildew, eight per cent for aphids, six per cent for mildew, and four per cent for both spider mite and tarsonemid mite and two per cent for control of botrytis
- Reasons for the use of biopesticides were supplied for 61 per cent of use; 26 per cent for the control of botrytis, 16 per cent for mildew control, 14 per cent to control caterpillars and four per cent for powdery mildew. Two-spotted spider and thrips together accounted for approximately one per cent
- Reasons for physical control were provided for 99 per cent of total use; 23 per cent was for control of aphids and two-spotted spider mite and 18 per cent each for control of leaf hopper, spider mite and thrips.
- Nine per cent of strawberries encountered in the sample were under one year old, 47 per cent were between one and two years old, six per cent were over two years old with the remainder unknown
- Sixty-one per cent of the crop sampled was grown in a raised or tabletop system. 53 per cent of the crop sampled was grown in soil, with the remainder being grown in bags
- Sixty-seven per cent of the crop sampled was grown using a ground mulch or straw
- Ninety nine per cent of the crop sampled was grown under protection, of this 52 per cent was in permanent tunnels and 48 per cent was in temporary tunnels
- Pollinators were used on 98 per cent of the strawberry crop sampled;. Of the sampled area using pollinators, 58 per cent used bumble bees, 22 per cent used honey bees and 20 per cent used both bumble bees and honey bees
- All of the strawberry crops surveyed were harvested in 2020. Ninety-eight per cent were for fresh market, one per cent for pick-your-own and less than one per cent for processing
Summary of pesticide use on all strawberries:
| Pesticide group | Formulation area treated | Weight of pesticides applied | Percentage of crop treated | Most used formulations |
|---|---|---|---|---|
| ha | kg | % | ha | |
| Fungicides | 15,465 | 7,784 | 99 | Fenhexamid (1,978) Fluopyram/trifloxystrobin (1,766) |
| Herbicides | 1,314 | 766 | 27 | Carfentrazone-ethyl (252) |
| Insecticides/ acaricides | 5,548 | 1,050 | 93 | Spirotetramat (1,265), Lambda-cyhalothrin (798), Bifenazate (787) |
| Molluscicides | 706 | 114 | 39 | Ferric phosphate (388) Metaldehyde (318) |
| Sulphur | 661 | 586 | 36 | N/A |
| Biopesticides | 1,065 | 211 | Bacillus subtilis strain QST 713 (622) | |
| Biological control agents | 2,153 | N/A | Neoseiulus cucumeris (881) | |
| Physical control | 180 | N/A | 10 | Unspecified physical control agents (180) |
| All pesticides | 27,091 | 10,511 | 99 |
N/A = Not applicable
Note: Insecticides include acaricides and herbicides include desiccants. Biologicals includes biopesticides and biological control agents
Non-protected strawberries
- An estimated 31 hectares of non-protected strawberry were grown in Scotland in 2020. This included an estimated three hectares recorded in the mixed and other soft fruit section of the census
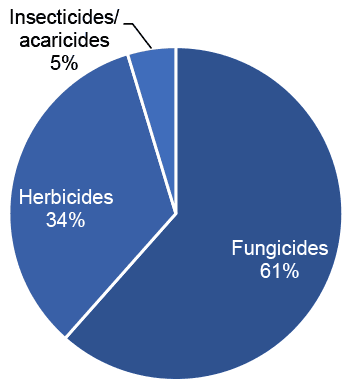
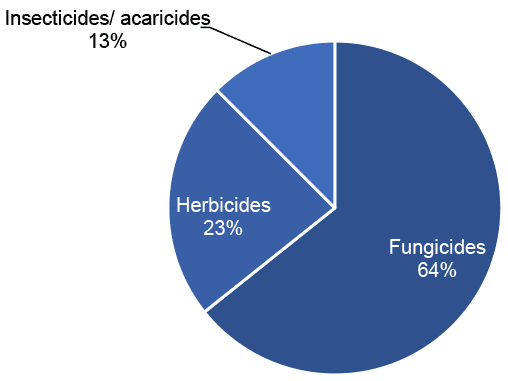
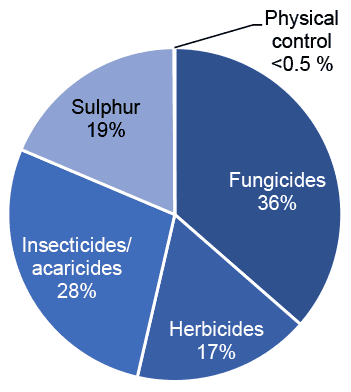
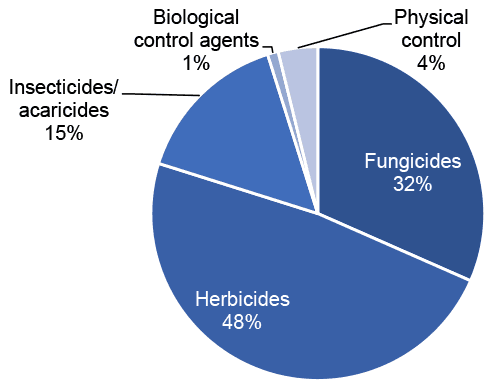
- Fifty-one per cent of the crop was treated with a pesticide (see Figure 11 for types of pesticides used)
- Pesticide formulations were applied to 263 treated hectares with 111 kilograms of pesticide applied in total (see summary table below)
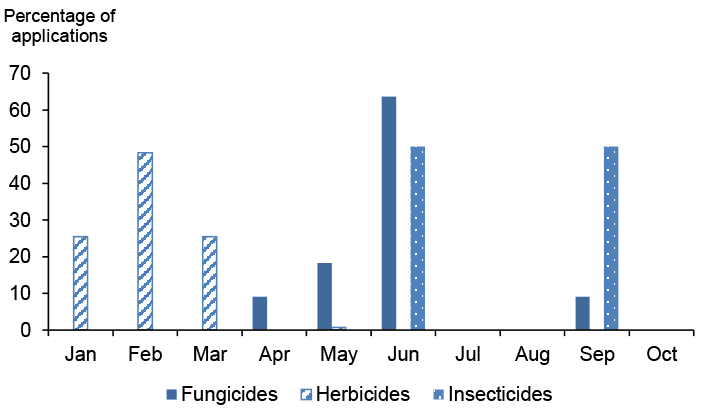
- The 51 per cent of non-protected strawberry crop treated with a pesticide received on average 10.9 spray applications (Table 1). These included 5.6 fungicide applications, 5.9 herbicide/desiccant applications and one insecticide (applied to 48, 48 and 39 per cent of the crop respectively)
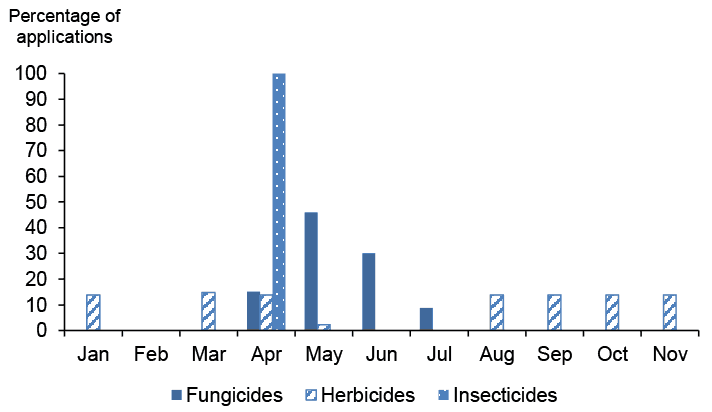
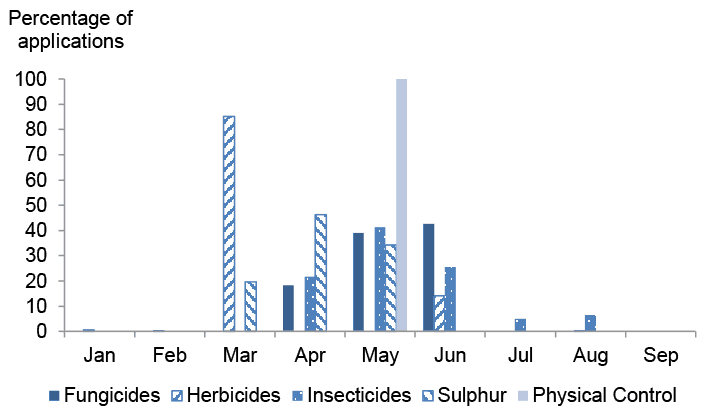
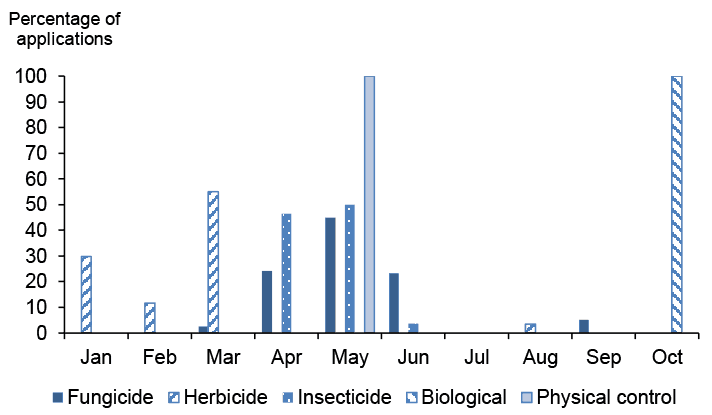
- Timings of pesticide applications are shown in Figure 12
- The most common varieties encountered were Symphony and Eros, accounting for 69 and 17 per cent of the sample area surveyed respectively.
Summary of pesticide use on non-protected strawberries:
| Pesticide group | Formulation area treated | Weight of pesticides applied | Percentage of crop treated | Most used formulations |
|---|---|---|---|---|
| ha | kg | % | ha | |
| Fungicides | 162 | 52 | 48 | Myclobutanil (31) |
| Herbicides | 89 | 58 | 48 | Clopyralid (25) |
| Insecticides/ acaricides | 12 | 1 | 39 | Thiacloprid (12) |
| All pesticides | 263 | 111 | 51 |
Note: Insecticides include acaricides and herbicides include desiccants
Protected strawberries
- An estimated 1,190 hectares of protected strawberry were grown in Scotland in 2020, including 25 hectares of multi-cropping. Based on the ratio encountered in the sample, it is estimated that 48 per cent of the crop was semi-protected (grown under temporary tunnels) and 52 per cent permanently protected (grown in permanent tunnels or glasshouses)
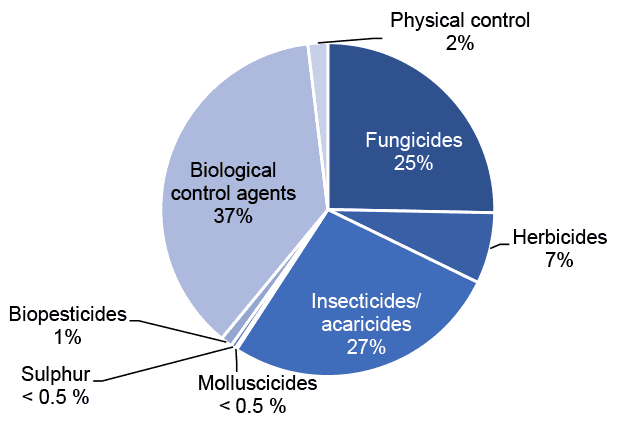
- All of the crop was treated with a pesticide (see Figure 13 for types of pesticides used)
- Pesticide formulations were applied to 26,828 treated hectares with 10,400 kilograms of pesticides applied in total (see summary table below)
- Protected strawberry crops received on average 15 pesticide applications (Table 1). These included 9.9 fungicide applications, 3.9 insecticide applications, 3.8 biological applications, 1.8 herbicide/desiccant, 1.5 sulphur applications, 1.5 molluscicide applications and 1.4 physical control applications (applied to 100, 94, 60, 27, 37, 40 and 11 per cent of the crop respectively)
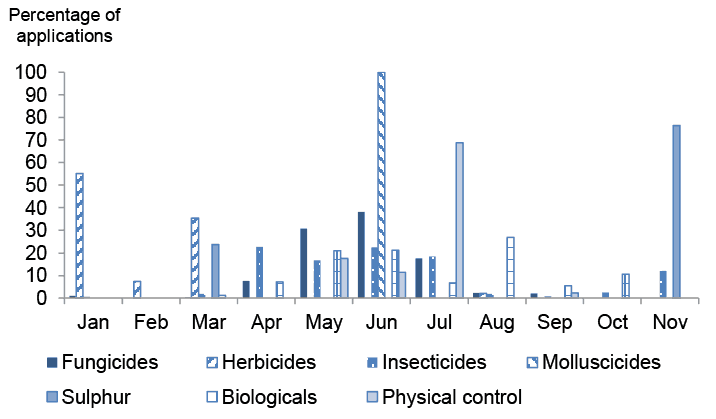
- The timing of pesticide applications is shown in Figure 14
- The most common varieties encountered were Malling Centenary and Sonata, accounting for 29 and 24 per cent of the sample area respectively
Summary of pesticide use on protected strawberries:
| Pesticide group | Formulation area treated | Weight of pesticides applied | Percentage of crop treated | Most used formulations |
|---|---|---|---|---|
| ha | kg | % | ha | |
| Fungicides | 15,303 | 7,732 | 100 | Fenhexamid (1,954) |
| Herbicides | 1,225 | 708 | 27 | Carfentrazone-ethyl (252) |
| Insecticides/ acaricides | 5,536 | 1,049 | 94 | Spirotetramat (1,265) |
| Molluscicides | 706 | 114 | 40 | Ferric phosphate (388) Metaldehyde (318) |
| Sulphur | 661 | 586 | 37 | N/A |
| Biopesticides | 1,065 | 211 | Bacillus subtilis strain QST 713 (622) | |
| Biological control agents | 2,153 | N/A | Neoseiulus cucumeris (881) | |
| Physical control | 180 | N/A | 11 | Unspecified physical control agents (180) |
| All pesticides | 26,828 | 10,400 | 100 |
N/A = not applicable
Note: Insecticides include acaricides and herbicides include desiccants. Biologicals includes biopesticides and biological control agents
All raspberries (protected and non-protected crops)
- An estimated 247 hectares of raspberries were grown in Scotland in 2020. This consists of 77 hectares of non-protected crops and 169 hectares of protected crop
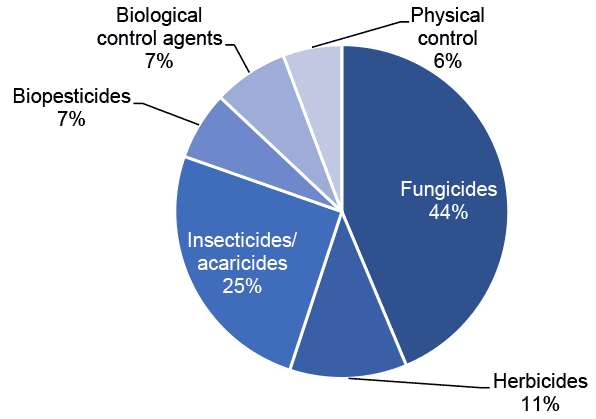
- Seventy-seven per cent of the crop was treated with a pesticide (See Figure 15 for the types of pesticides used)
- Pesticide formulations were applied to 1,652 treated hectares with 552 kilograms of pesticides applied in total (see summary table)
- The 70 per cent of raspberry crop treated with a pesticide received on average 8.5 pesticide sprays (Table 1). These included 4.1 fungicide applications, 3 insecticide applications, 2.2 biological applications, 2 physical control applications and 1.6 herbicide/desiccant applications (applied to 69, 51, 42, 19 and 37 per cent of the crop respectively)
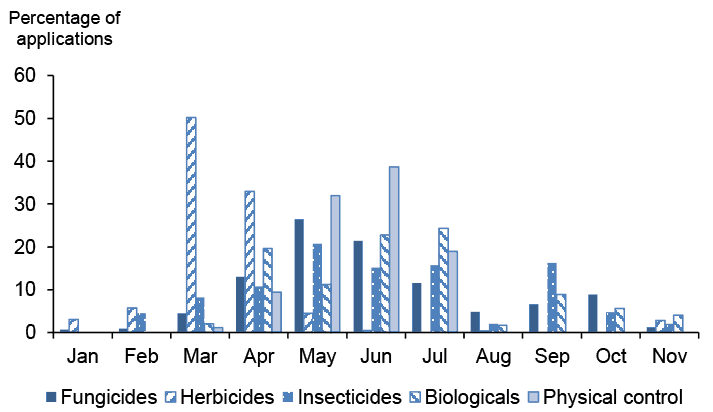
- Timings of pesticide applications are shown in Figure 16
- Reasons for fungicide applications were supplied for 53 per cent of total use; 36 per cent was for control of botrytis, four per cent for both cane blight and mildew, three per cent for rust, brown rot and root rot, and one per cent for disease control
- Reasons for herbicide/desiccant applications on raspberries were supplied for 76 per cent of use; 44 per cent was for general weed control, 31 per cent for sucker control, and less than one per cent for annual grass weeds
- Reasons were supplied for 41 per cent of insecticide use; 16 per cent was for aphid control, seven per cent for raspberry cane midge and raspberry beetle, four per cent for caterpillars, three per cent for both two-spotted spider mite and capsids, and less than one per cent for thrips
- Reasons for use of biological control agents were supplied for 85 per cent of total use; 69 per cent was for two-spotted spider mite control and 16 per cent for vine weevil.
- Reasons for the use of biopesticides were supplied for 18 per cent of use; 15 per cent for the control of two-spotted spider mite, and two per cent each for control of aphids and thrips
- Reasons for use of physical control were provided for 59 per cent of total use; 31, 15 and 13 per cent was for control of two-spotted spider mite, thrips and aphids respectively
- The most common variety encountered was Driscoll Maravilla, accounting for 43 per cent of the sample area
- 33 per cent of the raspberries encountered in the sample were under two years old, 33 per cent were between two and five years old. The age of the remainder was unknown
- 66 per cent of the crop sampled was grown in pots and 34 per cent was grown directly in the soil
- Fifty-one per cent of the crop encountered was grown using a ground mulch
- Six per cent of the raspberry crop sampled was grown outdoors, 43 per cent were in temporary tunnels and 52 per cent was grown under permanent tunnels
- Pollinators were used on 93 per cent of the raspberry crops surveyed. Of the sampled area using pollinators, 38 per cent were bumble bees, six per cent were honeybees and 56 per cent used both bumble bees and honey bees
- Ninety-seven per cent of the raspberry crops surveyed were harvested in 2020. Ninety-five per cent were for fresh market, three per cent for processing and two per cent for pick-your-own
Summary of pesticide use on all raspberries:
| Pesticide group | Formulation area treated | Weight of pesticides applied | Percentage of crop treated | Most used formulations |
|---|---|---|---|---|
| ha | kg | % | ha | |
| Fungicides | 722 | 427 | 69 | Fenhexamid (191) |
| Herbicides | 188 | 19 | 37 | Carfentrazone-ethyl (107) |
| Insecticides/ acaricides | 418 | 91 | 51 | Thiacloprid (114) |
| Biopesticides | 110 | 14 | Bacillus subtilis strain QST 713 (79) | |
| Biological control agents | 120 | N/A | Phytoseiulus persimilis (37) | |
| Physical control | 94 | N/A | 19 | Unspecified physical control agents (94) |
| All pesticides | 1,652 | 552 | 70 |
N/A = not applicable
Note: Insecticides include acaricides and herbicides include desiccants. Biologicals includes biopesticides and biological control agents
Non-protected raspberries
- An estimated 77 hectares of non-protected raspberries were grown in Scotland in 2020. This included an estimated six hectares recorded in the mixed and other crop category in the census
- Six per cent of the crop was treated with a pesticide (see Figure 17 for types of pesticides used)
- Pesticide formulations were applied to 56 treated hectares with 20 kilograms of pesticide applied in total (see summary table below)
- Timings of pesticide applications are shown in Figure 18
- Glen Ample was the most common named variety encountered, accounting for 28 per cent of the area sampled. For 58 per cent of the sample variety names were not supplied
Summary of pesticide use on non-protected raspberries:
| Pesticide group | Formulation area treated | Weight of pesticides applied | Percentage of crop treated | Most used formulations |
|---|---|---|---|---|
| ha | kg | % | ha | |
| Fungicides | 36 | 16 | 4 | Azoxystrobin (10) |
| Herbicides | 13 | 4 | 6 | Isoxaben (5), Pendimethalin (5) |
| Insecticides/ acaricides | 7 | < 0.5 | 4 | Lambda-cyhalothrin (3), Thiacloprid (3) |
| All pesticides | 56 | 20 | 6 |
Note: Insecticides include acaricides and herbicides include desiccants
Protected raspberries
- An estimated 169 hectares of protected raspberries were grown in Scotland in 2020. Based on the ratio encountered in the sample, it is estimated that 45 per cent of the crop was semi-protected (grown under temporary tunnels) and 55 per cent was permanently protected (grown in permanent tunnels or glasshouses)
- All the crop was treated with a pesticide (see Figure 19 for types of pesticides used)
- Pesticide formulations were applied to 1,597 treated hectares with 531 kilograms of pesticides applied in total (see summary table below)
- The protected raspberry crop received on average 8.5 pesticide applications (Table 1). These included 4 fungicide applications, 3.1 insecticide applications, 2.2 biological applications, 2 physical control applications and 1.6 herbicide/desiccant applications (applied to 99, 72, 61, 28 and 50 per cent of the crop respectively)
- Timings of pesticide applications are shown in Figure 20
- The most common variety encountered was Driscoll Maravilla, accounting for 45 per cent of the sample area
Summary of pesticide use on protected raspberries:
| Pesticide group | Formulation area treated | Weight of pesticides applied | Percentage of crop treated | Most used formulations |
|---|---|---|---|---|
| ha | kg | % | ha | |
| Fungicides | 686 | 411 | 99 | Fenhexamid (188) |
| Herbicides | 175 | 15 | 50 | Carfentrazone-ethyl (106) |
| Insecticides/ acaricides | 412 | 91 | 72 | Thiacloprid (111), Lambda-cyhalothrin (107) |
| Biopesticides | 110 | 14 | Bacillus subtilis strain QST 713 (79) | |
| Biological control agents | 120 | N/A | Phytoseiulus persimilis (37), Neoseiulus cucumeris (33) | |
| Physical control | 94 | N/A | 28 | Unspecified physical control agents (94) |
| All pesticides | 1,597 | 531 | 100 |
N/A = not applicable
Note: Insecticides include acaricides and herbicides include desiccants. Biologicals includes biopesticides and biological control agents
Blackcurrants
- The total estimated area of blackcurrants grown in Scotland in 2020 was 299 hectares. This includes ten hectares which were included in the mixed and other soft fruit census category
- Ninety-six per cent of the cop was treated with a pesticide (see Figure 21 for types of pesticides used)
- Pesticide formulations were applied to 3,998 treated hectares with 5,414 kilograms of pesticide applied in total (see summary table below)
- The blackcurrant crop treated with a pesticide received on average 7.6 pesticide applications (Table 1). These included 3.9 fungicide applications, 2.9 sulphur applications, 2.8 insecticide applications and 1.4 herbicide/desiccant applications (applied to 95, 85, 95 and 82 per cent of the crop respectively)
- Timings of pesticide applications are shown in Figure 22
- Reasons for fungicide applications were supplied for 49 per cent of total use; 17 per cent to control botrytis and slightly more than 10 per cent each for control of mildew, big bud mite and leaf spot
- Reasons for herbicide use were supplied for less than one per cent of total use.
- Reasons for insecticide applications were supplied for 32 per cent of total use, with control of aphids being the only reason given.
- The most common variety encountered was Ben Kilbreck, accounting for 53 per cent of the area sampled
- Fifty per cent of blackcurrants encountered were five years old or less, 40 per cent were between six and 10 years old and eight per cent were older than 10 years with the remainder unknown
- All blackcurrant crops sampled were grown in soil without protection
- Eighty-nine per cent of the blackcurrant crops surveyed were harvested in 2020
- Almost 99 per cent of the blackcurrant crops harvested were for processing, and under one per cent for fresh market and pick-your-own
Summary of pesticide use on blackcurrants:
| Pesticide group | Formulation area treated | Weight of pesticides applied | Percentage of crop treated | Most used formulations |
|---|---|---|---|---|
| ha | kg | % | ha | |
| Fungicides | 1,457 | 591 | 95 | Boscalid/pyraclostrobin (535) |
| Herbicides | 687 | 315 | 82 | Flufenacet/metribuzin (242), Pendimethalin (242) |
| Insecticides/ acaricides | 1,110 | 44 | 95 | Lambda-cyhalothrin (538) |
| Sulphur | 742 | 4,465 | 85 | N/A |
| Physical control | 3 | N/A | 1 | Unspecified physical control agents (3) |
| All pesticides | 3,998 | 5,414 | 96 |
N/A = not applicable
Note: Insecticides include acaricides and herbicides include desiccants
All other soft fruit crops (protected and non-protected crops)
- An estimated 426 hectares of other soft fruit was grown in Scotland in 2020. This consists of 153 hectares of non-protected crop and 273 hectares of protected crop
- The crops encountered in this category were blueberry, blackberry, gooseberry and redcurrant as well as minor crops; honeyberry, jostaberry, loganberry, tayberry, tummelberry and whitecurrant
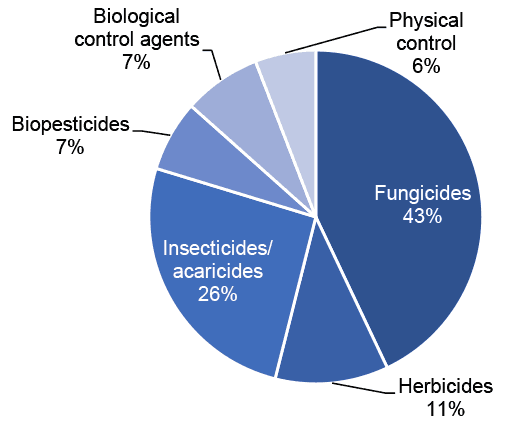
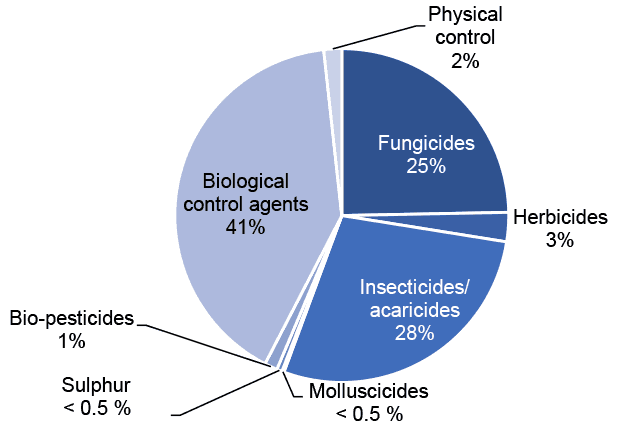
- Seventy-three per cent of the other soft fruit crop was treated with a pesticide (see Figure 23 for types of pesticides used)
- Pesticide formulations were applied to 3,205 treated hectares with 697 kilograms of pesticide applied in total (see summary table below)
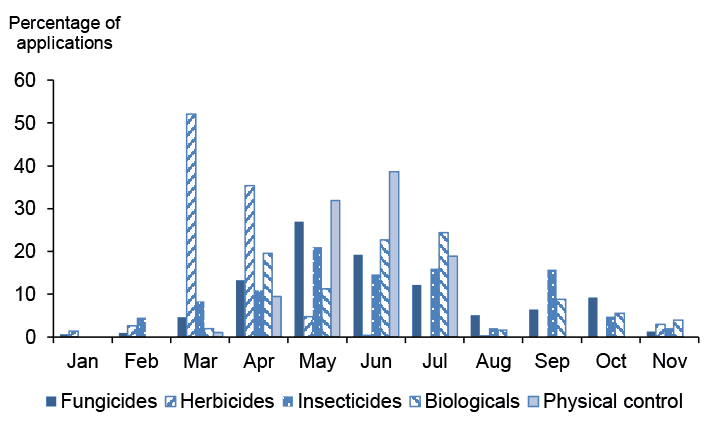
- The area of the crop treated with a pesticide received on average 9.3 pesticide applications (Table 1). These included 5.9 biological applications, 3.4 fungicide applications, 3.1 insecticide applications, 1.5 herbicide/desiccant applications and 1.4 physical control applications (applied to 48, 55, 66, 16 and 11 per cent of the crop respectively)
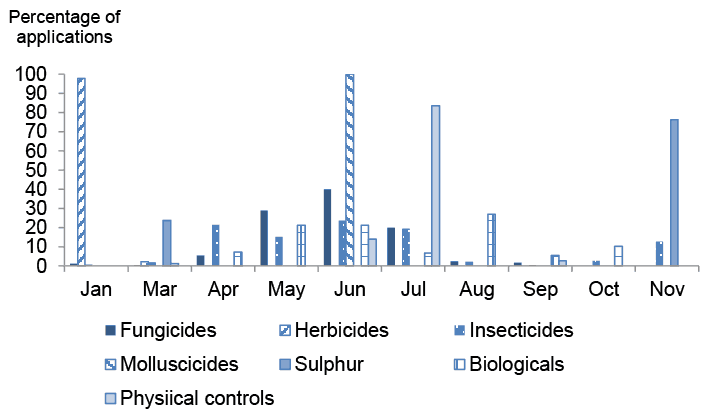
- Timings of pesticide applications are shown in Figure 24
- Reasons were supplied for 39 per cent of fungicide use; 30 per cent was for botrytis control, three per cent was for mildew, two per cent each for rust, purple blotch and cane blight and less than one per cent for powdery mildew
- Reasons were provided for 12 per cent of herbicide use; five per cent was for annual grass weeds, four per cent for general weed control and three per cent for willowherb
- Reasons were supplied for 65 per cent of insecticide use; 34 per cent was for aphid control, 13 per cent for caterpillar control, five per cent for blueberry midge capsids, four per cent for gall midge, two per cent each for blackberry mite, four per cent each for sawfly and capsid control, three per cent for control of spotted wing drosophila, with four other reasons provided for less than one per cent each.
- Reasons for the use of biological control agents were supplied for 41 per cent of use; 33 per cent for control of vine weevil, four per cent for two-spotted spider mite, two per cent for control of thrips and one per cent for aphids
- Reasons supplied for biopesticide use were supplied for 62 per cent of use; 27 per cent for control of botrytis and 23 per cent each for the control of thrips and two-spotted spider mite and 18 per cent for the control of powdery mildew
- Reasons for physical control were supplied for 100 per cent of use; 73 per cent for control of aphids, 14 and 12 per cent for control of spider mite and two-spotted spider mite respectively
- Thirty-five per cent of other soft fruit crops sampled were five years old or less, eight per cent were six to 10 years old, one per cent were over 10 years old and 56 per cent of the crop were an unknown age
- Thirty-six per cent of the other soft fruit crops surveyed was grown in the soil and 64 per cent was grown in pots
- Five per cent of the crop was grown outdoors, 20 per cent was grown under temporary tunnels and 75 per cent was grown under permanent protection
- Sixty-seven per cent of the sampled crop was grown using a ground mulch
- Pollinators were used on 96 per cent of the other soft fruit crops sampled, three per cent had no pollinators and the remainder was unknown. Of the sampled area using pollinators, 48 per cent were bumble bees, 50 per cent were both bumble bees and honey bees and under two per cent were honey bees
- Ninety-nine per cent of the crops surveyed were harvested in 2020. Of the crops harvested, 99 per cent was for fresh market, one per cent was for pick-your-own and the remainder was for processing
Summary of pesticide use on all other soft fruits:
| Pesticide group | Formulation area treated | Weight of pesticides applied | Percentage of crop treated | Most used formulations |
|---|---|---|---|---|
| ha | kg | % | ha | |
| Fungicides | 811 | 432 | 55 | Fenhexamid (252) |
| Herbicides | 221 | 120 | 16 | Flufenacet/metribuzin (46) |
| Insecticides/ acaricides | 865 | 75 | 66 | Thiacloprid (514) |
| Molluscicides | 6 | 1 | 1 | Ferric phosphate (6) |
| Sulphur | 15 | 60 | 3 | N/A |
| Biopesticides | 36 | 9 | Beauveria bassiana ATCC - 74040 (15), Bacillus subtilis strain QST 713 (14) | |
| Biological control agents | 1,190 | N/A | Heterorhabditis bacteriophora (826) | |
| Physical control | 61 | N/A | 11 | Unspecified physical control agents (61) |
| All pesticides | 3,205 | 697 | 73 |
N/A = not applicable
Note: Insecticides include acaricides and herbicides include desiccants. Biologicals includes biopesticides and biological controls agents
Non-protected other soft fruit crops
- An estimated area of 153 hectares of non-protected other soft fruit crops were grown in Scotland in 2020
- The crops encountered in this category were blueberry, blackberry, gooseberry and redcurrant as well as minor crops; honeyberry, jostaberry, loganberry, tayberry, tummelberry and whitecurrant
- Twenty-six per cent of the crop was treated with a pesticide (see Figure 25 for the types of pesticides used)
- Pesticide formulations were applied to 288 treated hectares with 82 kilograms of pesticide applied in total (see summary table below)
- The treated area of the non-protected other soft fruit crop received on average 4.4 pesticide applications (Table 1). These applications included 3.6 fungicide applications, 2 insecticide applications and 1.8 herbicide/desiccant applications (applied to 16, 14 and 26 per cent of the crop area)
- The timings of pesticide applications are shown in Figure 26)
Summary of pesticide use on non-protected other soft fruit:
| Pesticide group | Formulation area treated | Weight of pesticides applied | Percentage of crop treated | Most used formulations |
|---|---|---|---|---|
| ha | kg | % | ha | |
| Fungicides | 91 | 12 | 16 | Myclobutanil (59) |
| Herbicides | 139 | 68 | 26 | Glyphosate (30), Pendimethalin (29) |
| Insecticides/ acaricides | 44 | 3 | 14 | Lambda-cyhalothrin (25), Thiacloprid (20) |
| Biological control agents | 3 | N/A | Heterorhabditis bacteriophora (3) | |
| Physical control | 11 | N/A | 7 | Unspecified physical control agents (11) |
| All pesticides | 288 | 82 | 26 |
N/A = not applicable
Note: Insecticides include acaricides and herbicides include desiccants. Biologicals includes biological control agents
Protected other soft fruit crops
- The total estimated area of protected other soft fruit crops in 2020 was 273 hectares. It is estimated that 61 per cent of the crop was semi-protected (grown under temporary tunnels) with 39 per cent grown under permanent tunnels or glasshouses
- The crops encountered in this category were blueberry and blackberry
- All of the crop area was treated with a pesticide (see Figure 27 for types of pesticides used)
- Pesticide formulations were applied to 2,918 treated hectares with 616 kilograms of pesticide applied in total (see summary table below)
- The protected other soft fruit crop received on average 10.1 pesticide applications (Table 1). These applications included six biological applications, 3.4 fungicide applications, 3.1 insecticide applications, 1.5 physical control applications and one herbicide/desiccant application (applied to 74, 77, 95, 13 and 11 per cent of the crop)
- The timings of pesticide applications are shown in Figure 28
Summary of pesticide use on protected other soft fruits:
| Pesticide group | Formulation area treated | Weight of pesticides applied | Percentage of crop treated | Most used formulations |
|---|---|---|---|---|
| ha | kg | % | ha | |
| Fungicides | 721 | 420 | 77 | Fenhexamid (250) |
| Herbicides | 83 | 52 | 11 | Diquat, Flufenacet/metribuzin, Napropamide (all 27) |
| Insecticides/ acaricides | 820 | 72 | 95 | Thiacloprid (494) |
| Molluscicides | 6 | 1 | 2 | Ferric phosphate (6) |
| Sulphur | 15 | 60 | 5 | N/A |
| Biopesticides | 36 | 9 | Beauveria bassiana ATCC - 74040 (15) | |
| Biological control agents | 1,186 | N/A | Heterorhabditis bacteriophora (822) | |
| Physical control | 51 | N/A | 13 | Unspecified physical control agents (51) |
| All pesticides | 2,918 | 616 | 100 |
Note: Insecticides include acaricides and herbicides include desiccants. Biologicals includes biopesticides and biological control agents
Contact
Email: psu@sasa.gov.scot