Pesticide usage in Scotland: soft fruit 2020
This publication presents information from a survey of pesticide use on soft fruit crops grown in Scotland during 2020.
Part of
Appendix 6 – Integrated pest management
It is a requirement of the retained EU law Directive 2009/128/EC of the European Parliament and of the Council(12) (equivalent to the EU Sustainable use of Pesticides Directive 2009/128/EC) that member states should promote low pesticide input pest management, in particular Integrated Pest Management (IPM). The Directive defines IPM as follows “‘integrated pest management’ means careful consideration of all available plant protection methods and subsequent integration of appropriate measures that discourage the development of populations of harmful organisms and keep the use of plant protection products and other forms of intervention to levels that are economically and ecologically justified and reduce or minimise risks to human health and the environment. ‘Integrated pest management’ emphasises the growth of a healthy crop with the least possible disruption to agro-ecosystems and encourages natural pest control mechanisms.”
Information about the uptake of IPM measures by Scottish growers was collected alongside the 2020 soft fruit pesticide usage survey. IPM data have previously been collected and published for all crop groups in our cycle of pesticide usage surveys (vegetable crops 2015 and 2019, protected edible crops 2015 and 2019, arable crops 2016, soft fruit crops 2016 and fodder crops 2017). Our intention is to monitor IPM uptake in each crop sector every four years. This 2020 IPM survey represents the second in the series of surveys of IPM measures on soft fruits, allowing the adoption of IPM techniques to be monitored. These datasets will be used as an indicator of the success of Scottish Government funded IPM research, knowledge transfer and promotion activities.
Unlike the other statistics in this report, the figures reported in this section are not raised to produce national estimates but represent only the responses of those surveyed. The IPM sample, whilst smaller than that sampled for the pesticide usage survey, provides a good representation of Scottish regions and farm size groups.
Pearson chi-square tests were used to assess statistical evidence for changes, with permutation tests used when expected values were five or less. When comparing between 2016 and 2020, any evidence of a statistical change in the proportion of growers reporting under a category is indicated by a p-value. Any other notable differences that might indicate a direction of travel are also recorded in the text. If no comparison is made, then the responses recorded are similar between 2016 and 2020. It is worth noting that the sample size was much larger in the 2020 survey (50 holdings verses 33 holdings in 2016) therefore may be more representative of the population. Also, the average holding size in the 2020 survey was 13.9 ha of soft fruit compared to 8.1 ha in 2016 which may influence the responses to the survey questions. These factors should be taken into consideration when making comparison between 2020 and 2016.
In total IPM data was collected from 40 growers representing 50 holdings and collectively growing 695 ha of crops. This sample represented 32 per cent of Scotland’s 2020 soft fruit area. Of these growers, 48 per cent had an IPM plan (30 per cent completed their own IPM plan and 18 per cent had a plan completed by their agronomist) and 52 per cent did not have an IPM plan (Figure 30). This provides some evidence that the proportion of growers completing an IPM plan has increased from the 2016 survey where 18 per cent of growers had an IPM plan (p-value = 0.12). Using an IPM plan helps growers to make the best possible, and most sustainable, use of all available methods for pest control.
Since the 2016 survey, the requirement to complete an IPM plan has been added to some farm assurance schemes; for example, farmers certified with Red Tractor are required to complete the NFU/VI IPM plan(13).
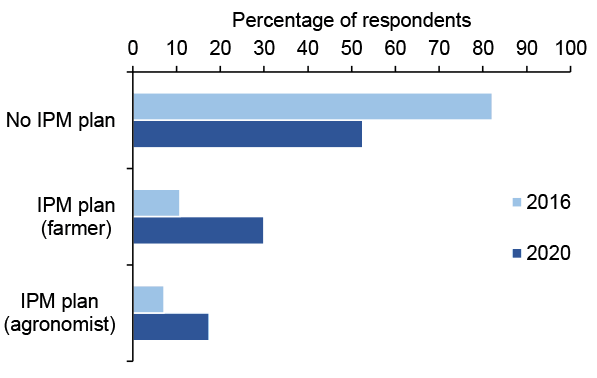
Note: The proportion of growers completing an IPM plan has increased from 2016 to 2020 (p-value = 0.12)
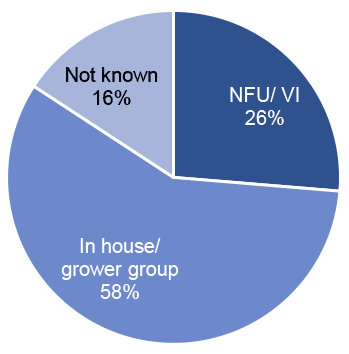
Although more plans were completed in 2020 there was little change in the proportions of plans completed by growers or by agronomist. Of those completing a plan, agronomists completed 37 per cent in 2020 and 40 per cent in 2016. Of those growers who had an IPM plan in 2020, either completed themselves or by their agronomist, 26 per cent used the NFU/VI IPM plan, 58 per cent used an in house or grower group plan and 16 per cent did not know the type of plan that was being used (Figure 31). Two respondents stated that they had more than one type of plan being used on their holdings and included plans with biocontrol companies.
Farmers were asked about their IPM activities in relation to three categories; risk management, pest monitoring and pest control. Information was collected about all activities each grower conducted in relation to these categories and the responses are reported in the following sections. The term ‘pest’ is used throughout to denote diseases, weeds and invertebrate pests.
Risk management
IPM programmes aim to prevent, or reduce, the risk of pests becoming a threat by minimising the likelihood of damage occurring that will require subsequent control. Table 37 presents an overview of the risk management measures adopted by those growers surveyed. In both 2020 and 2016, all growers sampled reported that they implemented at least one measure associated with an IPM risk management approach. There were no statistically significant differences in the responses to summary risk management questions between 2016 and 2020.
Forty-three per cent of growers in 2020 and 54 per cent in 2016 used crop rotation to reduce the risk of pest damage. Rotation breaks the link between pathogen and host, reducing pest population build-up. It can also improve soil fertility and structure, and consequently crop vigour. Sixty-three per cent tested their soil in order to tailor inputs to improve crop performance in 2020, this was an increase from 54 per cent in 2016 (Table 37). Soil testing allows growers to make informed decisions about the inputs required and optimal crop choice for their land. Most testing encountered in 2020 was for pH or lime (50 per cent). This was the biggest change observed from 2016, however, growers were not asked directly about testing soil for pH in 2016, therefore these responses are underestimated in 2016 and classified under ‘Other’ (Figure 32). The proportions of growers testing for nutrients were similar in both surveys (50 per cent in 2016 to 48 per cent in 2020). There was a decrease in 2020 for testing for nematodes (14 per cent to five per cent). In 2020, more growers indicated that they tested for general diseases than in 2016 (four per cent to 10 per cent). Respondents indicated that the majority of the disease testing in 2020 was for verticillium wilt.
| Risk management activity | Percentage positive response | |
|---|---|---|
| 2020 | 2016 | |
| Crop rotation | 43 | 54 |
| Soil testing | 63 | 54 |
| Cultivation of seed bed to reduce pest risk | 50 | 61 |
| Cultivation at sowing to reduce pest risk | 50 | 39 |
| Varietal or seed choice to reduce pest risk | 45 | 57 |
| Catch and cover cropping | 18 | 29 |
| Protection or enhancement of beneficial organism populations | 93 | 82 |
| Manipulation of environmental factors | 50 | 32 |
| Crop hygiene | 90 | 93 |
| Any risk management activity | 100 | 100 |
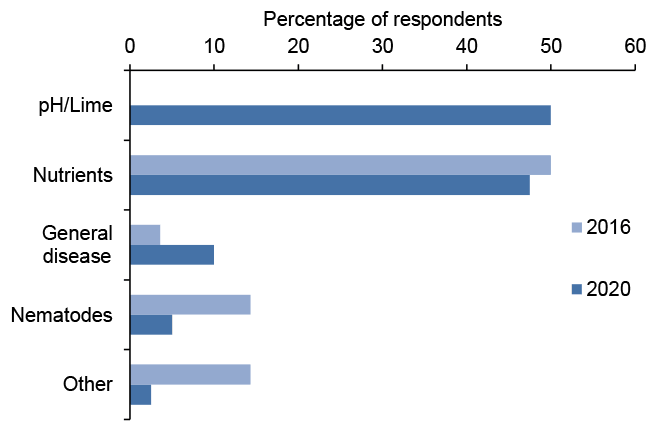
Note: In 2016 growers were not directly asked about testing for pH or lime. However, pH testing was recorded under ‘Other’ in 2016. Therefore the 2016 data are underestimated
‘Other’ in 2020 included tests for vine weevil
‘Other’ in 2016 included pH and water tests
Half of growers in 2020 (50 per cent) and 61 per cent in 2016 reported that they managed their seed bed agronomy to improve crop performance and reduce pest risk (Table 37). In 2020, 35 per cent of growers increased soil organic matter which was a decrease from 50 per cent in 2016. In 2020, three per cent used a stale seed bed for weed management with 18 per cent in 2016 (Figure 33). Stale seed beds allow weeds to germinate before sowing the next crop; these are often treated with a herbicide, depleting the seed bank, and resulting in lower weed pressure, and potentially pesticide use in the succeeding crop. Eight per cent of growers considered pest management when planning irrigation and drainage, an increase from four per cent in 2016. Three per cent of growers also considered pest management when planning crop nutrition however this question was not asked directly in 2016 and cannot be compared. Other methods employed by growers in 2020 included soil cultivation (eight per cent) and ridge cultivation (13 per cent). Ridge cultivation can lower the risk of infection with root rots especially in heavier soils. For comparison in 2016, 14 per cent carried out soil cultivation and seven per cent ridge cultivation. In 2016, other techniques included using raised beds. In 2020, 50 per cent of growers amended cultivation methods at sowing with the aim of increasing crop success, an increase from the 39 per cent in 2016 (Table 37). Twenty per cent varied the planting distance and three per cent varied the sowing date in 2020. In 2016, seven per cent varied the planting distance and four per cent varied the sowing date. Three per cent used a growing media made of peat and 28 per cent used coir in 2020. In contrast, four per cent used coir and 25 per cent used peat in 2016. Three per cent used other cultivation methods at sowing in 2020, slightly less than in 2016 (seven per cent) (Figure 34).
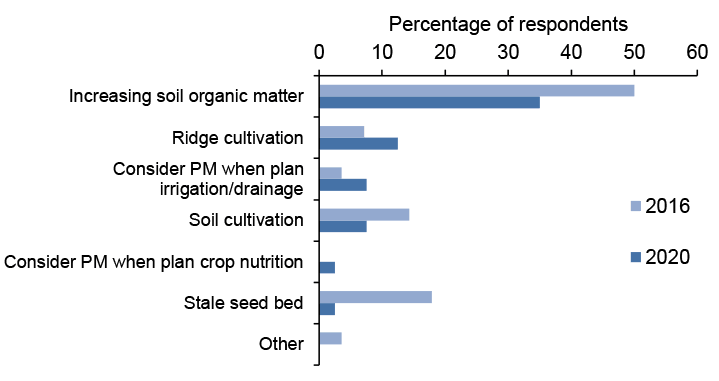
Note: ‘Other’ in 2016 includes using raised beds
PM = pest management
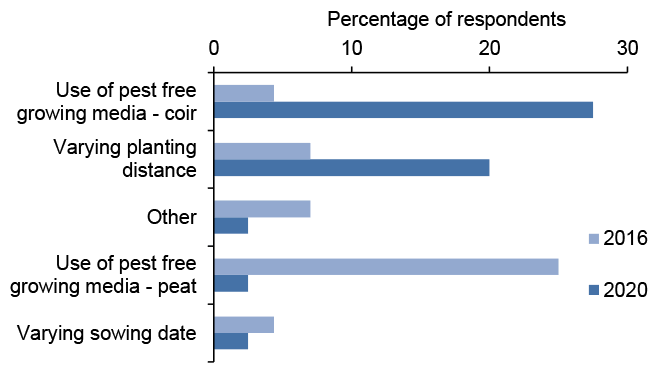
Note: ‘Other’ in 2020 includes using an unspecified growing media
‘Other’ in 2016 includes varying planting depth and new soils
Forty-five per cent of growers in 2020 and 57 per cent in 2016 considered risk management when selecting seeds and/or varieties (Table 37). Forty-five per cent selected pest resistant varieties to reduce damage and the need for pesticide input and 20 per cent of growers used diversification of varieties to increase overall crop resilience to pests and environmental stresses in 2020. These are both increases from 2016 with 43 per cent using resistant varieties and 11 per cent using diversification of varieties. In 2020 there were decreases in the proportion of growers using certified seed and testing home saved seed when compared to 2016 (Figure 35). In 2016, 32 per cent of growers used certified seed and four per cent tested home saved seed. No growers indicated that they used either of these techniques in 2020. Other techniques used in 2016 included buying variety suited to the growing region and buying plants from a recommended organic supplier.
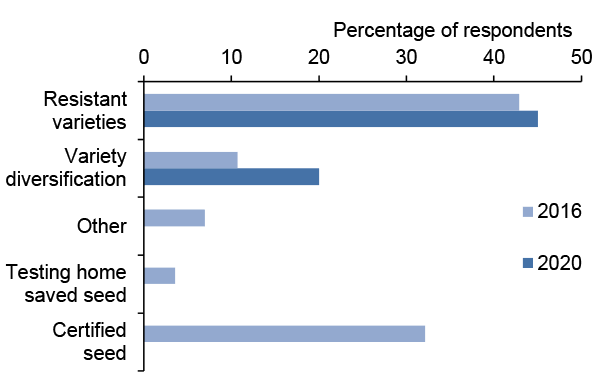
Note: ‘Other’ in 2016 includes buying variety suited to the growing region and buying plants from a recommended organic supplier
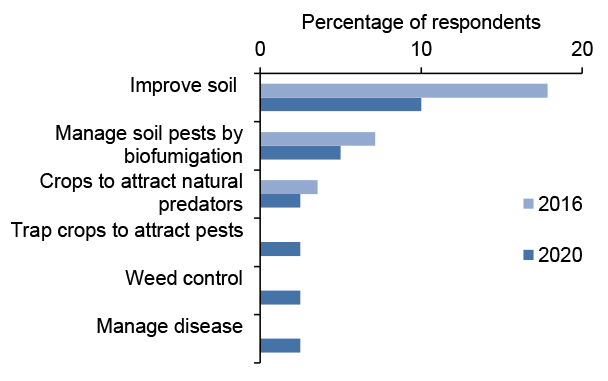
Eighteen per cent of growers sowed catch or cover crops in 2020, a decrease from 29 per cent in 2016 (Table 37). In 2020, 10 per cent of growers used cover and catch crops such as clover and phacelia to improve soil quality, a decrease from 18 per cent in 2016. Three per cent were used to suppress weeds, three per cent used crops such as oilseed radish to attract natural predators (similar to four per cent in 2016), five per cent used crops such as mustard with bio-fumigation properties (a decrease from seven per cent in 2016) and three per cent used crops to manage disease. Three per cent used trap crops to attract pests.
Ninety-three per cent of growers stated that they adopted techniques to protect or enhance populations of beneficial organisms, an increase from 82 per cent in 2016 (Table 37). In 2020 there were increases in all of the categories surveyed when last asked in 2016 except for push-pull strategies and pollen sources (Figure 37). Seventy per cent left uncultivated areas, including leaving margins, headlands and other areas wild and using buffer strips to increase biodiversity. Fifty-eight per cent maintained a habitat mosaic including planting and maintaining hedgerows, tree planting and wetland restoration. Fifteen per cent planted pollen sources and 48 per cent planted wildflower strips. There was evidence for an increase in the proportion of growers who took part in an agri-environment scheme (seven per cent in 2016 compared to 40 per cent in 2020, p-value = 0.005) with the main scheme reported as the Scottish Government agri-environment climate scheme (AECS). Other actions to support beneficial organism populations also reported in 2020 were use of biologicals only. Other categories in 2016 included maintaining hedging, ponds and wetland areas which have been categorised in 2020 as maintain habitat mosaic and therefore a comparison between these two categories is not suitable. The other technique recorded under other in 2016 was beetle banks.
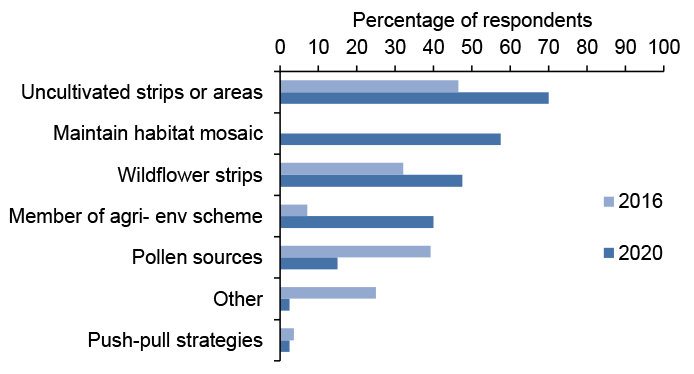
Note: In 2020, ‘other’ activities included use of biologicals only
‘Other’ categories in 2016 included beetle banks and maintaining habitat mosaic which was asked directly in 2020 and therefore a comparison between these two categories is not suitable
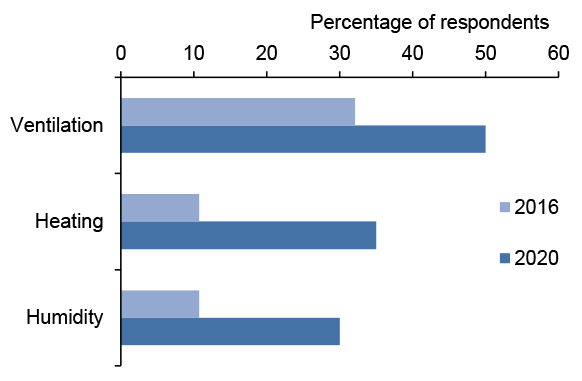
By controlling environmental factors growers can provide optimum growing conditions for plants which can enhance productivity and increase resilience to pests and disease. In 2020, 50 per cent of growers stated that they used manipulation of environmental factors to decrease the risk of pests, an increase from 32 per cent in 2016. This increase is influenced by the fact that the proportion of crops grown under protection was much higher in the 2020 sample compared to the 2016 sample. Half of the growers used ventilation in 2020 an increase from 32 per cent in 2016. Thirty-five per cent manipulated heating in 2020 with 11 per cent in 2016. In 2020, 30 per cent changed humidity compared to 11 per cent in 2016.
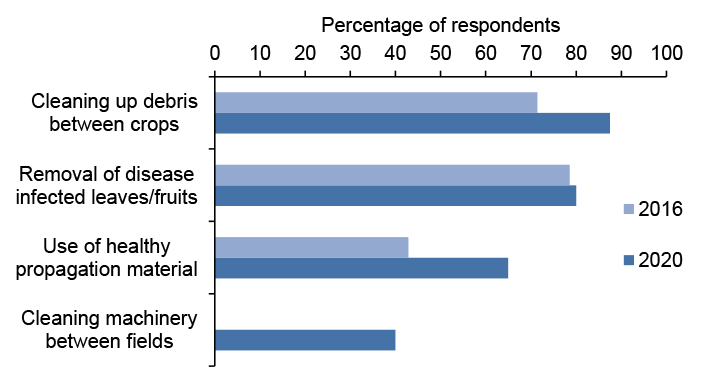
Finally, 90 per cent of the growers sampled reported that they adopted good crop hygiene techniques to reduce risk in 2020, which is similar to 2016 where it was 93 per cent (Figure 39). These included removal of diseased leaves or fruits (80 per cent), removal of debris between crops (87 per cent) and 65 per cent stated that they controlled risk by using healthy propagation material. These are all increases from 2016 where the responses were 78, 71 and 42 per cent respectively. Growers were directly asked in 2020 if they clean machinery between fields where 40 per cent indicated that they did. This was not asked in 2016 and therefore cannot be compared.
Pest monitoring
In IPM, pests are monitored both to determine whether control is economically justified and to effectively target control options. IPM programmes aim to monitor and identify pests, so that appropriate control decisions can be made in conjunction with action thresholds. Table 38 presents an overview of the pest monitoring measures adopted by the growers surveyed in 2016 and 2020. The responses show an increase in most techniques between 2016 and 2020. There were no statistically significant differences in the responses to summary pest monitoring questions between 2016 and 2020. Eighty-five per cent of the growers sampled implemented at least one pest monitoring measure, similar to the 89 per cent in 2016.
| Pest monitoring activity | Percentage positive response | |
|---|---|---|
| 2020 | 2016 | |
| Setting action thresholds for crops | 53 | 32 |
| Monitor and identify pests | 78 | 86 |
| Use of specialist diagnostics | 45 | 39 |
| Regular monitoring of crop growth stage | 80 | 71 |
| Any pest monitoring activity | 85 | 89 |
Seventy-eight per cent of growers surveyed reported that they regularly monitored and identified pests with 80 per cent regularly monitoring crop growth stages in 2020, compared to 86 and 71 per cent in 2016 respectively (Table 38). Over half in 2020 (53 per cent) also used action thresholds when monitoring pest populations compared with 32 per cent in 2016. Under half (45 per cent) reported that they used specialist diagnostics to identify pests in 2020, an increase from 39 per cent in 2016.
Pest monitoring information was primarily gained by self-inspection of crops (58 per cent in 2020 and 86 per cent in 2016) (Figure 40). There was an increase in the proportion of growers seeking advice from BASIS qualified agronomists from 18 per cent in 2016 to 53 per cent in 2020. The 2020 sample contained a higher proportion of larger farms which are more likely to employ a BASIS qualified agronomist. In 2020 there was a slight decrease in the use of risk warnings, from 11 per cent in 2016 to eight per cent in 2020.
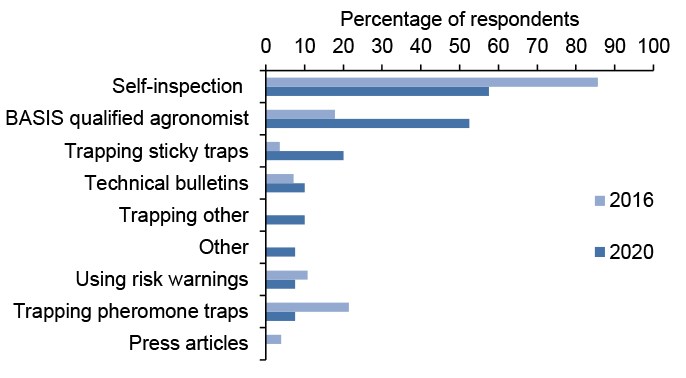
Note: ‘Other’ in 2020 using phone applications, using cameras to monitor pests and monitoring humidity and temperature
Trapping other included vinegar, sugar solution and drop traps
No growers mentioned the use of press articles in 2020 compared with four per cent in 2016. Sticky traps were used by 20 per cent of growers, an increase from four per cent in 2016. There was a decrease in the use of pheromone traps from 2016 to 2020 (21 per cent to eight per cent). Other types of trapping recorded in 2020 includes the use of vinegar traps to monitor spotted wing drosophila and sugar solution traps. Other methods of pest monitoring reported in 2020 included using phone applications, using cameras to monitor pests and monitoring humidity and temperature.
Forty-five per cent of respondents also used specialist diagnostics when dealing with pests that were more problematic to identify or monitor in 2020, an increase from 39 per cent in 2016 (Table 38). Forty-three per cent used tissue testing for nutritional deficiencies. Twenty per cent of growers used field or pest mapping to aid crop monitoring (Figure 41). A quarter of growers used clinic services to identify unknown pests. All of these categories were an increase on the responses in 2016 (36, seven and 14 per cent respectively). Other methods recorded in 2020 included the use of sap analysis.
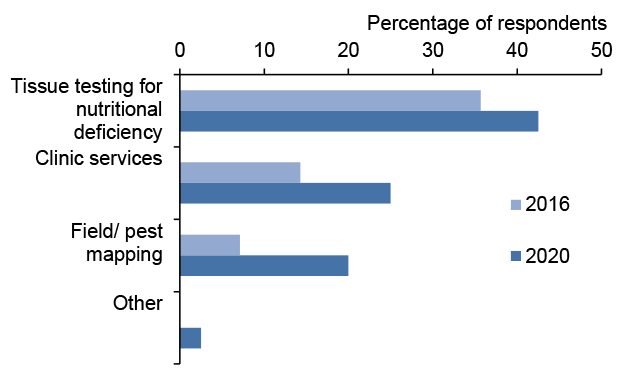
Note: ‘Other’ in 2020 included sap analysis
Pest control
If monitoring, identification, and action thresholds indicate that pest control is required, and preventive methods are no longer effective or available, IPM programs evaluate the best control method in relation to effectiveness and risk. Control programmes incorporate non-chemical methods alongside, or instead of, chemical control. Use of chemical pest control should be as targeted as possible and the risk of resistance development should be minimised. The effectiveness of the control programme should be reviewed regularly to gauge success and improve their regime as necessary. Table 39 presents an overview of the pest control measures adopted by the growers surveyed. In 2020, 43 per cent of respondents (17 of 40 growers representing 50 holdings) had organic holdings.
The overwhelming majority of the growers sampled in 2020 and in 2016 adopted at least one IPM pest control activity (95 per cent in 2020 and 96 per cent in 2016). There is a similar proportion of growers in 2020 and 2016 who adopt the use of non-chemical control (95 per cent in 2020 and 96 per cent in 2016). There is an increase in the use of targeted pesticide application in 2020 with 50 per cent compared to 46 per cent in 2016. Growers following anti-resistance strategies increased from 32 per cent in 2016 to 50 per cent in 2020. In 2020, the response to summary pest control questions was similar to 2016 (Table 39).
| Pest control activity | Percentage positive response | |
|---|---|---|
| 2020 | 2016 | |
| Non-chemical control used in partnership or instead of chemical control | 95 | 96 |
| Targeted pesticide application | 50 | 46 |
| Follow anti-resistance strategies | 50 | 32 |
| Monitor success of crop protection methods | 68 | 71 |
| Any pest monitoring activity | 95 | 96 |
Ninety-five per cent of growers in 2020 reported that they used non-chemical control in partnership or instead of chemical control, similar to the survey in 2016 (Table 39). The most common non-chemical method employed in 2020 was manual or mechanical weeding used by 93 per cent of respondents, an increase from 79 per cent in 2016 (Figure 42). A range of physical control methods which prevent pest access to the crop were also used. Mulches were used by 58 per cent of growers surveyed in 2020, up from 39 per cent in 2016. Netting (eight per cent in 2020 and 29 per cent in 2016) and fleeces (five per cent in 2020 and four per cent in 2016) were also used. Trapping and use of pheromone mating disruption techniques were recorded in 2016 but not in 2020. The use of biocontrol and biopesticides was accounted in 48 per cent of surveyed holdings for 2020, an increase from 29 per cent in 2016. Other non-chemical methods used in 2020 were using soapy water to control pests, using poultry for slug control, growing garlic at the end of rows deter sucking pests and hand trimming crops to increase air flow. Other non-chemical methods used in 2016 included using ash, egg shells or shale to control slugs, using soapy water to control pests, using glue bands on trees, using copper tape around beds, using poultry for slug and aphid control and hand picking slugs and caterpillars.
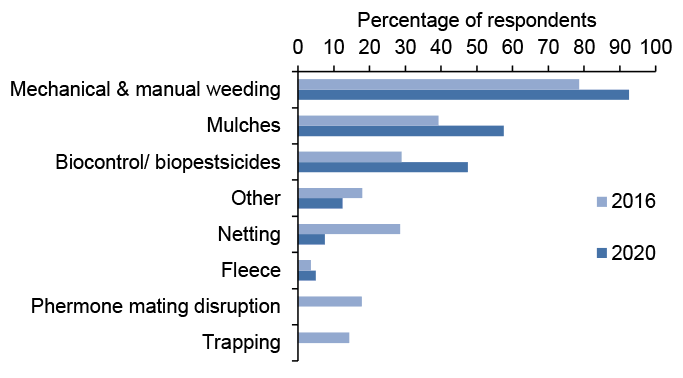
Note: ‘Other’ in 2020 includes using soapy water to control pests, using poultry for slug control, growing garlic at the ends of rows to deter sucking pests and hand trimming crops to increase air flow
‘Other’ in 2016 included using ash, egg shells or shale to control slugs, using soapy water to control pests, using glue bands on trees, using copper tape around beds, using poultry for slug and aphid control and hand picking slugs and caterpillars
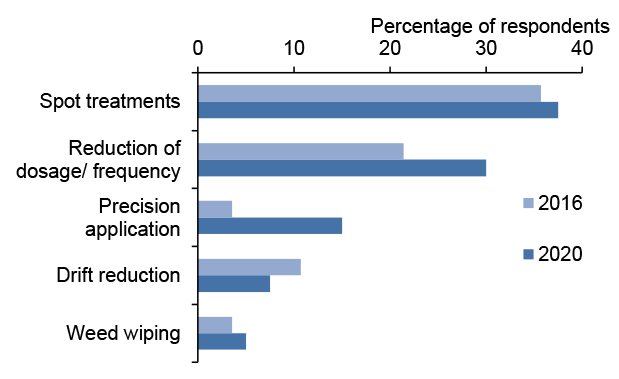
Half of growers in 2020 stated that they targeted their pesticide applications to reduce pesticide use, an increase from 46 per cent in 2016 (Table 39). The most common method used by 38 per cent of growers in 2020, was spot treatments, similar to 2016 (Figure 43). Eight per cent of growers decreased pesticide application by using drift reduction apparatus, a decrease from 11 per cent in 2016. Precision applications such as the use of GPS were used by 15 per cent of growers, an increase from four per cent recorded in 2016. Reducing the dosage or frequency of pesticide were used by 30 per cent of growers in 2020, compared to 21 per cent in 2016. The use of weed wiping (direct herbicide application to weeds), was used by five per cent of growers in 2020, similar to 2016 (four per cent).
In addition, 50 per cent of growers in 2020 stated that they followed anti-resistance strategies, an increase from 32 per cent in 2016 (Table 39). Anti-resistance strategies are used to minimise the risk of development of pest resistance.
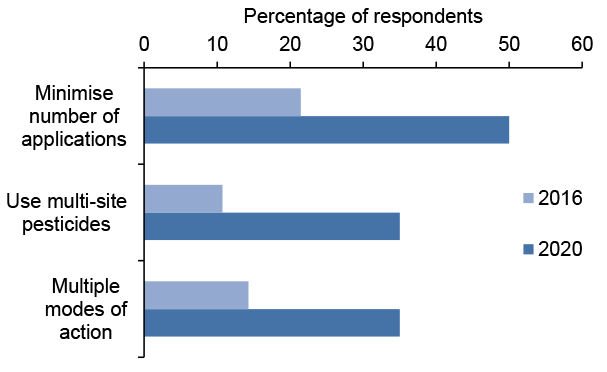
In 2020, 50 per cent of growers minimised the number of pesticide applications used, an increase from 21 per cent in 2016. Thirty-five per cent of growers in 2020, used a range of pesticides with multiple modes of action, an increase from 14 per cent in 2016. Thirty-five per cent of growers used pesticides with multi-site modes of action, compared to only 11 per cent in 2016 (Figure 44). The increase in the use of BASIS qualified agronomists in the 2020 sample may account for the rise in the use of anti-resistance strategies.
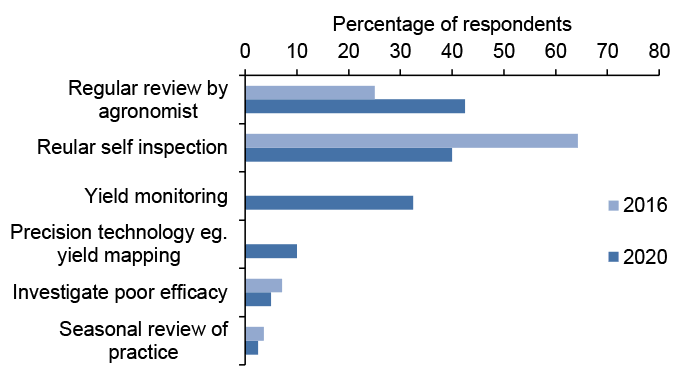
An important aspect of IPM is monitoring the success of risk management and crop protection practices to continually improve regimes. Sixty-eight per cent of growers in 2020 stated that they monitored the success of their crop protection measures, a slight decrease from 71 per cent in 2016 (Table 39). Between 2016 and 2020, there has been a decrease in the proportion of growers using regular self-inspection to monitor their crop protection success and an increase in the proportion having a regular review with their agronomist. In 2020, 43 per cent of growers had a regular review with their agronomist to monitor crop protection success, an increase from 25 per cent in 2016 and 40 per cent of growers conducted regular self-inspections of their crops, a decrease from 64 per cent in 2016. There was a similar decrease in the use of self-inspection to monitor and identify pests from 2016 to 2020 (Figure 45). Seasonal review of practice and investigating causes of poor efficacy were used by a smaller proportion of growers in 2020 compared to 2016 (three and five per cent respectively in 2020 and four and seven per cent in 2016). Precision technologies such as yield mapping was used on 10 per cent of holdings in 2020. The measuring of success by examining the results of harvest and comparing with historic yields (yield monitoring) was directly asked in the 2020 survey where 33 per cent of growers said they used yield monitoring to monitor the success of crop protection methods. This was not surveyed in 2016 and therefore cannot be compared.
Acknowledgements
The authors would like to thank all the farmers, agronomists and contractors who agreed to provide information for this survey. Thanks are also due to Gillian Reay and Jackie Hughes (SASA), Fiona Burnett (SRUC) and Sarah Cook (ADAS) for editorial assistance. In addition, the authors are grateful for support and advice from Lewis Ridley and Dave Garthwaite at Fera Science Ltd, Paul Gavin at the Scottish Government’s Agricultural Census Analysis Team and Adrian Roberts of Biomathematics and Statistics Scotland.
Contact
Email: psu@sasa.gov.scot