Pesticide usage in Scotland: soft fruit 2020
This publication presents information from a survey of pesticide use on soft fruit crops grown in Scotland during 2020.
Part of
General trends
Crop area
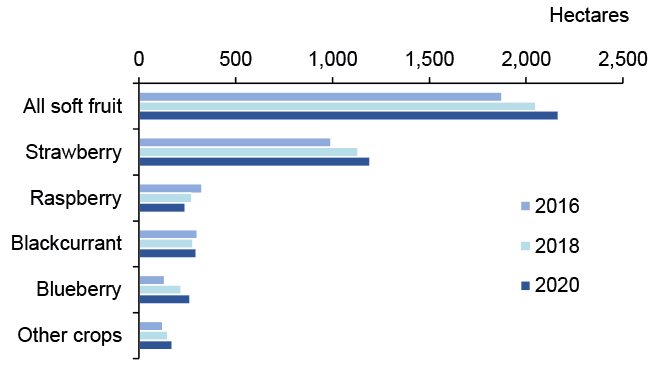
In 2020 the census area of soft fruit crops grown was 2,168 hectares (Table 24). This represents a six per cent increase from 2018(3) and a 16 per cent increase from 2016(4). Since the last survey, the areas of blueberries, mixed/ other soft fruits, blackcurrants and strawberries have increased (21,17, six and five per cent respectively); while the area of raspberries have decreased by 11 per cent (Figure 1).
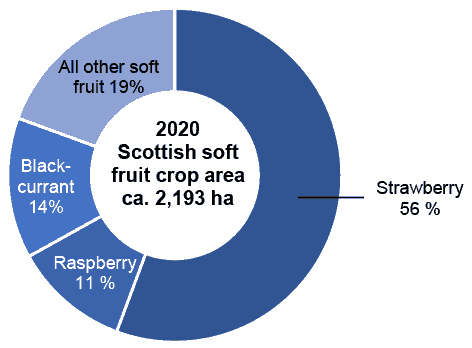
In 2020, strawberries accounted for 56 per cent of the soft fruit area, raspberries 11 per cent, blackcurrants 14 per cent and other soft fruit crops (blueberries, blackberries, gooseberries, redcurrants and other minor crops) 19 per cent (Figure 2).
Note: areas include both non-protected and protected crops. Multi-cropping is not included
Note: areas include multi-cropping
Pesticide usage
This section refers to pesticide usage patterns in overall soft fruit crops. For a description of usage on protected and unprotected crops please see the subsequent 2020 Pesticide Usage section.
The majority of soft fruit crops (90 per cent) received a pesticide treatment in 2020. Strawberries and blackcurrants had the highest overall proportion of crop treated with a pesticide (99 and 96 per cent respectively, Table 1). Other soft fruit crops and raspberries were estimated to have lower proportions of treated crop (73 and 70 per cent respectively). In relation to the average number of pesticide applications, the treated area of soft fruit crops received on average 12.4 sprays, compared with 11.2 sprays in the previous survey. Strawberries received the highest number of applications with an average 14.9 sprays. In contrast blackcurrants received the lowest number of sprays, 7.6 on average (Table 1).
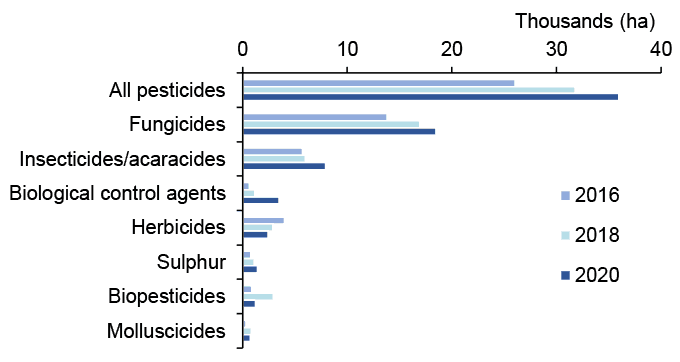
It is estimated that the area of soft fruit crops treated with a pesticide formulation (including biologicals) in 2020 was ca. 36,000 hectares compared with ca. 31,800 hectares in 2018 and ca. 26,000 hectares in 2016 (Table 23, Figure 3). This represents an increase of 38 per cent since 2016 and 13 per cent since 2018.
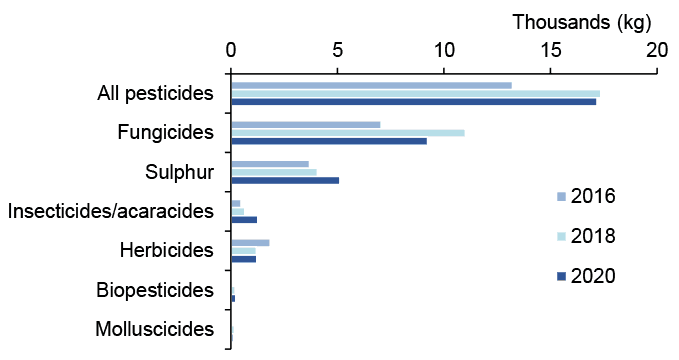
In terms of weight of pesticide applied, ca. 17.2 tonnes were applied in 2020, compared with ca. 17.4 tonnes in 2018 and ca. 13.2 tonnes in 2016 (Figure 4). This represents an increase of 30 per cent from 2016 and a decrease of one per cent from 2018.
Note: invertebrate biological control agents are applied by number of organisms rather than weight therefore data are not presented.
In order to make accurate comparisons between the 2020 data and that reported in previous surveys, it is important to take into account differences in crop areas between years. Therefore, the number of treated hectares per hectare of crop grown and the total weight of pesticide used per hectare of crop grown were calculated. In 2020, for each hectare of crop grown, around 16 treated hectares were recorded (Figure 5). This represents an increase of eight per cent from 2018 and 18 per cent from 2016.
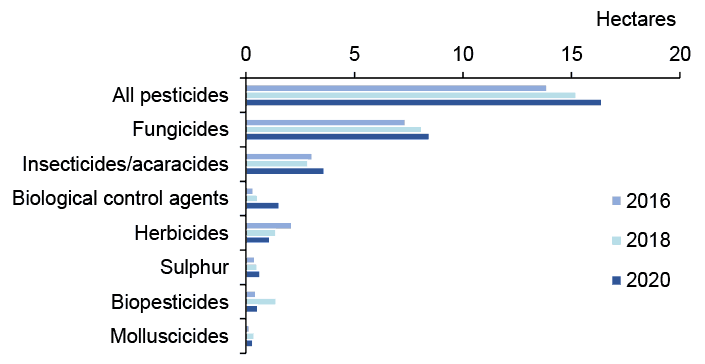
Note: Physical control has been excluded as its use represents < 0.2 treated hectares per hectare of crop grown
The estimated weight of pesticide applied per hectare of crop grown was almost eight kilograms (Figure 6). This represents a decrease of six per cent from 2018 and an increase of 11 per cent from 2016. The increase in treated area but decrease in weight applied compared with 2018 may have been influenced by large increases in the use of biological control agents which play an important part in growers Integrated Pest Management (IPM) programmes. Invertebrate biological control agents are applied by number of organisms rather than weight therefore weight data is not recorded. It was noted in previous reports that the lower pesticide use reported in 2016, influenced by cool climatic conditions, lower pest pressure and a low survey response rate, was atypical in this data series(4).
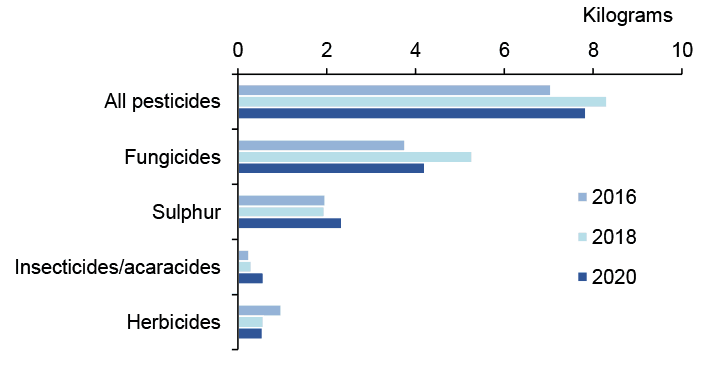
Note: molluscicides, biopesticides and physical control have been excluded as their use represents 0.1 kg or less per hectare of crop grown
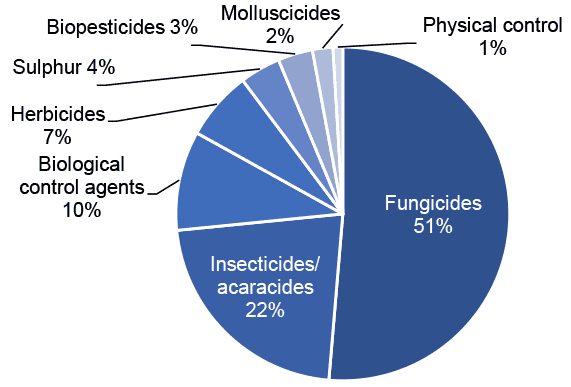
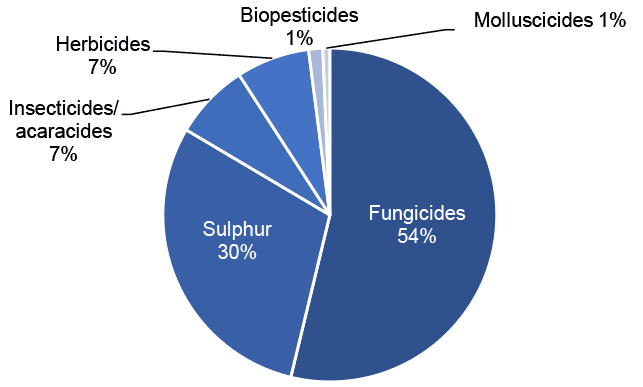
In 2020, fungicides were the most frequently used pesticides by area treated on soft fruit crops, followed by insecticides/acaricides, biological control agents and herbicides (Figure 7). Fungicides accounted for 51 per cent of the total pesticide treated area and 54 per cent of the total weight of pesticides applied (Figures 7 and 8). When changes in crop area are taken into account, the area treated with fungicide formulations increased by four per cent from 2018 to 2020 and by 15 per cent from 2016 to 2020 (Figure 5). From 2018 to 2020, there was a decrease of 20 per cent in the weight of fungicides used per hectare of crop grown and an increase of 12 per cent from 2016 to 2020 (Figure 6).
Sulphur can be applied as a fungicide but is also used as an insecticide on blackcurrants to control big bud mite. Sulphur accounted for four per cent of the total treated area and 30 per cent of the total weight of pesticides applied (Figures 7 and 8). When changes in area grown are taken into account, there was a 24 per cent increase in the use of sulphur between 2018 and 2020 and a 55 per cent increase from 2016 to 2020 (Figure 5). The weight of sulphur applied per hectare of crop grown increased by 20 per cent from 2018 to 2020 and by 19 per cent from 2016 to 2020 (Figure 6). When crop area is taken into account, the mean applications of sulphur were 2.3 kg/ha in 2020, 1.9 kg/ha in 2018 and 2.0 kg/ha in 2016. This increased use of sulphur in 2020 was primarily due to an increase in use of sulphur on blackcurrants for the control of big bud mite.
Note: invertebrate biological control agents are applied by number of organisms rather than weight therefore data are not presented.
In 2020, insecticides and acaricides accounted for 22 per cent of the total pesticide treated area and seven per cent of the total weight of pesticides applied (Figures 7 and 8). When changes in crop area are taken into account, there is a 27 per cent increase from 2018 to 2020 and an 18 per cent increase from 2016 to 2020 in the area treated with insecticide/acaricide formulations (Figure 5). In terms of weight of insecticide applied, when area of crop grown is taken into account, there is an 86 per cent increase from 2018 to 2020 and a 134 per cent increase from 2016 to 2020 (Figure 6). This increase in weight of insecticides applied is being driven by an increase in the use of fatty acids C7-C20 mainly on protected strawberries. Fatty acids C7-C20 are applied at high rates and accounted for 54 per cent of the total weight of insecticides applied in 2020 and 36 per cent in 2018. No fatty acid use was recorded in 2016. There has also been an increase in the use of spirotetramat mainly for the control of sucking pests such as aphids on protected strawberries. The use of spirotetramat in terms of weight applied has increased by 674 per cent since 2018 (Table 22). Unlike pyrethroids, which can have adverse effects on non-target insects, the use of fatty acids and spirotetramat are generally more compatible with IPM programmes. Spirotetramat is harmless or only slightly harmful to the main biological control agents and although the impact of fatty acid on IPM programmes has not been established, it has no residual activity so beneficials can be safely reintroduced after application(5).
Herbicides and desiccants accounted for seven per cent of both the total pesticide treated area and the total weight of pesticides applied (Figures 7 and 8). When changes in crop area are taken into account, there is a decrease in area treated with herbicide and desiccant formulations of 21 per cent from 2018 and a decrease of 48 per cent from 2016 (Figure 5). In terms of weight of pesticide applied, when area of crop is taken into account, there is a decrease of three per cent from 2018 to 2020 and a decrease of 43 per cent from 2016 to 2020 (Figure 6). Decreases were recorded in a number of key active substances. The principal herbicide active substances in 2018 in terms of weight applied were napropamide, propyzamide and diquat, these all decreased in 2020 (59, 40 and 94 per cent respectively). The authorisation for diquat has been withdrawn, with the final use for the product in February 2020, hence the large decrease reported in 2020
In 2020, biopesticides accounted for three per cent of the total pesticide treated area and one per cent of the total weight of pesticides applied (Figures 7 and 8). When changes in crop area are taken into account, there is a decrease of 61 per cent from 2018 to 2020 and an increase of 22 per cent from 2016 to 2020 in the area treated with biopesticide formulations (Figure 5). In terms of weight of pesticide applied, there is an increase of 13 per cent from 2018 to 2020 and an increase of 186 per cent from 2016 to 2020. Biopesticides were recorded on strawberry, raspberry and on other soft fruit crops. The majority of biopesticides were applied to strawberry crops for the control of botrytis and powdery mildew.
Biological control agents accounted for 10 per cent of the total pesticide treated area. As biological control agents are applied by the number of organisms rather than the weight, no weight data are presented. When changes in crop area are taken into account, there is an increase of 192 per cent from 2018 to 2020 and an increase of 377 per cent from 2016 to 2020 in area treated. Biological control agents were used on strawberry, raspberry and other soft fruit crops such as blueberry and blackberry. As in 2018, the largest proportion of biological control agent use was recorded on strawberry crops, targeting two-spotted spider mite. This represents a trend towards a significant increase in the use of biological control agents for managing insect pests and disease in soft fruit crops as part of an integrated pest management system.
In 2020, molluscicides accounted for two per cent of the total pesticide treated area and one per cent of the total weight of pesticides applied (Figures 7 and 8). When changes in crop areas between years are taken into account, there is a decrease in molluscicide applications per unit area of 18 per cent between 2018 and 2020 and an increase of 108 per cent between 2016 and 2020 (Figure 5). The weight of molluscicides applied per hectare of crop grown decreased by 27 per cent from 2018 to 2020 but increased by 46 per cent from 2016 to 2020 (Figure 6). Molluscicide use varies significantly from year to year as slug populations are closely linked to climatic conditions. In terms of area treated, ferric phosphate is now the principal molluscicide active substance (applied to 394 ha). The use of metaldehyde has declined as growers prepare for the withdrawal of metaldehyde, which has a final use date of March 2022, from the market.
Pesticides classified as physical control agents accounted for one per cent of the total pesticide treated area (Figures 7). When changes in crop areas between years are taken into account, there was an increase in physical control agent applications per unit area of 544 per cent between 2018 and 2020 and 4,551 per cent between 2016 and 2020. Physical control agents are substances that have a physical action against insect pests, for example by blocking insect spiracles and causing death by suffocation. Physical control was recorded on predominately protected crops for the control of two-spotted spider mite and aphids.
As well as changes in overall trends in application of pesticide groups since the previous survey, there has been variation in the use of individual active substances. The use of the fungicide myclobutanil has increased by 1,820 per cent in terms of area treated since 2018 (Table 21). However, usage was atypically low in 2018 and the use of myclobutanil has decreased by 22 per cent since 2016. The use of the biological control agent Heterorhabditis bacteriophora has increased by 7,737 per cent in terms of area treated and is appearing in the top twenty actives by area for the first time. The use of the herbicide glyphosate has increased by 137 per cent in terms of area treated since 2018 and by 21 per cent since 2016. This increase may be the result of growers using glyphosate as a replacement for diquat which has been withdrawn. The insecticide cyflumetofen, which was first authorised in February 2020 and the residual-acting herbicides dimethenamid-p and flazasulfuron were all recorded for the first time on soft fruit crops in 2020 (Table 17).
The biopesticide Aureobasidium pullulans was seen for the first time in this survey as well as biological control agents Bacillus pumilus strain QST 2808, Bacillus amyloliquefaciens strain MBI600, Amblyseius andersoni, Stratiolaelaps scimitus and Transeius montdorensis.
Integrated Pest Management
Information about the uptake of IPM measures by Scottish growers was collected alongside the 2020 soft fruit pesticide usage survey. This 2020 IPM survey represents the second in the series of surveys of IPM measures on soft fruit, allowing the adoption of IPM techniques to be monitored.
This is a summary of the data; please refer to Appendix 6 for the full dataset. Growers were asked a series of questions about the IPM activities that they implemented for soft fruit production. Unlike the other statistics in this report, the figures relating to IPM are not raised to produce national estimates but represent only the responses of those surveyed.
In total, IPM data was collected from 40 growers, collectively representing 50 holdings and 32 per cent of Scotland’s 2020 soft fruit area. Of these growers, 48 per cent had an IPM plan (30 per cent completed their own IPM plan and 18 per cent had a plan completed by their agronomist) (Figure 30). This provides some evidence that the proportion of growers completing an IPM plan has increased from the 2016 survey where 18 per cent of growers had an IPM plan (p-value = 0.12). Since 2016, there has been a focus on the promotion of IPM and the introduction of mandatory completion of IPM plans within some key farm assurance schemes to help growers make the best possible and most sustainable use of all available methods of pest control. Growers were asked about their IPM activities in relation to three categories; risk management, pest monitoring and pest control.
In both 2020 and 2016, all growers sampled reported that they implemented at least one measure associated with an IPM risk management approach (Table 37). There were no statistically significant differences in the responses to summary risk management questions between 2016 and 2020. Although not statistically significant, there were increases in uptake in other risk management activities from 2016 including soil testing (54 per cent in 2016 to 63 per cent in 2020), cultivation at sowing (39 per cent in 2016 to 50 per cent in 2020), adoption of techniques to protect or enhance populations of beneficial organisms (82 per cent in 2016 to 93 per cent in 2020) and manipulation of environmental factors to reduce pest risk (32 per cent to 50 per cent in 2020).
In terms of the uptake of pest monitoring activities, there was very little change between 2016 and 2020. In both years, the majority of growers sampled reported they implemented at least one pest monitoring measure (89 per cent in 2016 and 85 per cent in 2020) (Table 38). There were some changes, however, in setting action thresholds for crops with an increase from 2016 (32 per cent to 53 per cent in 2020), use of specialist diagnostics (39 per cent in 2016 to 45 per cent in 2020) and regular monitoring of crop growth stage (71 per cent in 2016 to 80 per cent in 2020). There was a decrease in monitoring and identifying pests going from 86 per cent in 2016 to 78 per cent in 2020.
The overwhelming majority of the growers sampled in 2016 and 2020 adopted at least one IPM pest control activity (96 per cent and 95 per cent respectively). There was an increase in the use of targeted pesticide application (from 46 per cent of respondents in 2016 to 50 per cent in 2020), anti-resistance strategies (32 per cent in 2016 to 50 per cent in 2020). Finally, there was a small decrease in the proportion of respondents who stated that they regularly monitored the success of their crop protection measures (71 per cent in 2016 to 68 per cent in 2020) and use of non-chemical controls (96 per cent in 2016 to 95 per cent in 2020).
Contact
Email: psu@sasa.gov.scot