Pesticide usage in Scotland: Grassland and Fodder Crops 2021
This publication presents information from a survey of pesticide use on grassland and fodder crops in Scotland during 2021.
Part of
2021 Pesticide usage
Direct sown grass
- An estimated 24,388 hectares of direct sown grass was grown in Scotland in 2021, an increase of 25 per cent since 2017
- 23 per cent of the crop was treated with a pesticide
- Pesticides were applied to 7,383 treated hectares and 7,103 kilograms of pesticide were applied in total
- 100 per cent of pesticides applied, by area, were herbicides
- Direct sown grass received on average one herbicide application (applied to 23 per cent of the crop area) (Table 1)
- Glyphosate (2,253 hectares) and florasulam/fluroxypyr (1,195 hectares) were the most used herbicide formulations
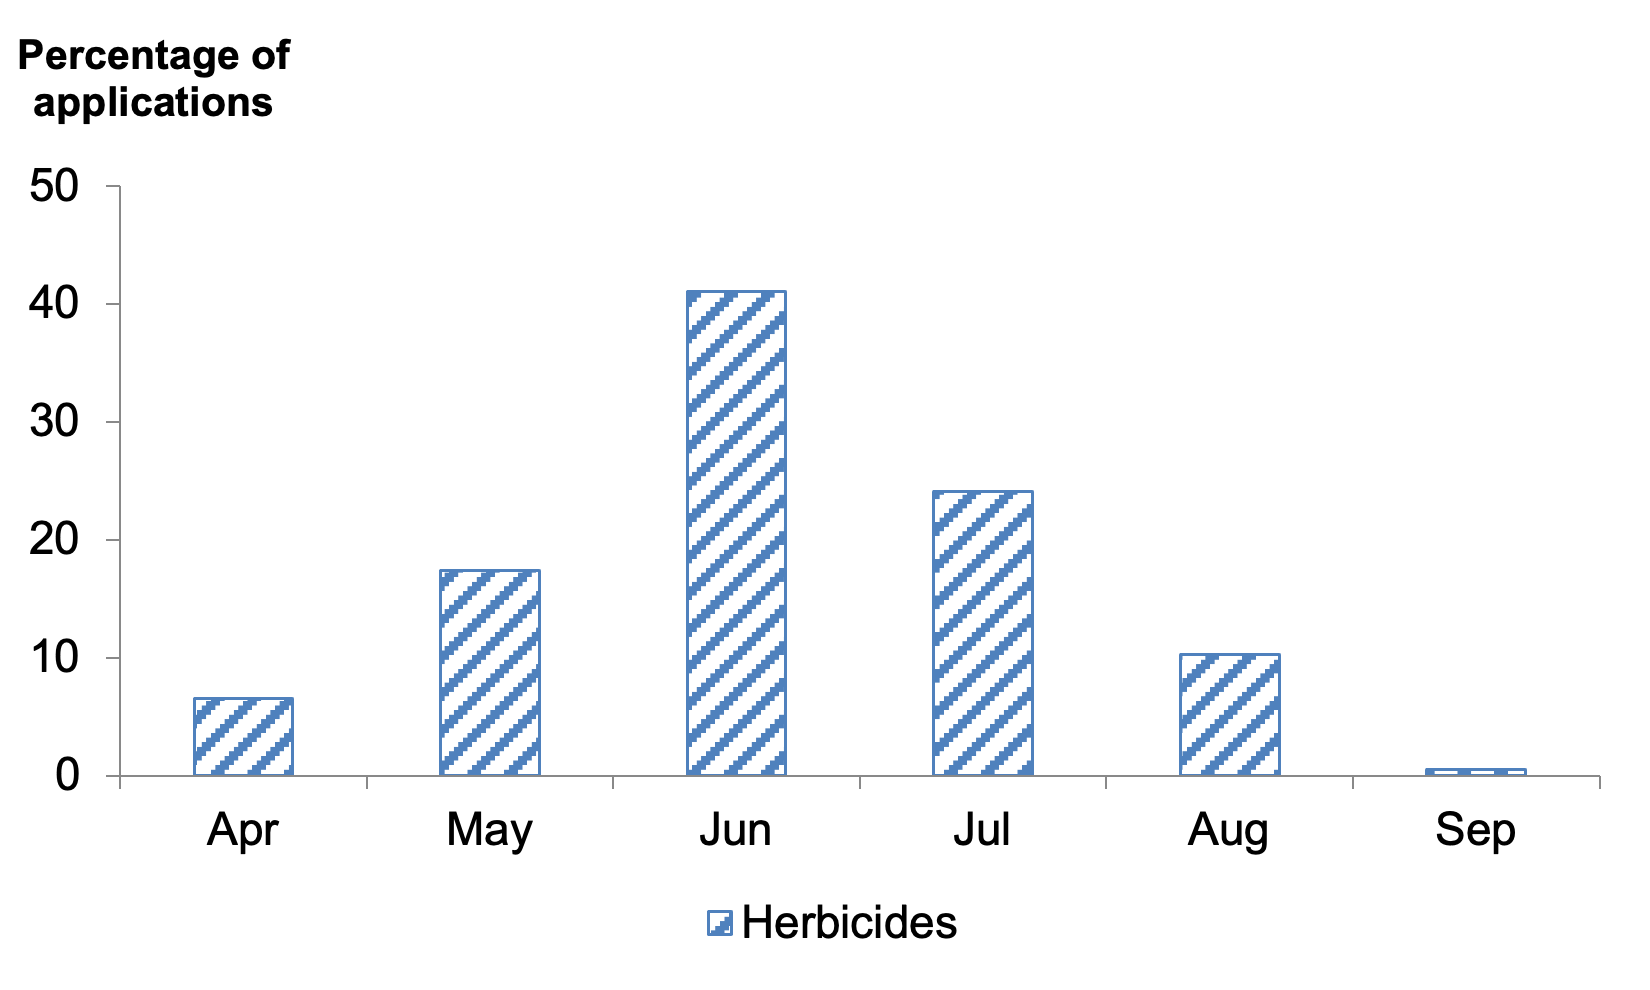
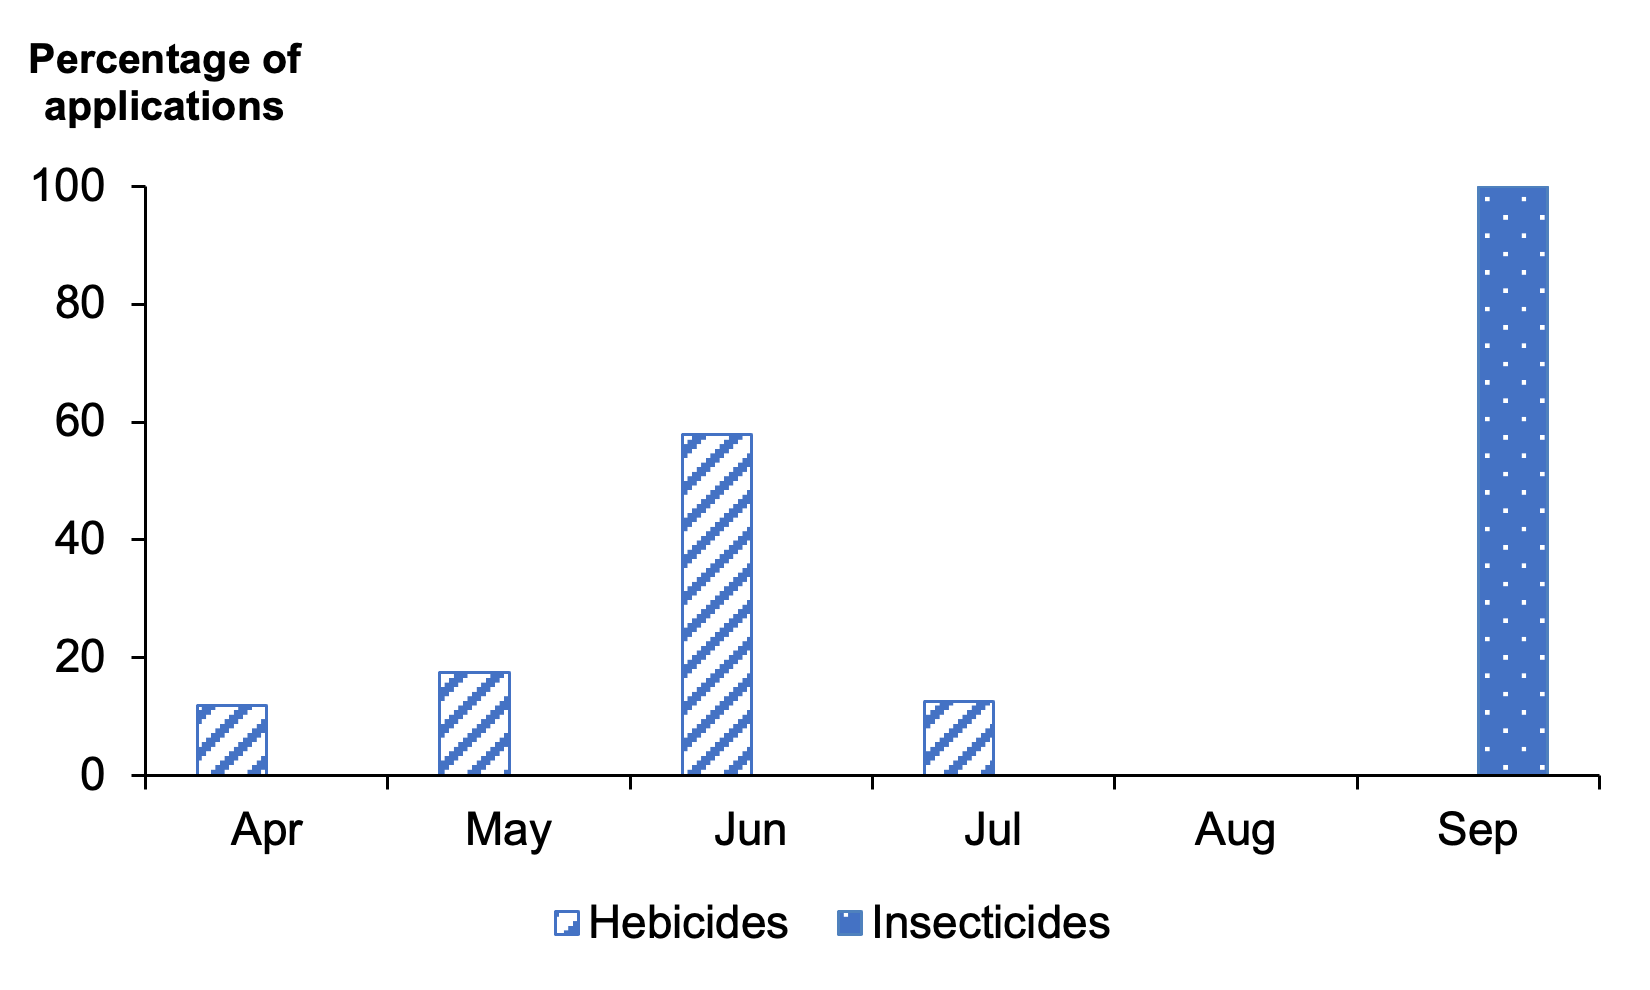
- Timing of herbicide applications are shown in Figure 19
- Reasons were given for 99 per cent of herbicide use: 27 per cent for grass weed control, 19 per cent for crop destruction/pasture kill, 16 per cent for docks, 12 per cent for thistles, 10 per cent for chickweed, three per cent for annual grass weeds and two percent for nettles. The remaining ten per cent was for control of other weeds including fat hen, rushes, buttercup, cow parsley, ragwort and to produce a stale seed bed
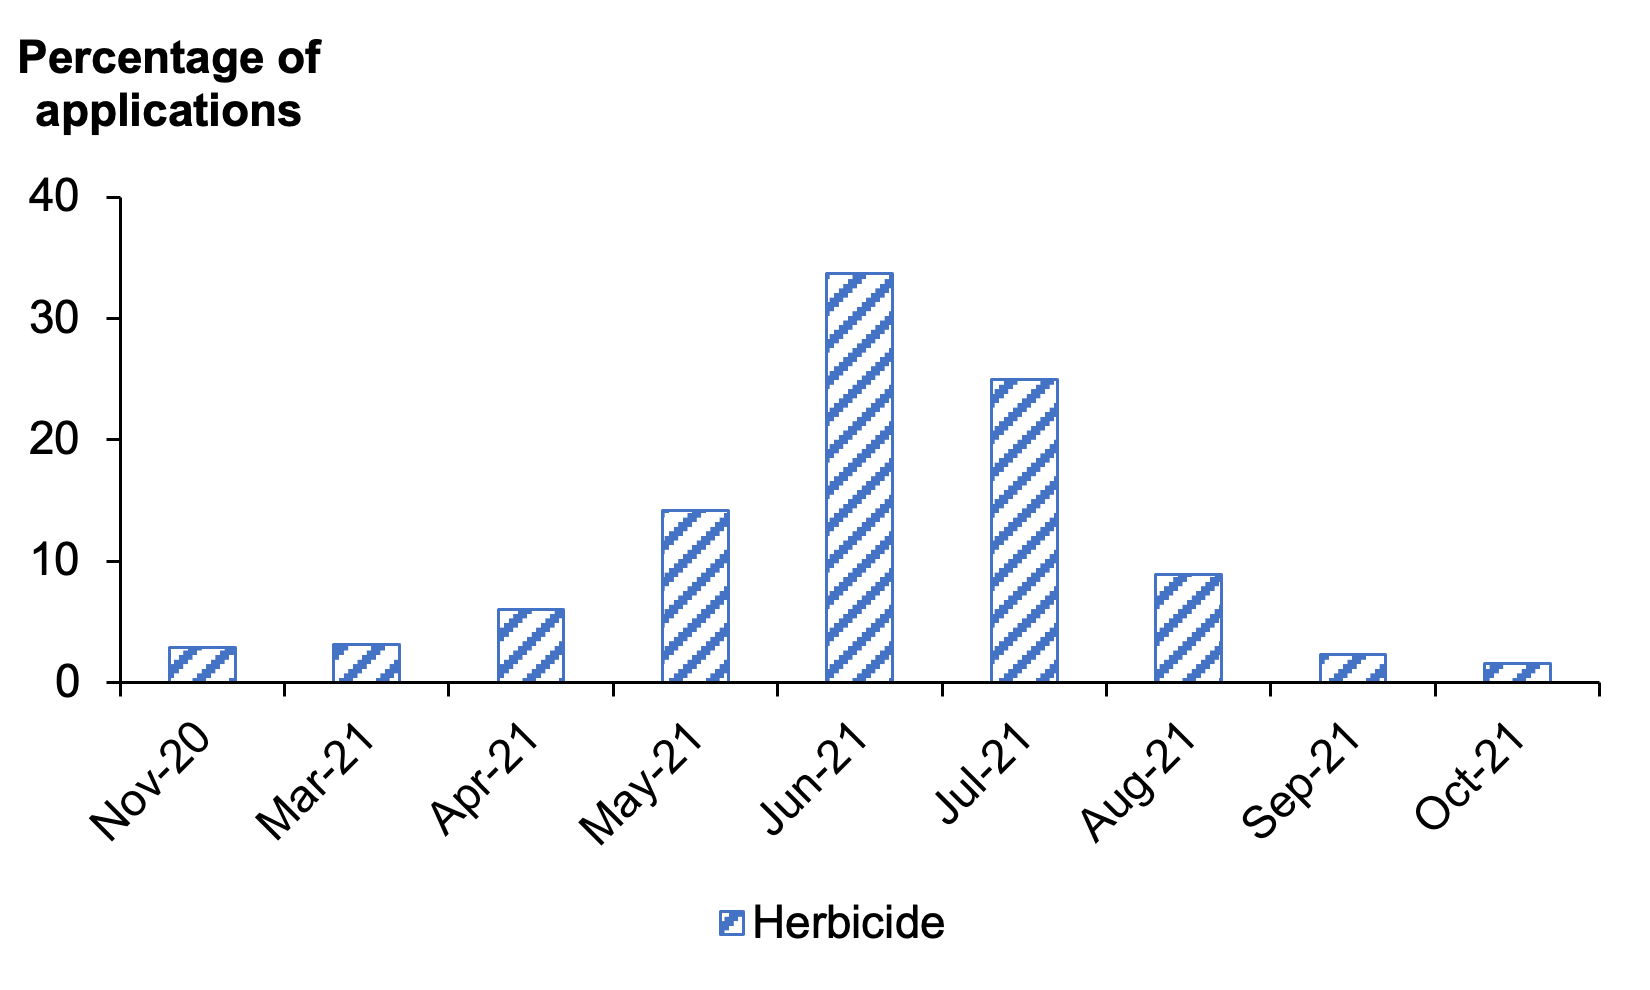
Note: there were small amounts (one per cent) of herbicides applied in in September 2020 and November 2021 which are not shown in this figure.
Undersown grass
- An estimated 9,193 hectares of undersown grass was grown in Scotland in 2021, an increase of 22 per cent from 2017
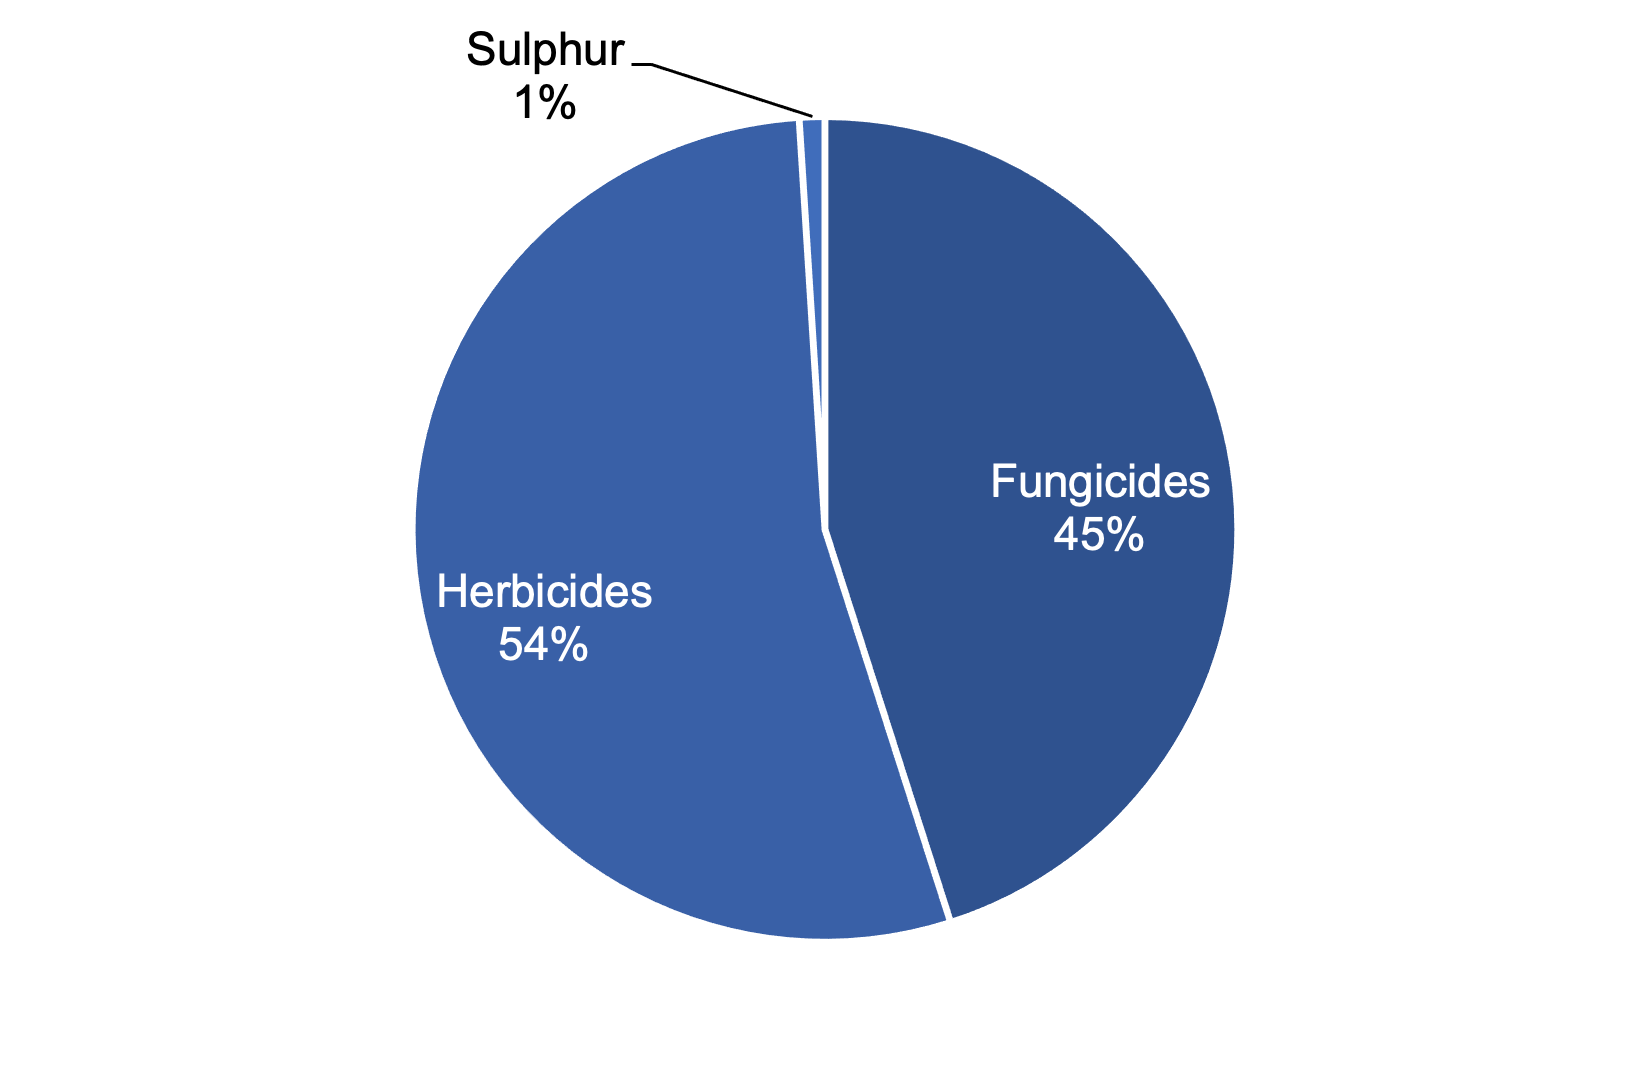
- 40 per cent received a pesticide (see Figure 20 for types of pesticides used)
- 8,406 hectares of pesticide formulations were applied and 3,160 kilograms of pesticide were used in total on the crop (see summary table below)
- All fungicide use on undersown grass was for controlling disease in the nurse crop
- Undersown grass received on average 1.1 pesticide applications (applied to 40 per cent of the crop area) (Table 1). These applications included 1.2 fungicides (applied to 30 per cent of the crop area), one herbicide (applied to 34 per cent of the crop area) and one of sulphur (applied to one per cent of the crop area)
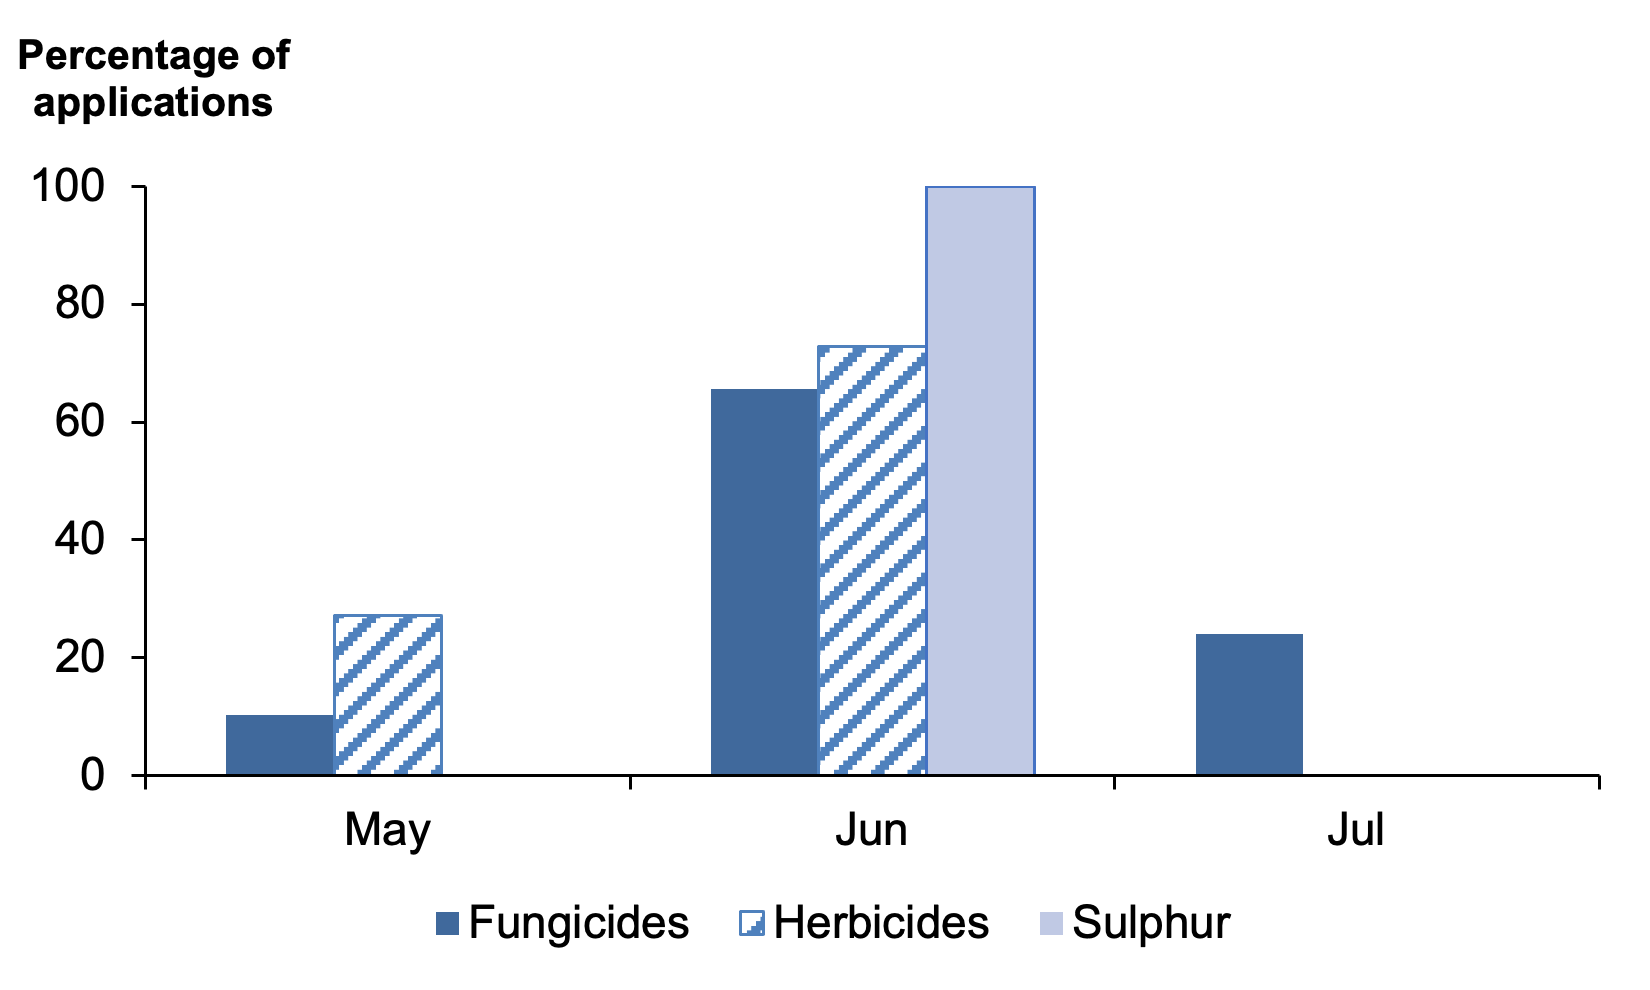
- Timing of pesticide applications are shown in Figure 21
- Reasons for fungicide applications were supplied for 50 per cent of total use; 49 per cent was for general disease control, one per cent for mildew
- Reasons for herbicide applications were supplied for 91 per cent of all use; 37 per cent for general weed control, 26 per cent for annual broad-leaved weeds, 12 per cent for day-nettle, nine per cent for chickweed, three per cent for buttercup and two per cent each for annual grass weeds and docks
Summary of pesticide use on undersown grass
| Pesticide group | Formulation area treated | Weight of pesticides applied | Percentage of crop treated | Most used formulations |
|---|---|---|---|---|
| ha | kg | % | ha | |
| Fungicides | 3,789 | 619 | 30 | Prothioconazole/tebuconazole (971), Cyprodinil (895) |
| Herbicides | 4,533 | 2,402 | 34 | MCPA (1,624), Amidosulfuron (896) |
| Sulphur | 84 | 139 | 1 | [z] |
| All pesticides | 8,406 | 3,160 | 40 |
Note: some shorthand is used in this table: [z] = not applicable.
Grass one to four years old
- An estimated 142,453 hectares of grass between one and four years old was grown in Scotland in 2021. This represents a decrease of 24 per cent from 2017
- Only herbicides were applied to grass between one and four years old
- Five per cent of the crop was treated with a herbicide (Table 1)
- 9,614 hectares of herbicide formulations were applied and 6,555 kilograms of herbicide were used in total
- Fluroxypyr (1,938 hectares) and fluroxypyr/triclopyr (1,613 hectares) were the most used herbicide formulations
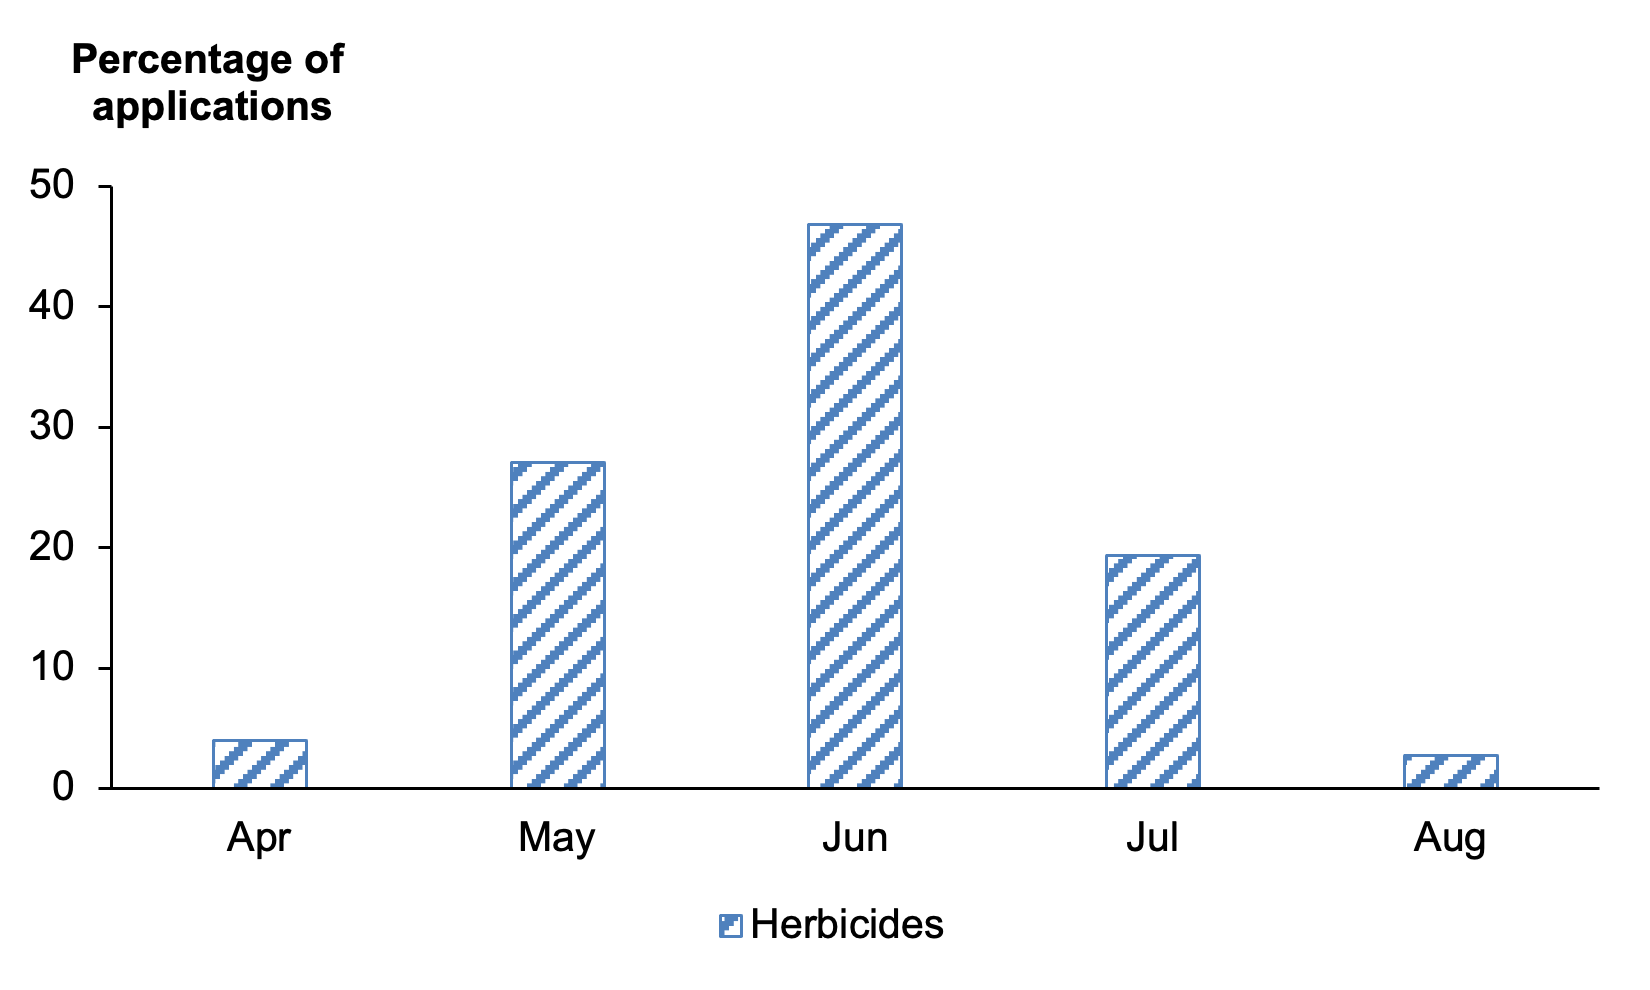
- Timing of herbicide applications are shown in Figure 22
- Reasons were given for 98 per cent of total herbicide use; 42 per cent for control of docks, 26 per cent for thistles, 19 per cent for general weed control, three per cent for annual broad-leaved weeds, two per cent each for rushes, buttercup and nettles and less than one per cent each for ragwort, dandelion and grass kill
Grass over five years old
- 1,130,056 hectares of grass over five years old was grown in Scotland in 2021. This was a two per cent increase from 2017
- Only herbicides were applied to grass over five years old
- Three per cent of the crop was treated with a herbicide (Table 1)
- Herbicides were applied to 50,109 hectares and 42,814 kilograms of herbicides in total were applied to the crop
- The most used herbicide formulations were fluroxypyr applied to 10,523 hectares and clorpyralid/triclopyr applied to 10,523 hectares
- Timing of herbicide applications are shown in Figure 23
- Reasons were given for 99 per cent of herbicide use; docks accounted for 30 per cent of herbicide applications, thistles 17 per cent, rushes 16 per cent, general weed control 14 per cent, nettles eight per cent, ragwort, annual broad-leaved weeds and chickweed four per cent each, buttercup two per cent, one per cent grass/crop destruction and less than one per cent for the control of broom and gorse
Rough grazing
- 3,072,535 hectares of rough grazing was grown in Scotland in 2021, a two per cent decrease from the 2017 survey
- Only herbicides were applied to rough grazing
- Less than 0.5 per cent of rough grazing was treated with a herbicide, with an average of one application (Table 1)
- An area of 5,426 hectares were treated with herbicide formulations and 7,121 kilograms were applied in total
- The most commonly encountered herbicide formulation was 2,4-D/ MCPA (2,635 hectares)
- Timing of the herbicide applications are shown in Figure 24
- Reasons were supplied for almost all herbicide use on rough grazing; 36 per cent of applications were for thistles, 26 per cent for docks, 19 per cent for nettles, eight per cent gorse, five per cent each for rushes and bracken and less than one percent for hemlock
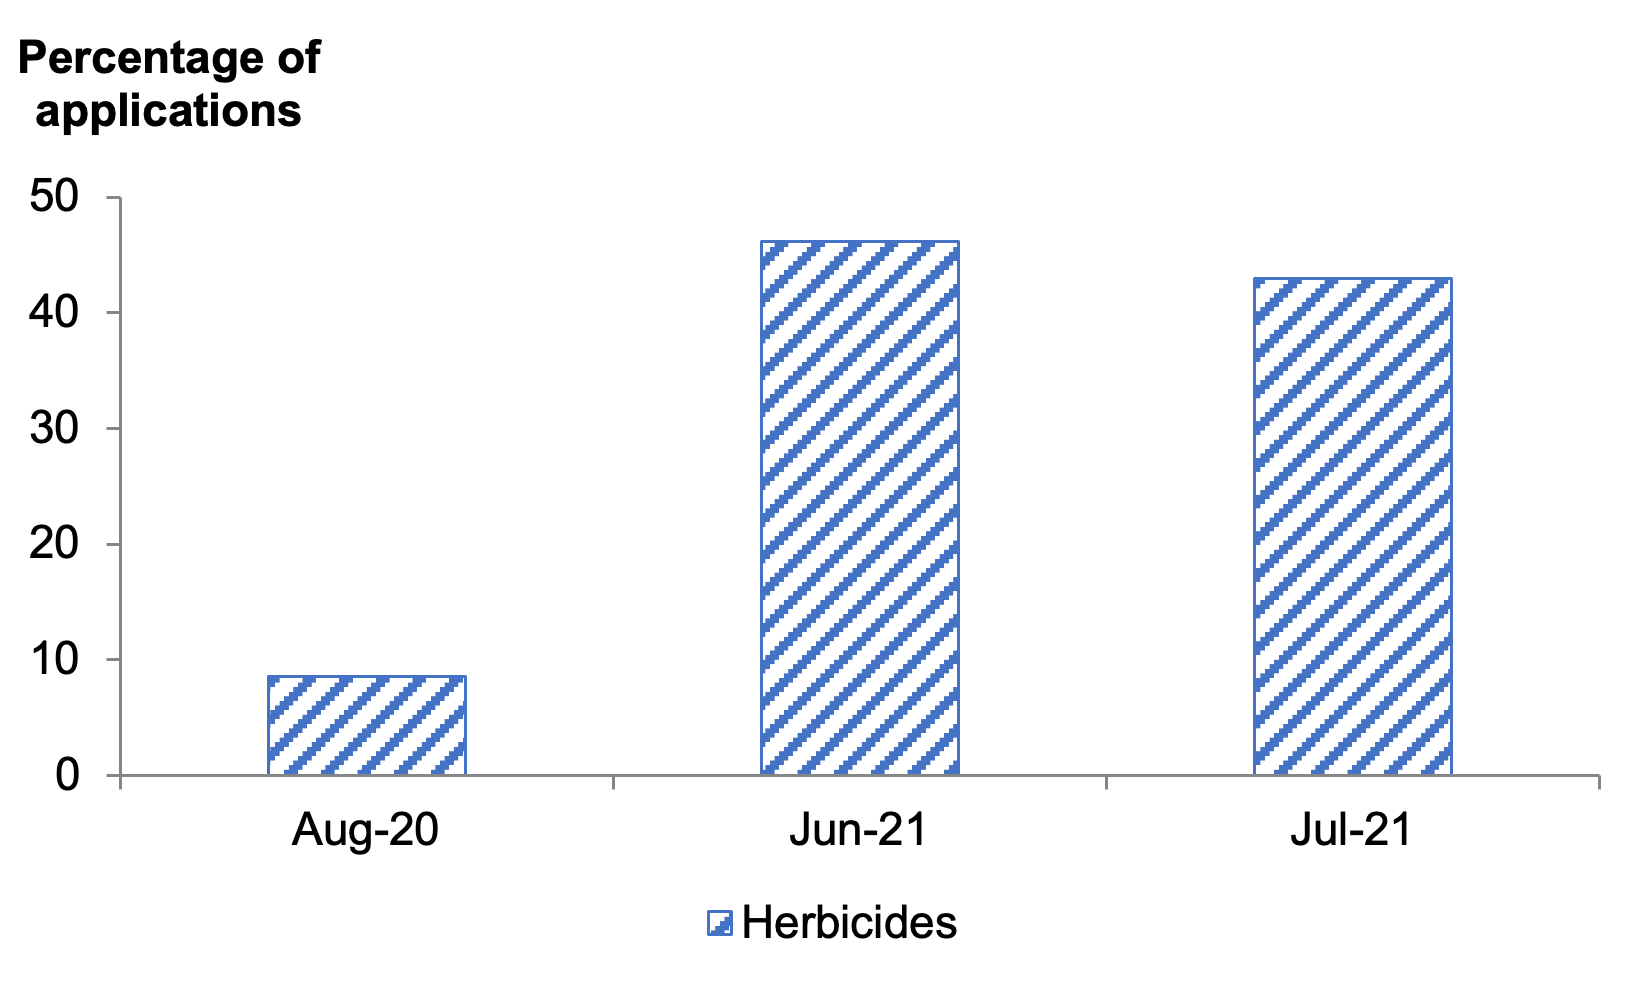
Note: there were small amounts of herbicide (two per cent) applied in August 2021 which are not shown in this figure.
Arable silage
- An estimated 5,453 hectares of arable silage was grown in Scotland in 2021, a decrease of six per cent from 2017
- Arable silage is recorded in the 'other crops for stock-feeding' category of the Agricultural Census
- Crops grown for arable silage included barley, oats, wheat, peas, lupin, lucerne, sunflower, triticale, clover and vetches, some of which were undersown
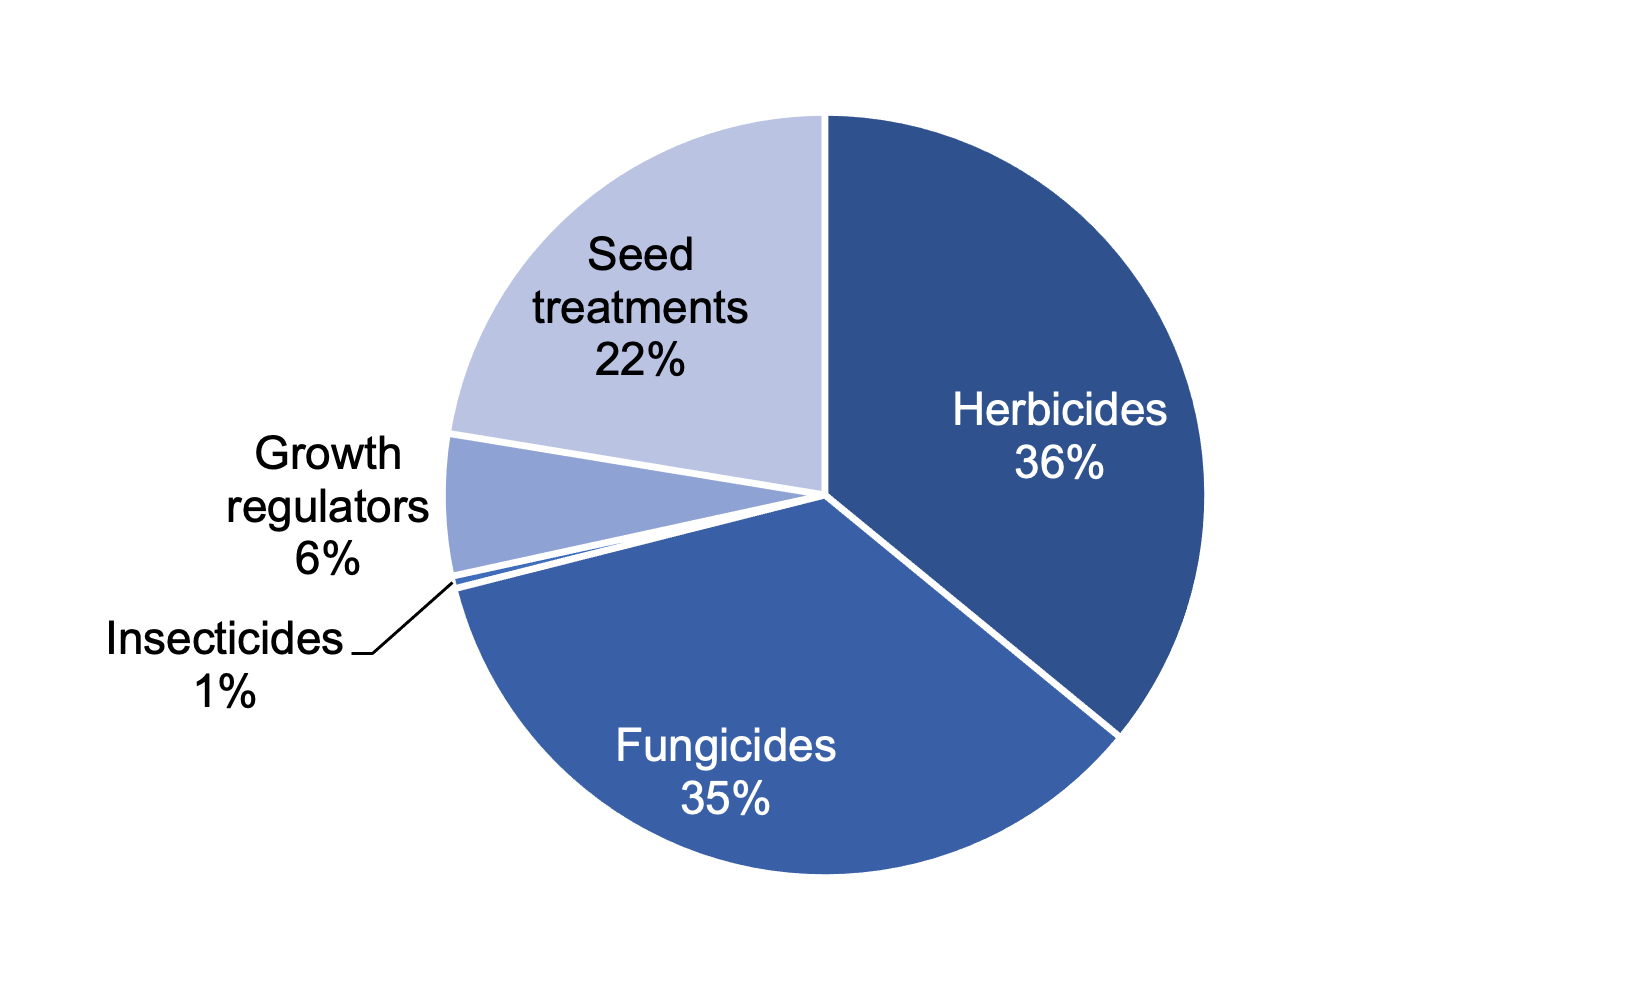
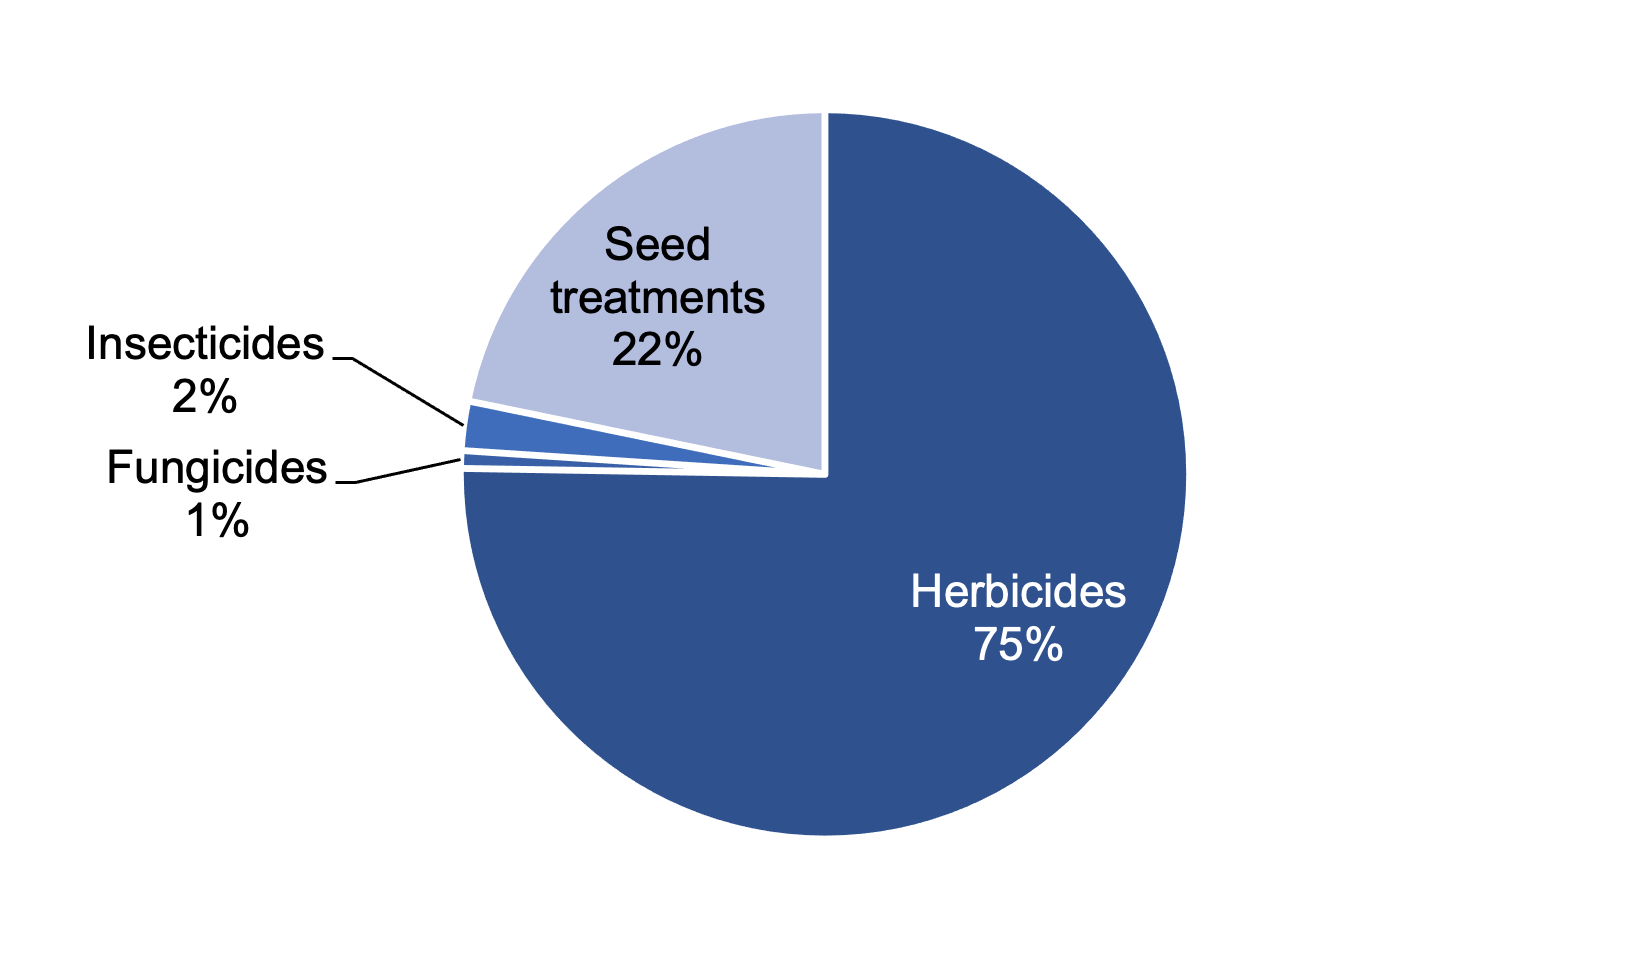
- 26 per cent of the crop was treated with a pesticide (see Figure 25 for types of pesticides used)
- An area of 5,749 hectares of pesticide formulations and 1,014 kilograms were applied in total (see summary table below)
- The arable silage crop received on average 1.9 pesticide applications (Table 1). These applications included 1.7 fungicides and one herbicide (applied to 15 and 19 per cent of the crop area respectively
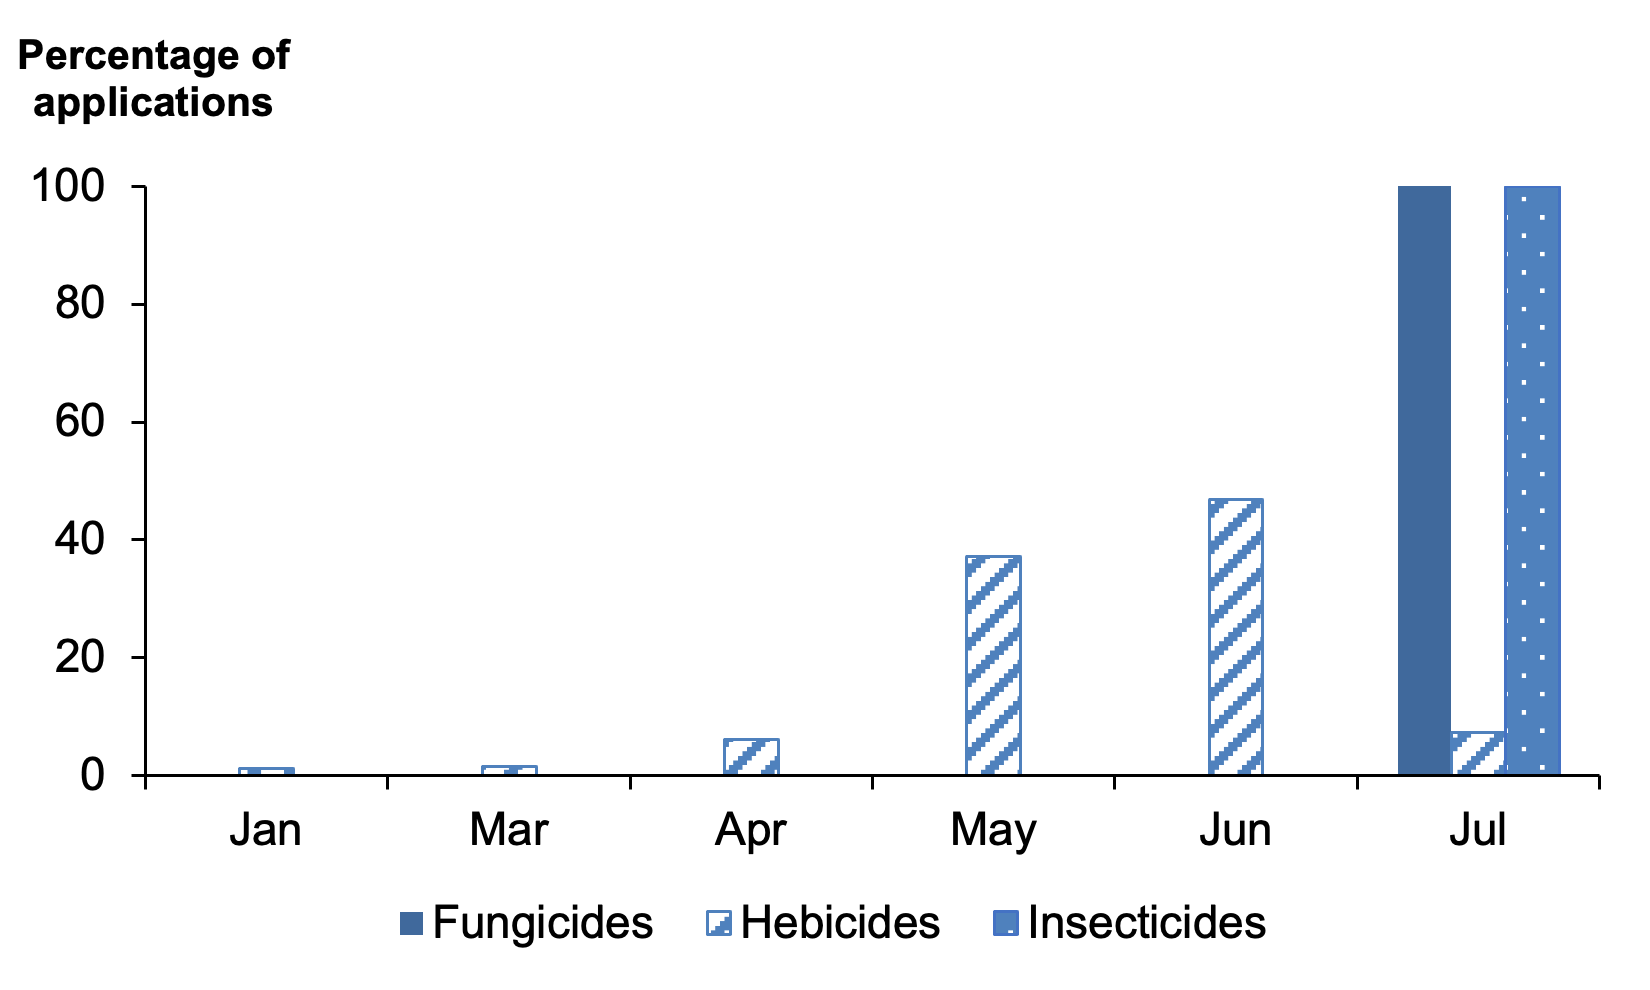
- Timing of the pesticide applications are shown in Figure 26
- Reasons were supplied for 92 per cent of applications of fungicides; 31 per cent was for mildew, 26 per cent for Septoria, 25 per cent for rust, and five per cent each for fusarium and general disease control
- Reasons were supplied for 82 per cent of herbicide applications; 46 per cent was for general weed control, 17 per cent for annual broad-leaved weeds, 11 per cent for docks, seven per cent for annual meadow grass and one per cent for grass kill
- No reasons were supplied for insecticide use
Summary of pesticide use on arable silage
| Pesticide group | Formulation area treated | Weight of pesticides applied | Percentage of crop treated | Most used formulations |
|---|---|---|---|---|
| ha | kg | % | ha | |
| Herbicides | 2,066 | 488 | 19 | Metsulfuron-methyl/thifensulfuron-methyl (382) Fluroxypyr (361) |
| Fungicides | 2,019 | 485 | 15 | Folpet (286), Fluoxastrobin/prothioconazole/ trifloxystrobin (283) |
| Insecticides | 31 | 0.2 | 1 | Lambda-cyhalothrin (31) |
| Growth regulators | 344 | 21 | 6 | Trinexapac-ethyl (300) |
| Seed treatments | 1,289 | 20 | 24 | Fludioxonil (859) |
| All pesticides | 5,749 | 1,014 | 26 |
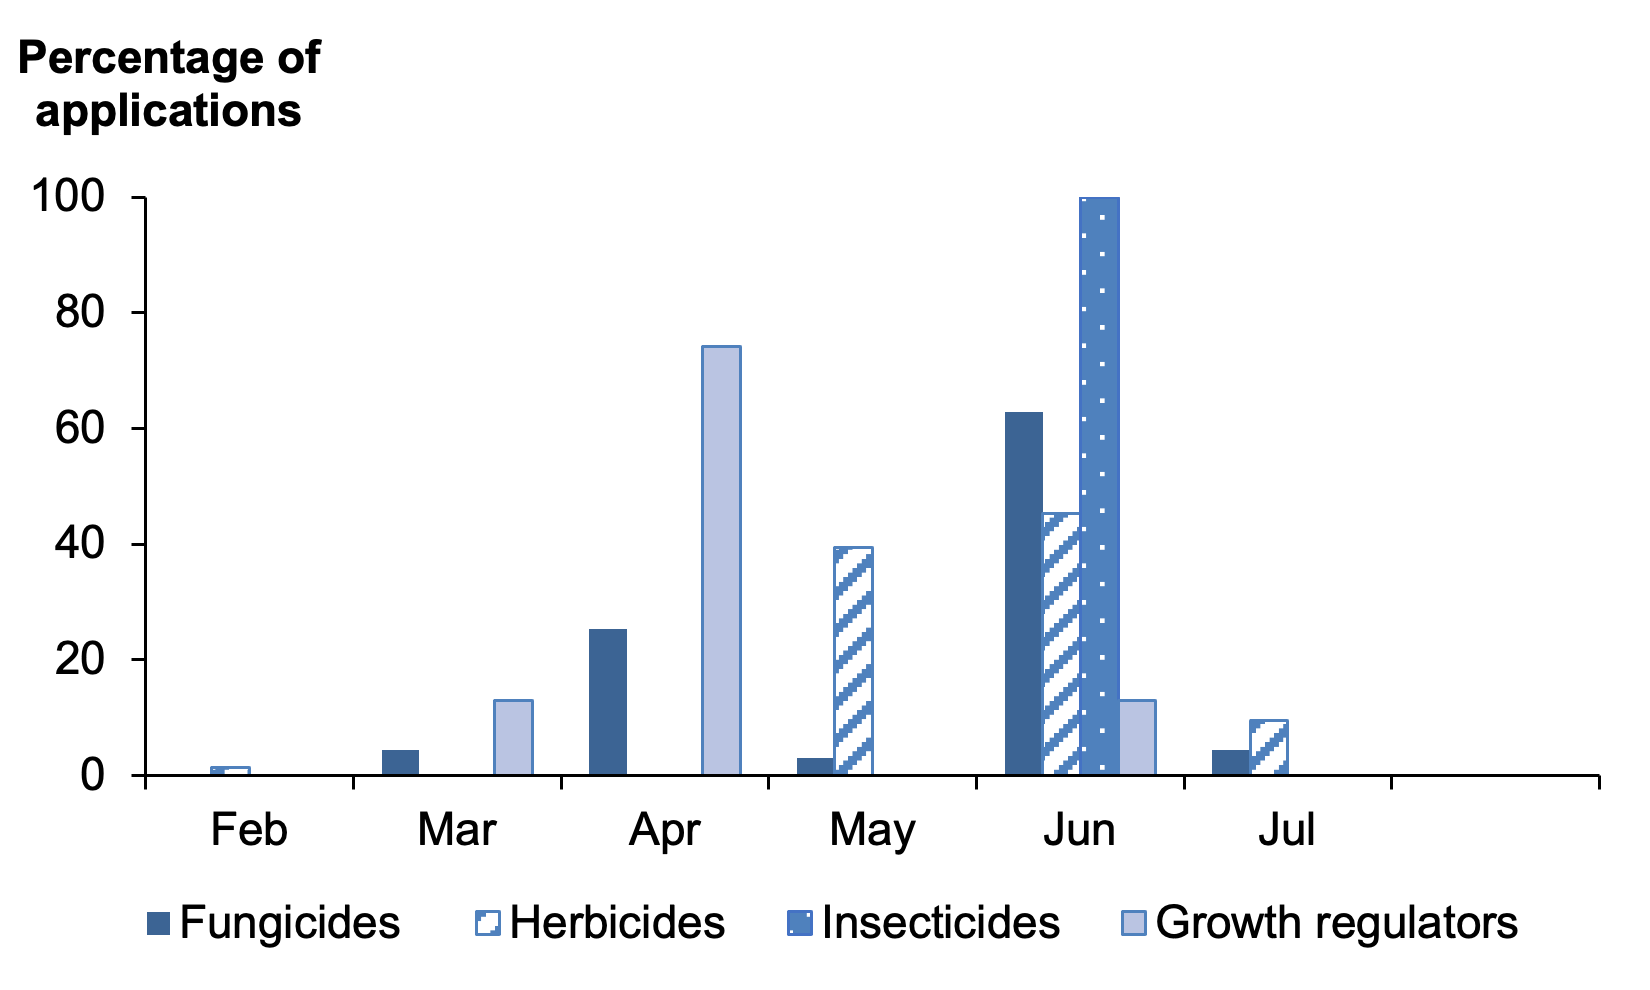
Note: there were small amounts of herbicides (four per cent) applied in September 2020 which are not shown in this figure.
Fodder beet
- An estimated 1,193 hectares of fodder beet was grown in Scotland in 2021, a 95 per cent increase from 2017
- All of the crop surveyed was treated with a pesticide (see Figure 27 for types of pesticides applied)
- Pesticides were applied to 6,210 treated hectares and 3,101 kilograms were applied in total (see summary table below)
- The fodder beet crop received on average 2.3 pesticide applications (Table 1). These applications included 2.2 herbicides and one insecticide on 100 and 11 per cent of the crop respectively
- Timing of pesticide applications are shown in Figure 28
- Reasons were provided for 90 per cent of herbicide use; 72 per cent was for general weed control, 11 per cent for broad-leaved weeds, two per cent each for volunteer cereals and wild oats and one per cent each for brome and stale seed bed creation
- Mildew was the only reason provided for fungicide use. No reasons were provided for the use of insecticides
- The most common varieties encountered were Brick, Robbos and Lactimo, accounting for 39, 16 and 12 per cent respectively
Summary of pesticide use on fodder beet
| Pesticide group | Formulation area treated | Weight of pesticides applied | Percentage of crop treated | Most used formulations |
|---|---|---|---|---|
| ha | kg | % | ha | |
| Herbicides | 4,674 | 3,047 | 100 | Metamitron (2,026) |
| Fungicides | 49 | 9 | 4 | Cyproconazole/ trifloxystrobin (49) |
| Insecticides | 136 | 10 | 11 | Flonicamid (136) |
| Seed treatments | 1,352 | 35 | 60 | Tefluthrin (722) |
| All pesticides | 6,210 | 3,101 | 100 |
Fodder rape
- 2,248 hectares of fodder rape were grown in 2021, a 12 per cent in increase from 2017
- It is estimated that 52 per cent of the fodder rape encountered was mixed with another crop such as kale or stubble turnips
- A further 193 hectares of fodder rape were recorded in fodder crop mixes in the 'other crops for stock-feeding' category (see the other fodder section for details)
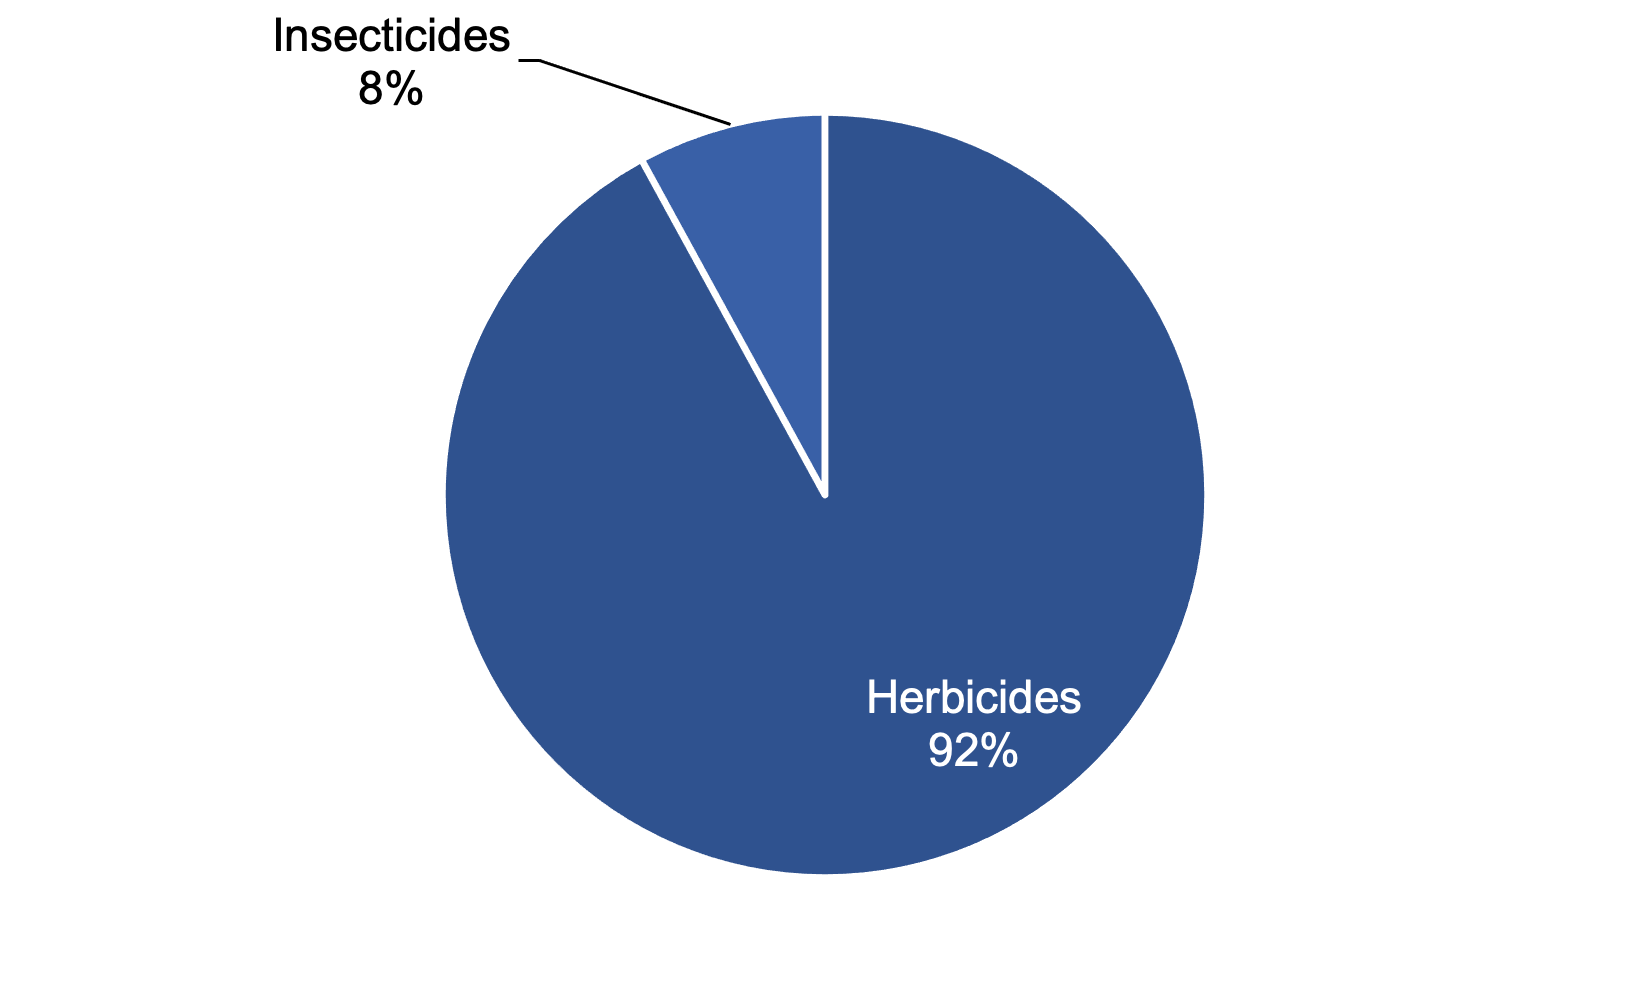
- 20 per cent of the crop was treated with a pesticide (see Figure 29 for types of pesticides used)
- 587 hectares of pesticide formulations were applied and 555 kilograms of pesticides were used in total (see summary table below)
- 20 per cent of the fodder rape crop was treated with a herbicide, receiving on average 1.2 applications (Table 1)
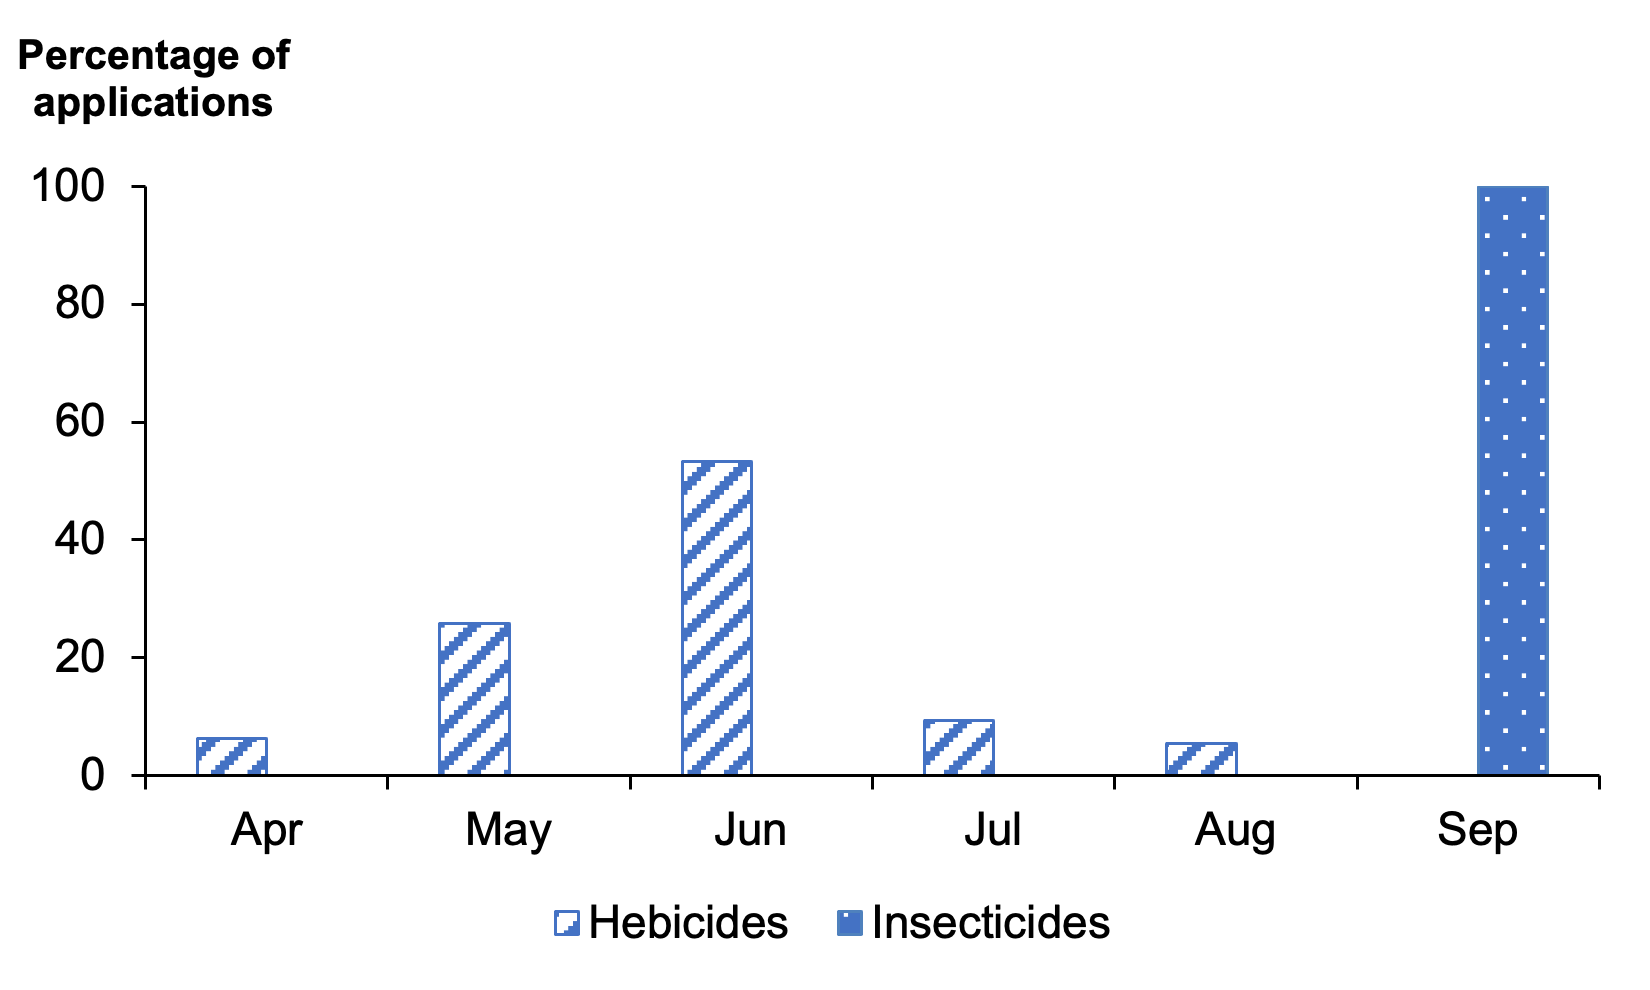
- Timing of pesticide applications are shown in Figure 30
- Reasons were recorded for 75 per cent of the crop; 33 per cent of herbicide use was for general weed control with 14 per cent each for grass/pasture kill, mayweed and shepherd's purse. All recorded insecticide use was for caterpillars (38 per cent)
- The most common varieties encountered were Redstart, accounting for 27 per cent of the sampled area, Hobson 21 per cent and Swift, five per cent. Redstart and Swift are both rape/kale hybrids
Summary of pesticide use on fodder rape
| Pesticide group | Formulation area treated | Weight of pesticides applied | Percentage of crop treated | Most used formulations |
|---|---|---|---|---|
| ha | kg | % | ha | |
| Herbicides | 540 | 555 | 20 | Glyphosate (431) |
| Insecticides | 47 | < 0.5 | 2 | Deltamethrin (29) |
| All pesticides | 587 | 555 | 20 |
Kale and cabbage
- 2,068 hectares of kale and cabbage were grown in 2021, an eight per cent increase from 2017
- No cabbage was encountered during this survey
- It is estimated that 20 per cent of the kale encountered was mixed with another crop such as fodder rape or turnips
- A further 285 hectares of kale, kale hybrid and kale mixes were recorded in the 'other crops for stock-feeding' category (see the other fodder section for details)
- 52 per cent of the crop was treated with a pesticide (see Figure 31 for types of pesticides applied)
- 1,229 hectares of pesticide formulations were applied and 1,213 kilograms of pesticide used in total (see summary table below)
- The kale crop received on average one herbicide spray (applied to 52 per cent of the crop area) (Table 1)
- Timing of pesticide applications are shown in Figure 32
- Reasons were provided for all herbicide use on kale; 69 per cent was for general weed control, 30 per cent for grass/pasture kill and less than one per cent for chickweed. All insecticide use was for caterpillars
- The most common variety encountered was Maris Kestrel, accounting for 33 per cent of the sample area surveyed
Summary of pesticide use on kale and cabbage
| Pesticide group | Formulation area treated | Weight of pesticides applied | Percentage of crop treated | Most used formulations |
|---|---|---|---|---|
| ha | kg | % | ha | |
| Herbicides | 1,163 | 1,209 | 52 | Glyphosate (626) |
| Insecticides | 33 | < 0.5 | 2 | Lambda-cyhalothrin (33) |
| Molluscicides | 33 | 4 | 2 | Ferric phosphate (33) |
| All pesticides | 1,229 | 1,213 | 52 |
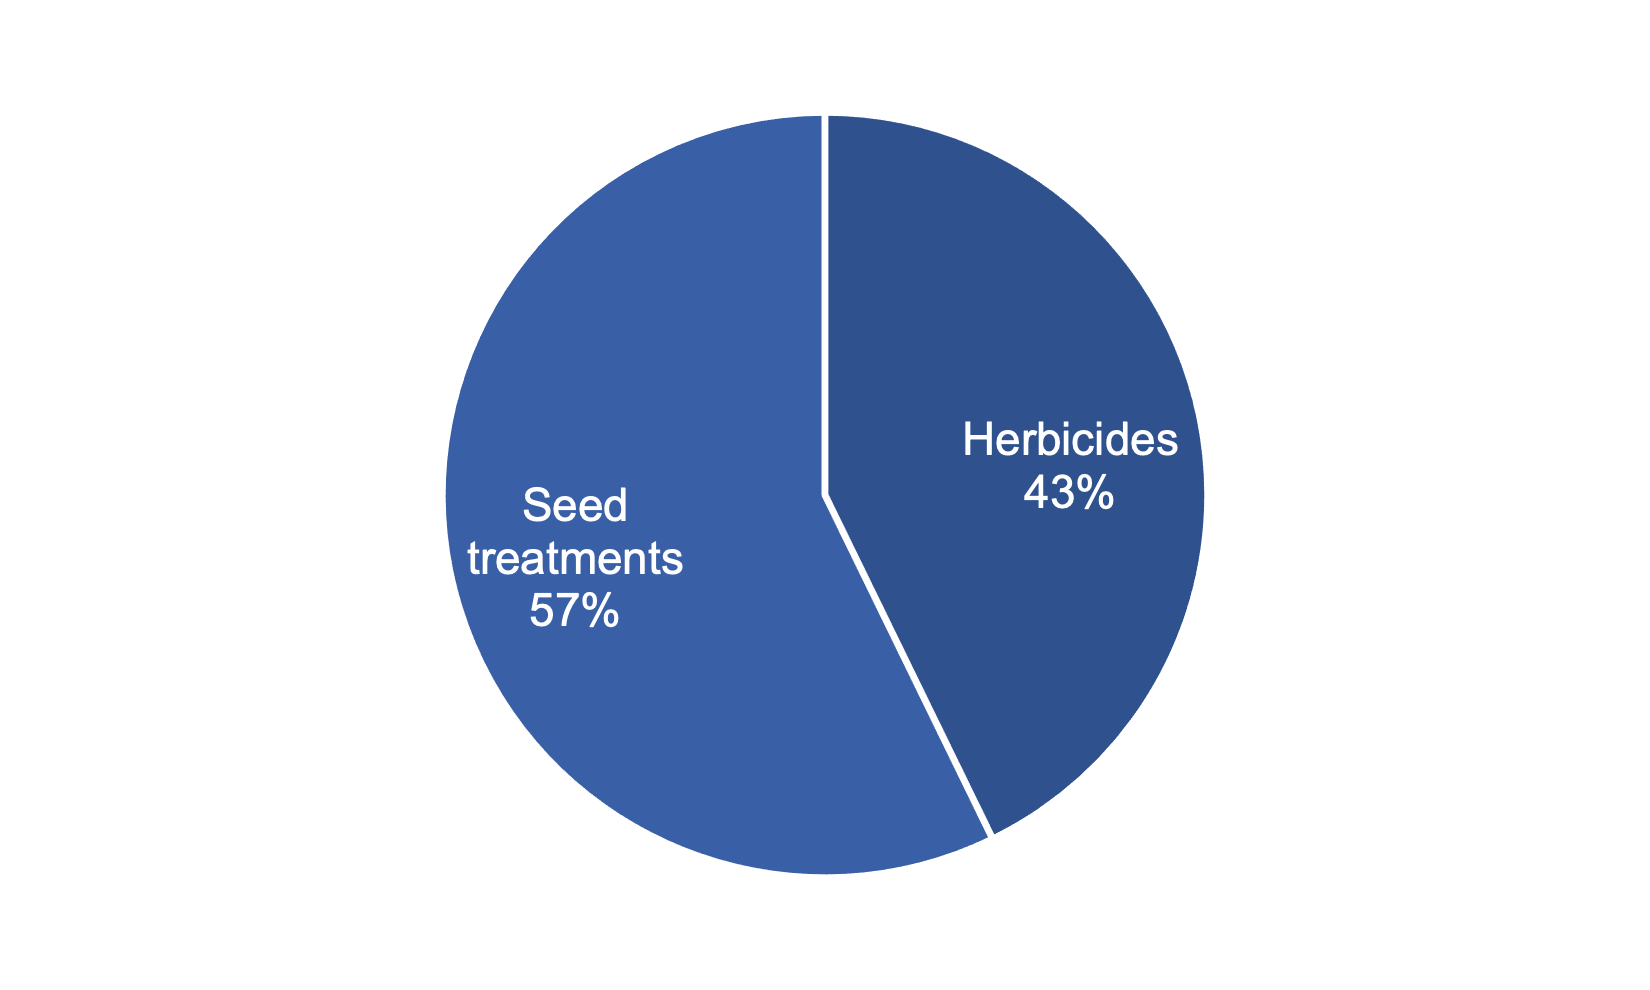
Maize
- An estimated 1,229 hectares of maize was grown in Scotland in 2021, a 55 per cent increase since 2017
- All of the maize crop was treated with a pesticide (see figure 33 for types of pesticide used)
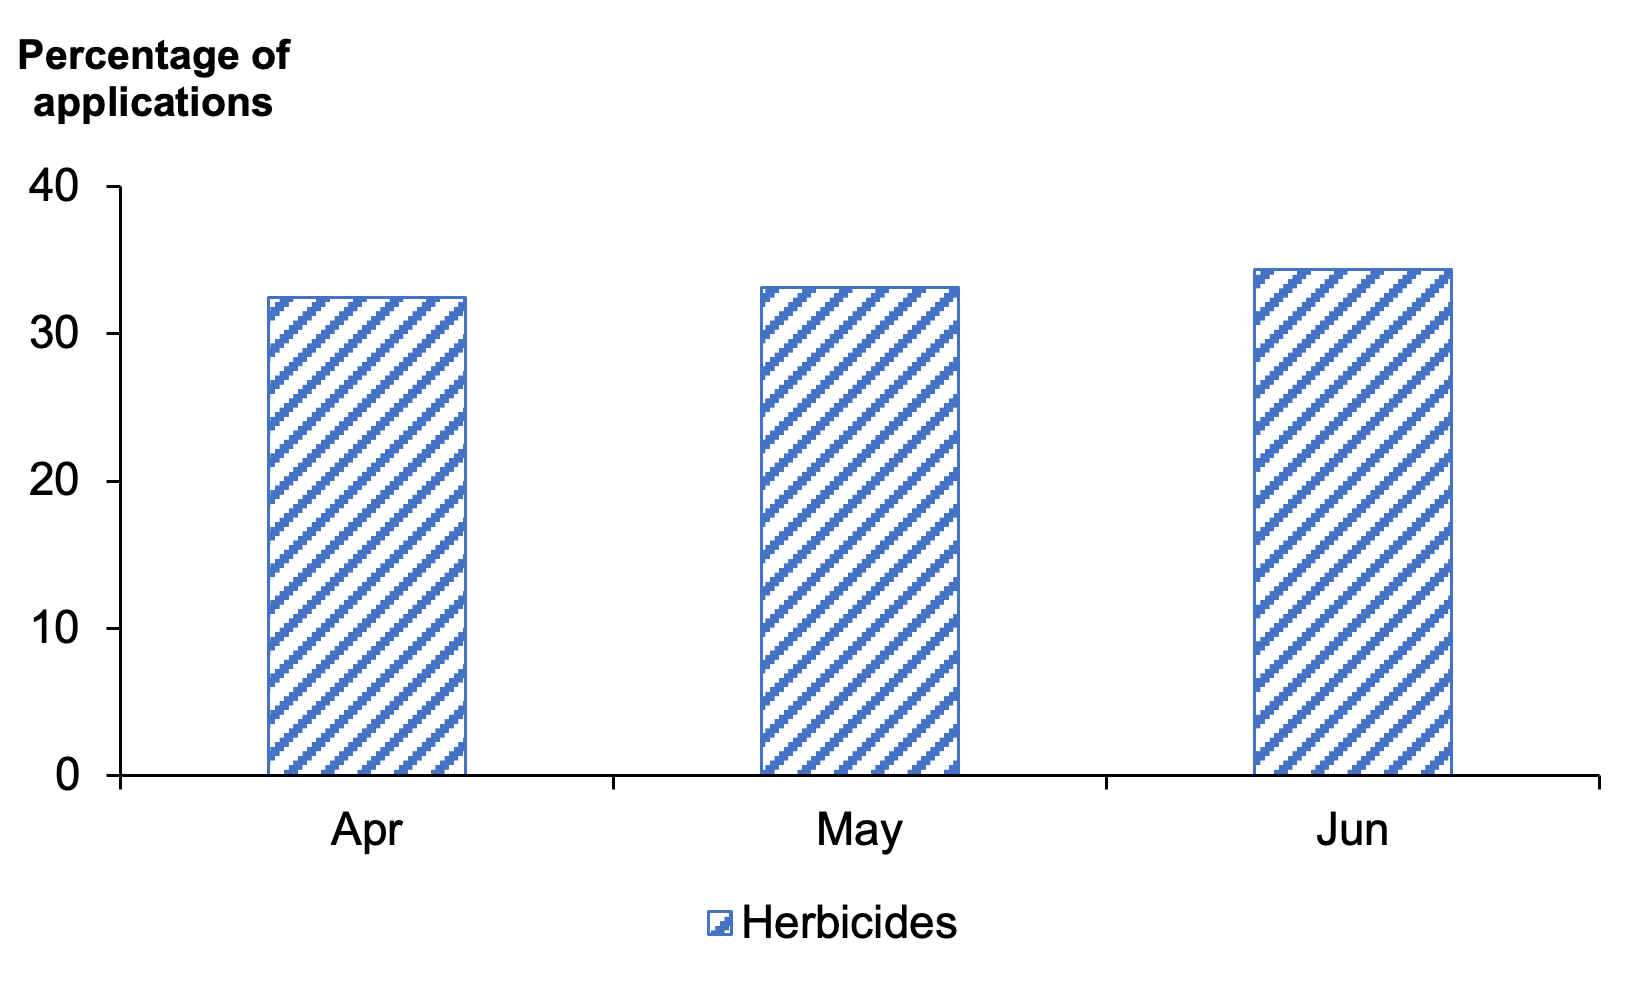
- The maize crop received on average 1.4 applications of herbicides (Table 1)
- 4,883 hectares of pesticide formulations were applied and a total of 1,951 kilograms of pesticides were used (see summary table below)
- Timing of pesticide applications are shown in Figure 34
- 98 per cent of herbicide use was for general weed control, with one per cent each for broad-leaved weed control and nettles
- The most common variety encountered was Cito KWS, accounting for 47 per cent of the sampled area, followed by Dignity at 27 per cent
Summary of pesticide use on maize
| Pesticide group | Formulation area treated | Weight of pesticides applied | Percentage of crop treated | Most used formulations |
|---|---|---|---|---|
| ha | kg | % | ha | |
| Herbicides | 2,089 | 1,872 | 100 | Dimethenamid-P/pendimethalin (778) |
| Seed treatments | 2,794 | 80 | 86 | Metalaxyl/prothioconazole (1062) |
| All pesticides | 4,883 | 1,951 | 100 |
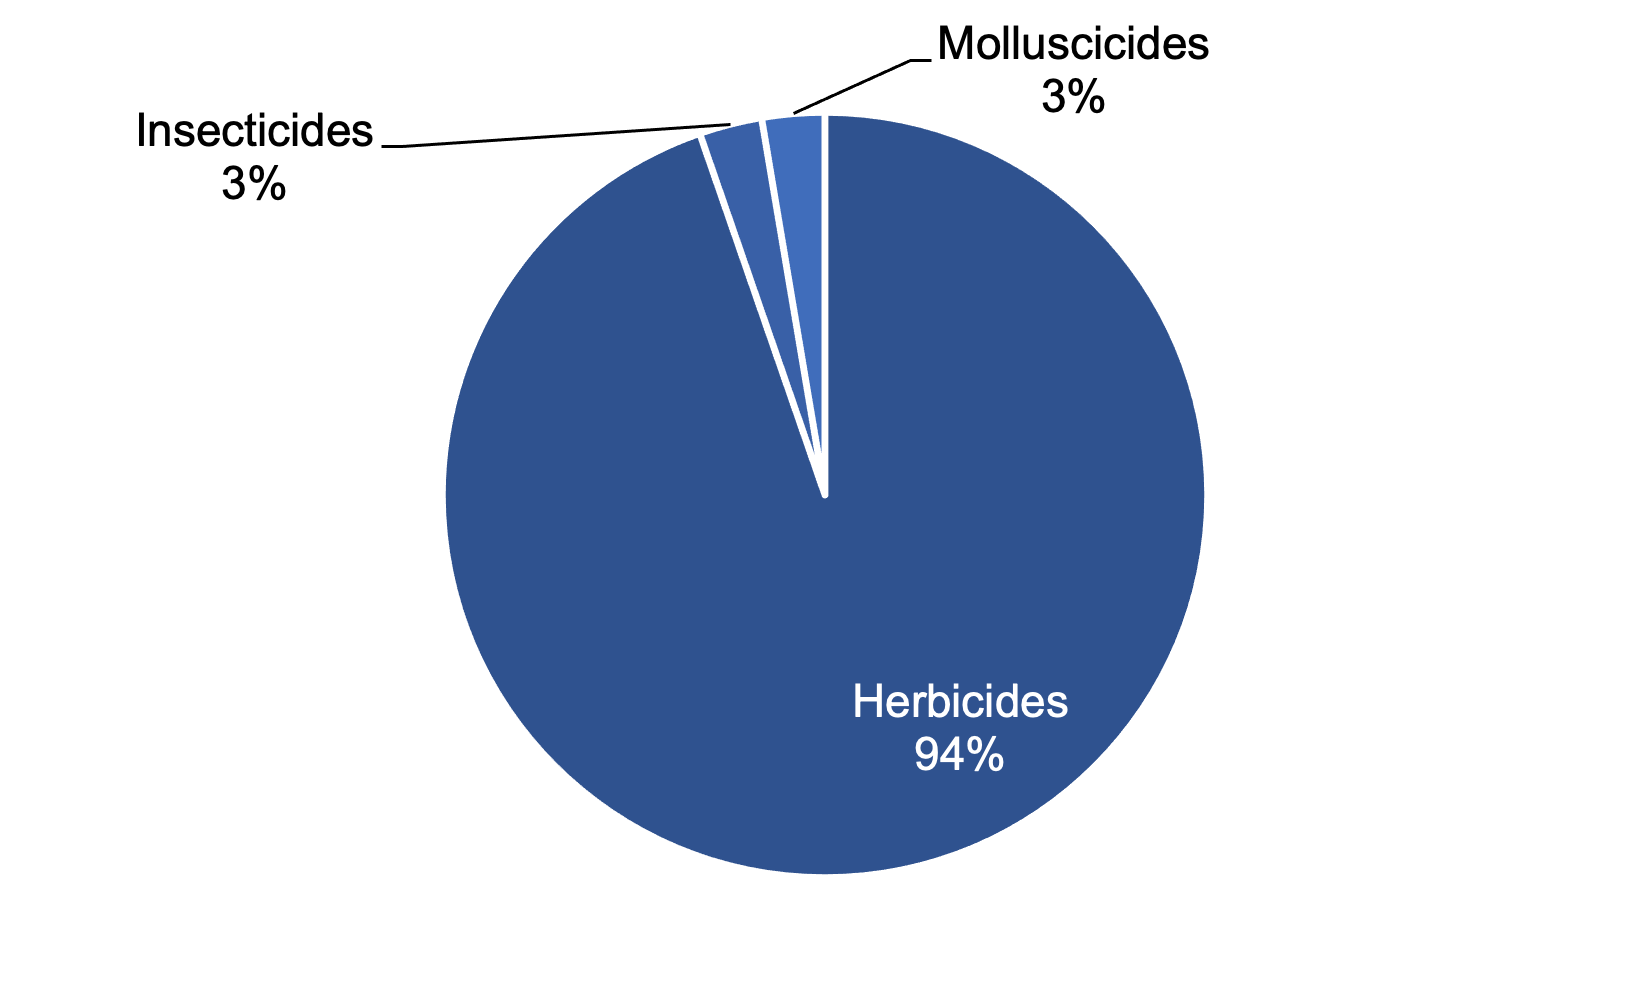
Stubble turnips
- An estimated 479 hectares of stubble turnips were grown in Scotland in 2021, an increase of 41 per cent from 2017
- A further 295 hectares of stubble turnips and stubble turnips fodder crop mixes were recorded in the 'other crops for stock-feeding' category (see the other fodder section for details)
- Stubble turnips are often a constituent of other fodder mixes and therefore it is likely that the estimated area grown is under-estimated
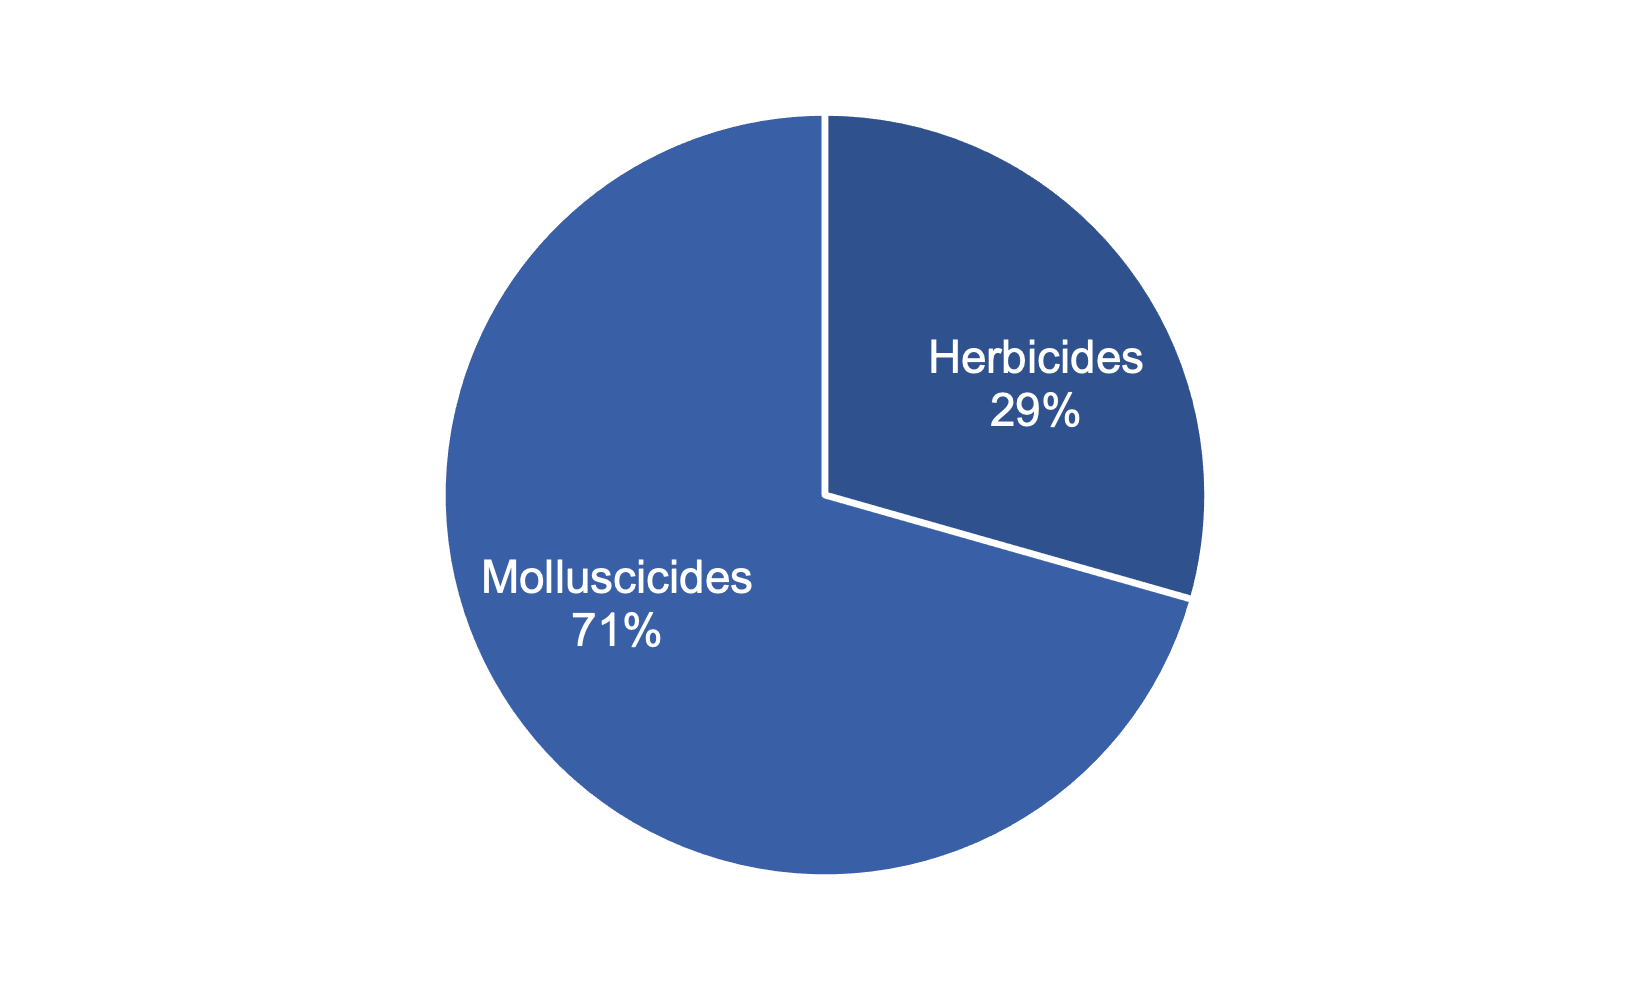
- 32 per cent of the crop was treated with a pesticide (see Figure 31 for types of pesticides applied)
- 155 hectares of pesticide formulations were applied and 16 kilograms of pesticide used in total (see summary table below)
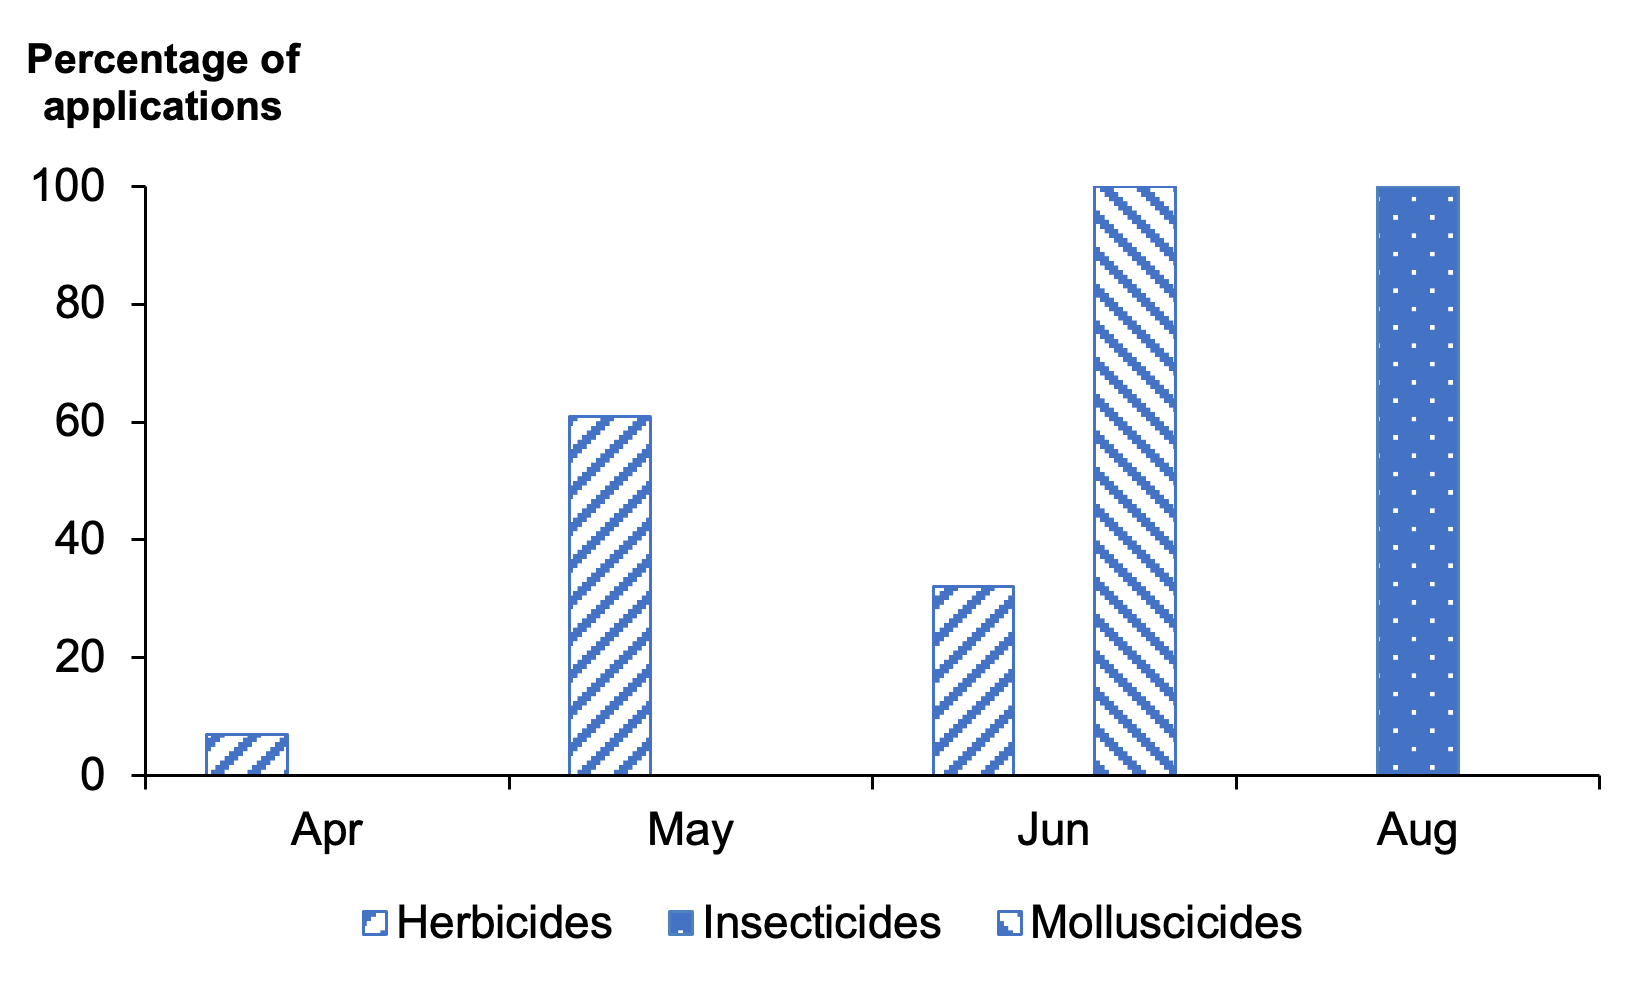
- Stubble turnips received on average one herbicide and one molluscicides application (applied to 10 and 23 per cent of the crop area respectively) (Table 1). All applications were in August
- The most common variety encountered was Rondo, accounting for 35 per cent of the sampled area
Summary of pesticide use on stubble turnips
| Pesticide group | Formulation area treated | Weight of pesticides applied | Percentage of crop treated | Most used formulations |
|---|---|---|---|---|
| ha | kg | % | ha | |
| Herbicides | 46 | 4 | 10 | Fluazifop-P-butyl (46) |
| Molluscicides | 109 | 12 | 23 | Ferric phosphate (109) |
| All pesticides | 155 | 16 | 32 |
Turnips and swedes
- 3,517 hectares of turnips and swedes were grown in Scotland in 2021, representing an eight per cent decrease from 2017
- A further 64 hectares of turnips and swedes and turnips and swedes fodder crop mixes were recorded in the 'other crops for stock-feeding' category (see the other fodder section for details)
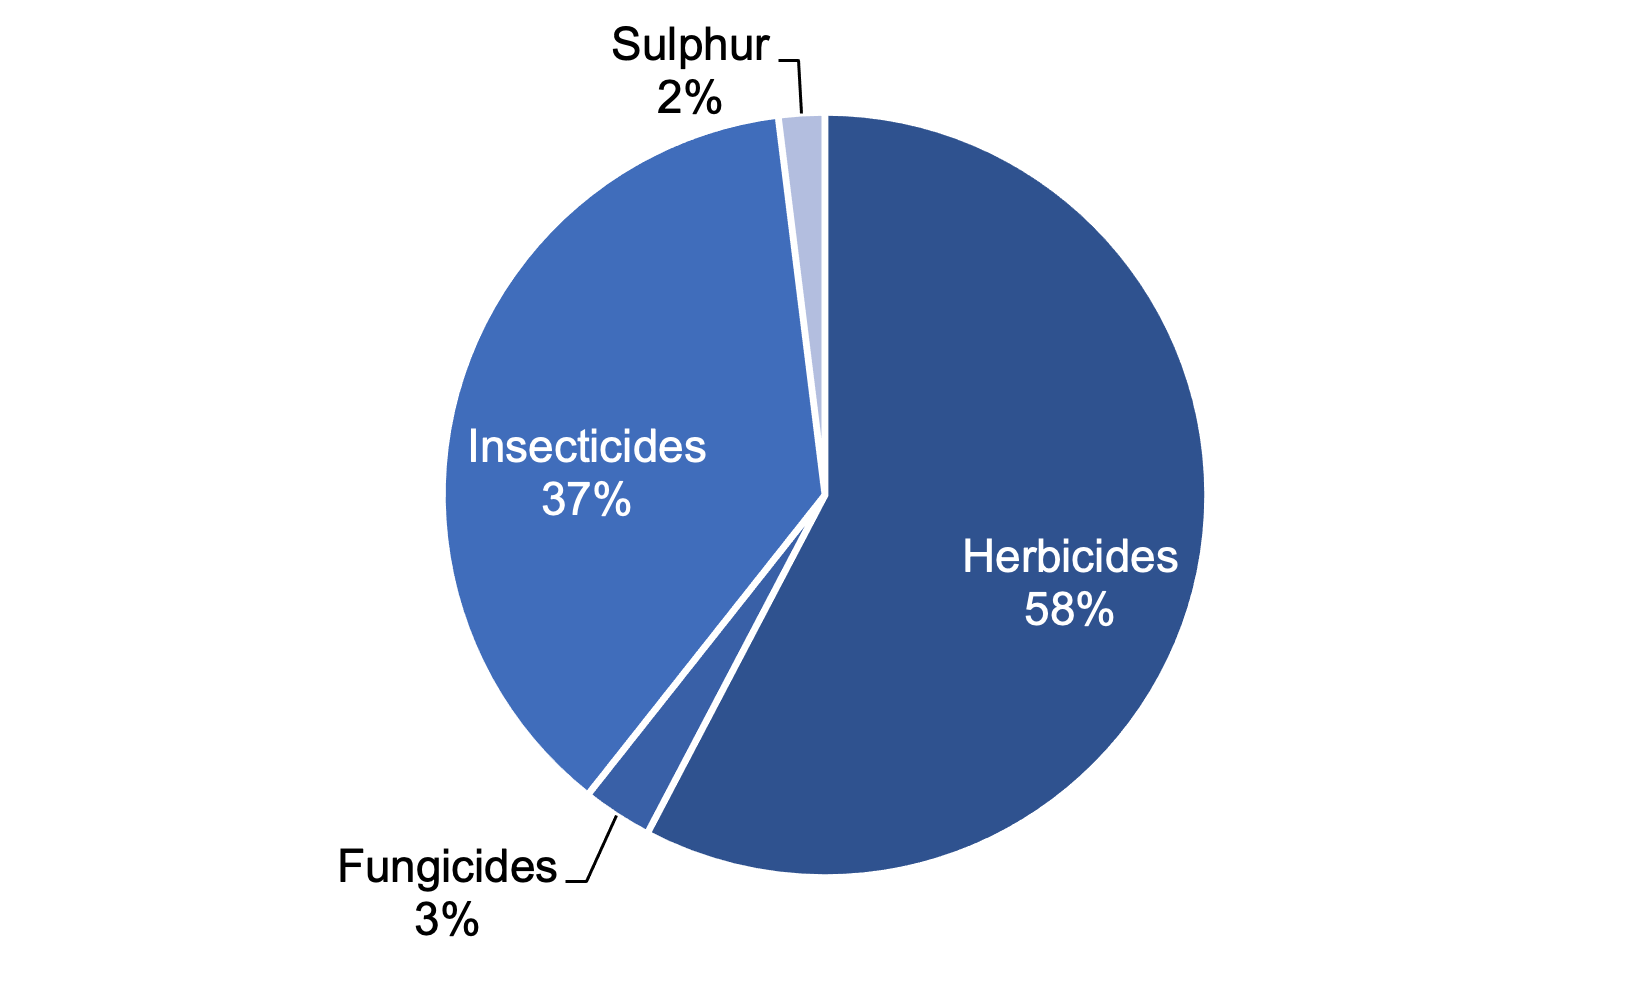
- 77 per cent of the crop was treated with a pesticide (see Figure 36 for types of pesticides applied)
- 6,060 hectares of pesticide formulations were applied and 2,090 kilograms of pesticides were used in total (see summary table below)
- Turnips and swedes received on average 1.8 pesticide applications (Table 1). These included one herbicide application and 1.6 insecticide applications (applied to 71 and 42 per cent of the crop respectively)
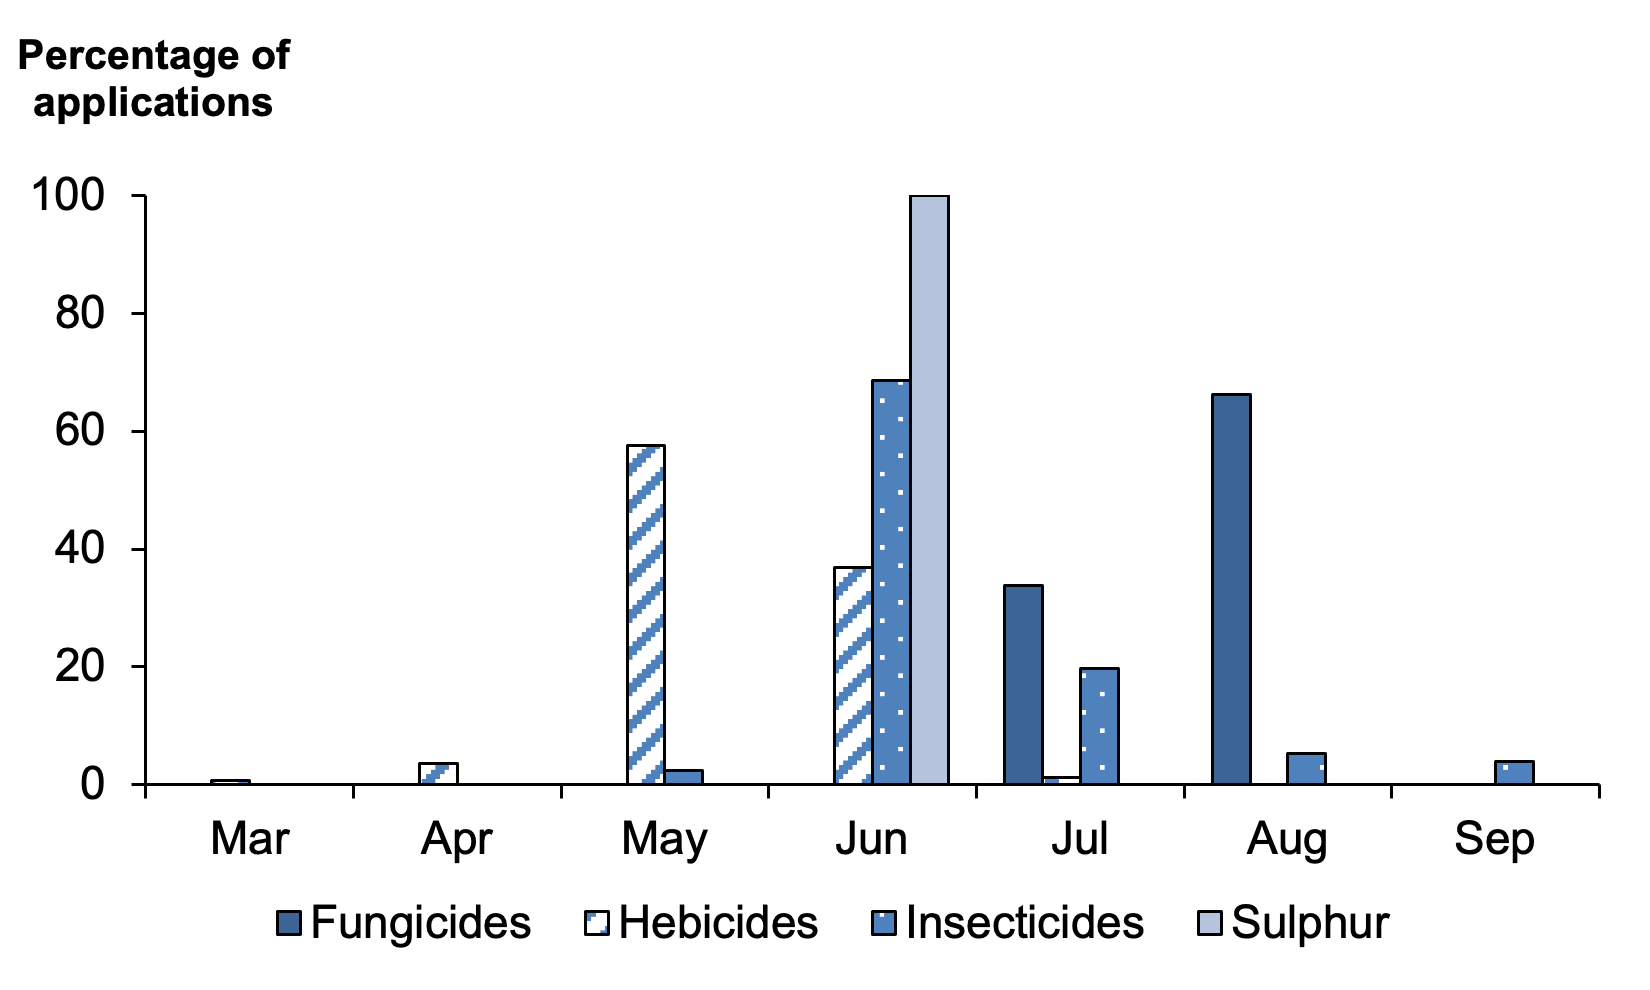
- Timing of pesticide applications is shown in Figure 37
- The only reason supplied for fungicide use on turnips and swedes was for general disease control on 20 per cent of the crop. Reasons were given for 83 per cent of herbicide use; 78 per cent was for general weed control, two per cent for grass kill and one per cent each for couch grass and wild oats respectively. Reasons were provided for 81 per cent of insecticide use; 64 per cent for flea beetle, nine per cent for aphids and eight per cent for general insect pests
- The most common variety encountered were Lomond accounting for 37 per cent of the sample area
Summary of pesticide use on turnips and swedes
| Pesticide group | Formulation area treated | Weight of pesticides applied | Percentage of crop treated | Most used formulations |
|---|---|---|---|---|
| ha | kg | % | ha | |
| Herbicides | 3,496 | 1,538 | 71 | Metazachlor (1,378), Clomazone (986) |
| Fungicides | 179 | 38 | 5 | Prothioconazole (119) |
| Insecticides | 2,266 | 19 | 42 | Deltamethrin (1,266) |
| Sulphur | 119 | 495 | 3 | [z] |
| All pesticides | 6,060 | 2,090 | 77 |
Note: some shorthand is used in this table: [z] = not applicable.
Other fodder crops
- 1,028 hectares of other fodder crops were grown in Scotland in 2021, showing very little change from the 1,033 hectares grown in 2017
- Other fodder consists of any crops other than arable silage reported in the 'other crops for stock-feeding' category
- In 2021 this consisted of rape, kale, turnips, stubble turnips and fodder crop mixes
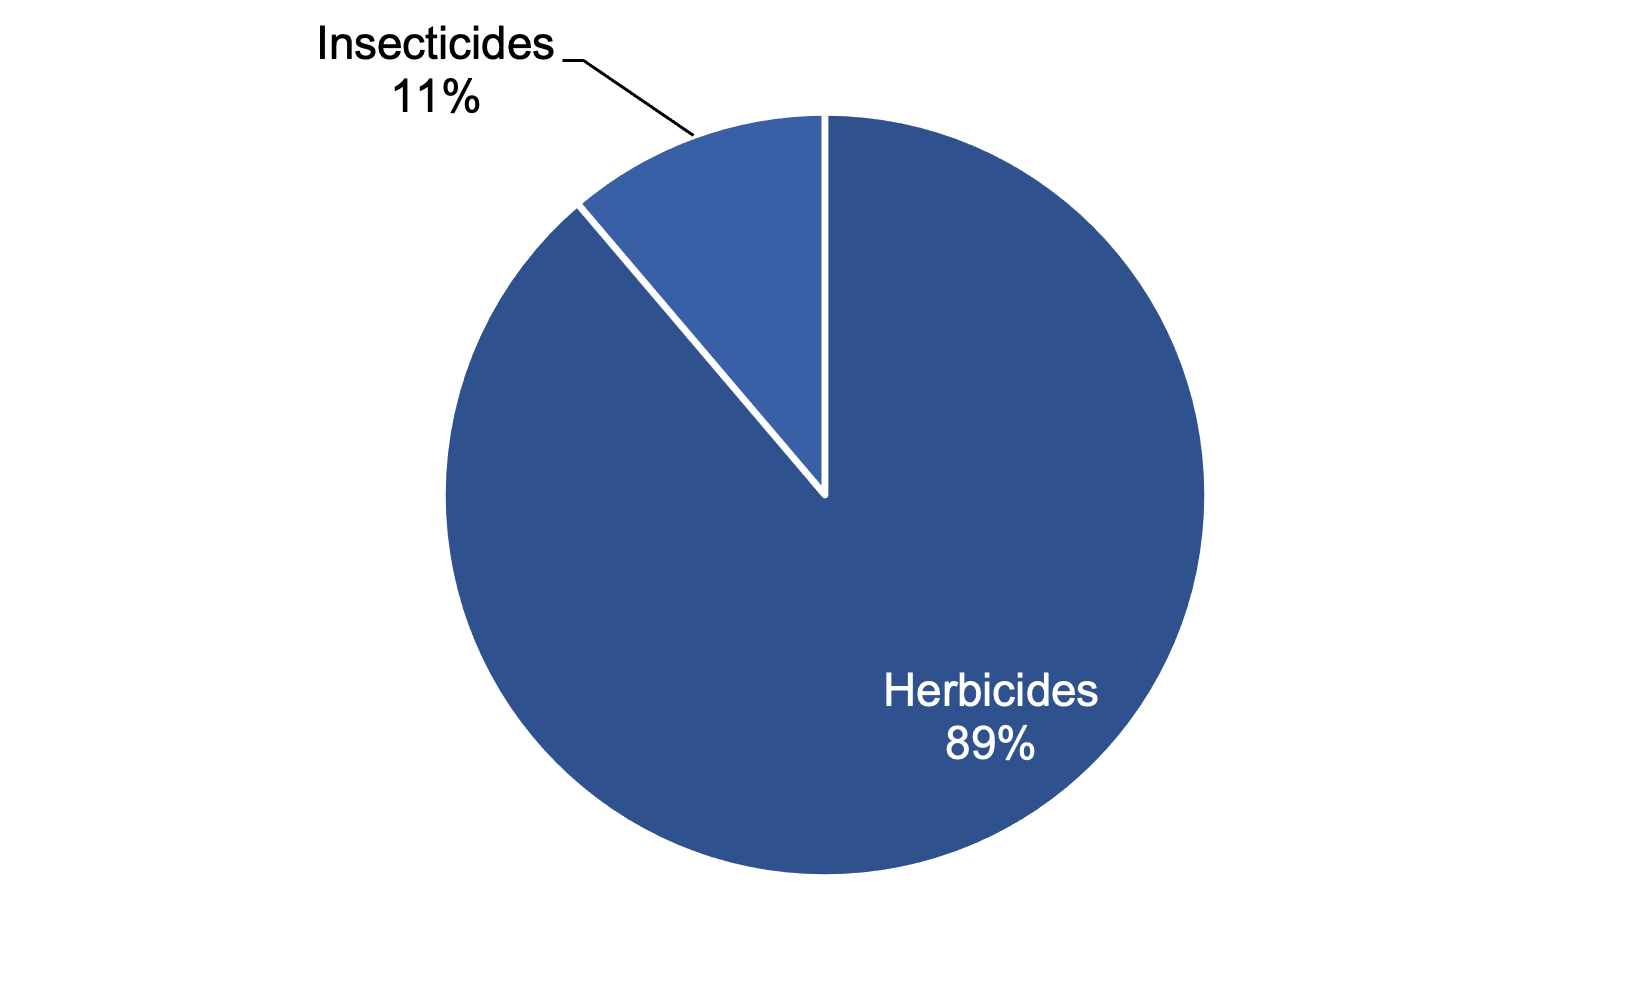
- 27 per cent of the crop was treated with a pesticide (see Figure 38 for types of pesticides applied)
- 316 hectares of pesticide formulations and 378 kilograms of pesticides were applied (see summary table below)
- The other fodder crops received on average one application of herbicide (applied to 27 per cent of the crop area) (Table 1)
- Timing of pesticide applications is shown in Figure 39
- All reported insecticide use was for caterpillars. Reasons for herbicide use was given for 13 per cent of the area, all of which was for destroying the previous crop
Summary of estimated pesticide use on other fodder crops
| Pesticide group | Formulation area treated | Weight of pesticides applied | Percentage of crop treated | Most used formulations |
|---|---|---|---|---|
| ha | kg | % | ha | |
| Herbicides | 281 | 378 | 27 | Glyphosate (232) |
| Insecticides | 35 | < 0.5 | 3 | Lambda-cyhalothrin (35) |
| All pesticides | 316 | 378 | 27 |
Contact
Email: psu@sasa.gov.scot