Pesticide usage in Scotland: Grassland and Fodder Crops 2021
This publication presents information from a survey of pesticide use on grassland and fodder crops in Scotland during 2021.
Part of
General trends
Crop area – grassland and rough grazing
The estimated area of grassland and rough grazing in 2021 was 4,378,628 hectares (Table 16). This is very similar to the area recorded in 2017(3) and in 2013(4). Since the last survey, the area of rough grazing has remained almost the same, grass over five years old has increased by two per cent and grass under five years old has decreased by 19 per cent (Figure 1). Undersown grass (not illustrated in Figure 1) has increased by 22 per cent since the last survey in 2017 but has fallen by 41 per cent when compared to 2013. However, it should be noted that there was a change in census definition of temporary and permanent grass between 2013 and 2017. This change may have influenced the reported crop areas, and the subsequent estimates of pesticide use made using these census areas (refer to Appendix 4).
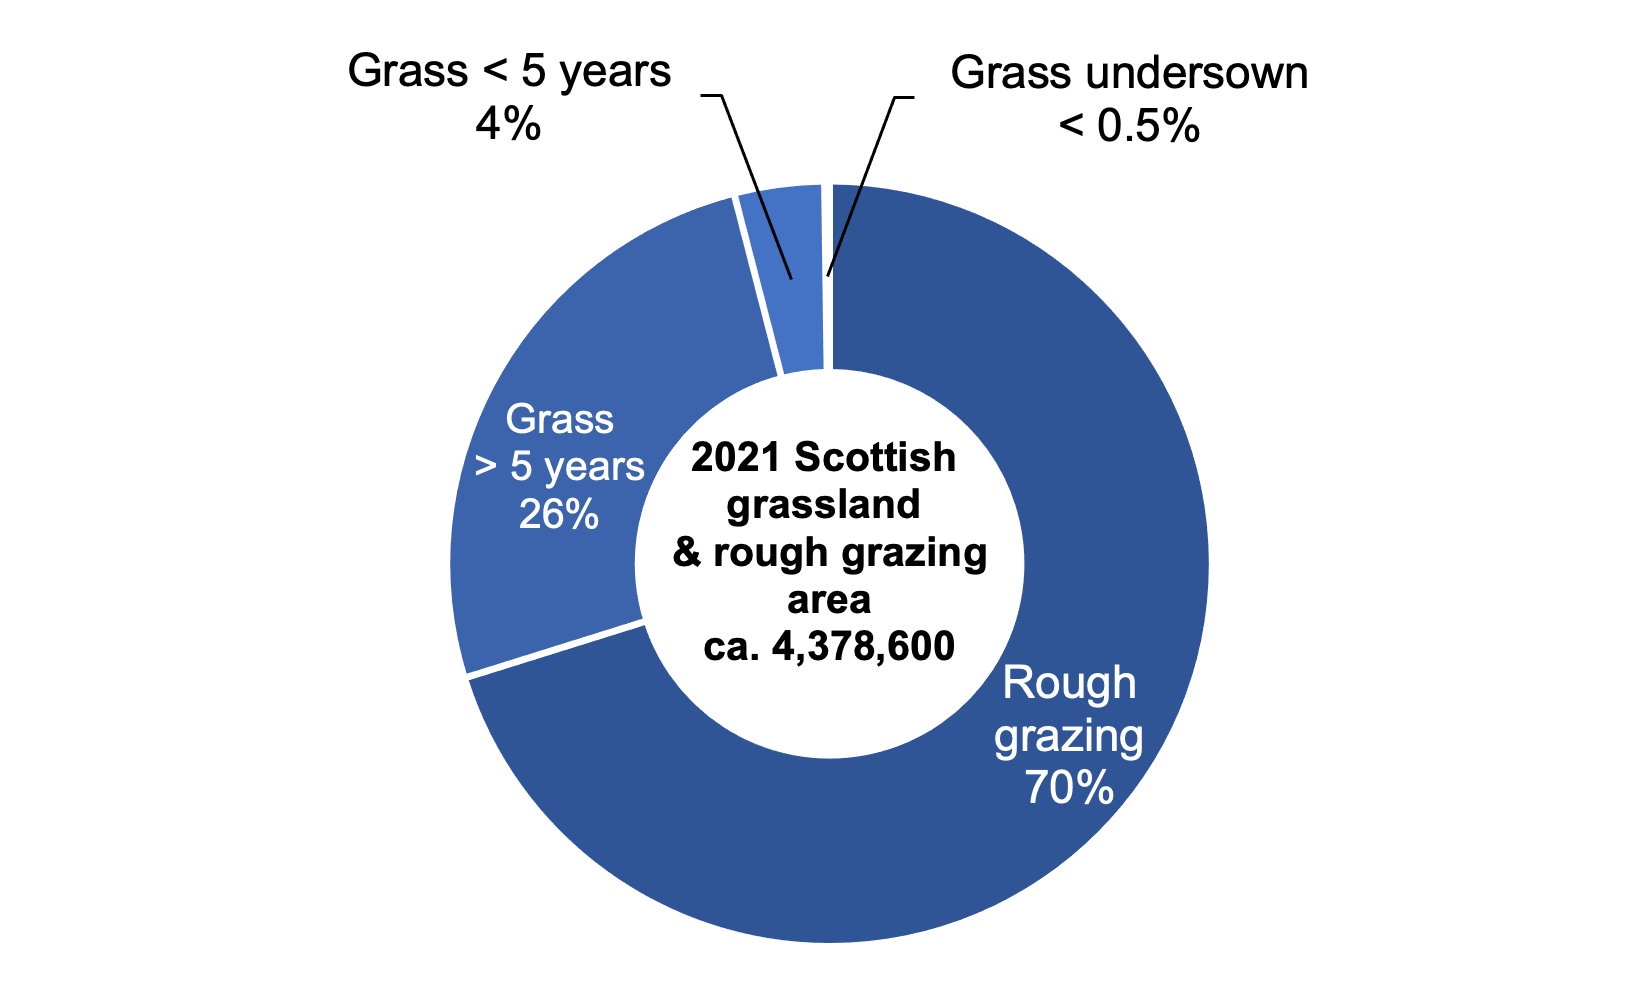
In 2021, as in 2017, rough grazing accounted for 70 per cent of Scottish grassland area. Grass over five years old accounted for 26 per cent and grass under 5 years old four per cent. Undersown grass remained unchanged at less than 0.5 per cent of the crop area (Figure 2). The majority of grassland and rough grazing in Scotland is in the Highlands and Islands region (Figure 3).
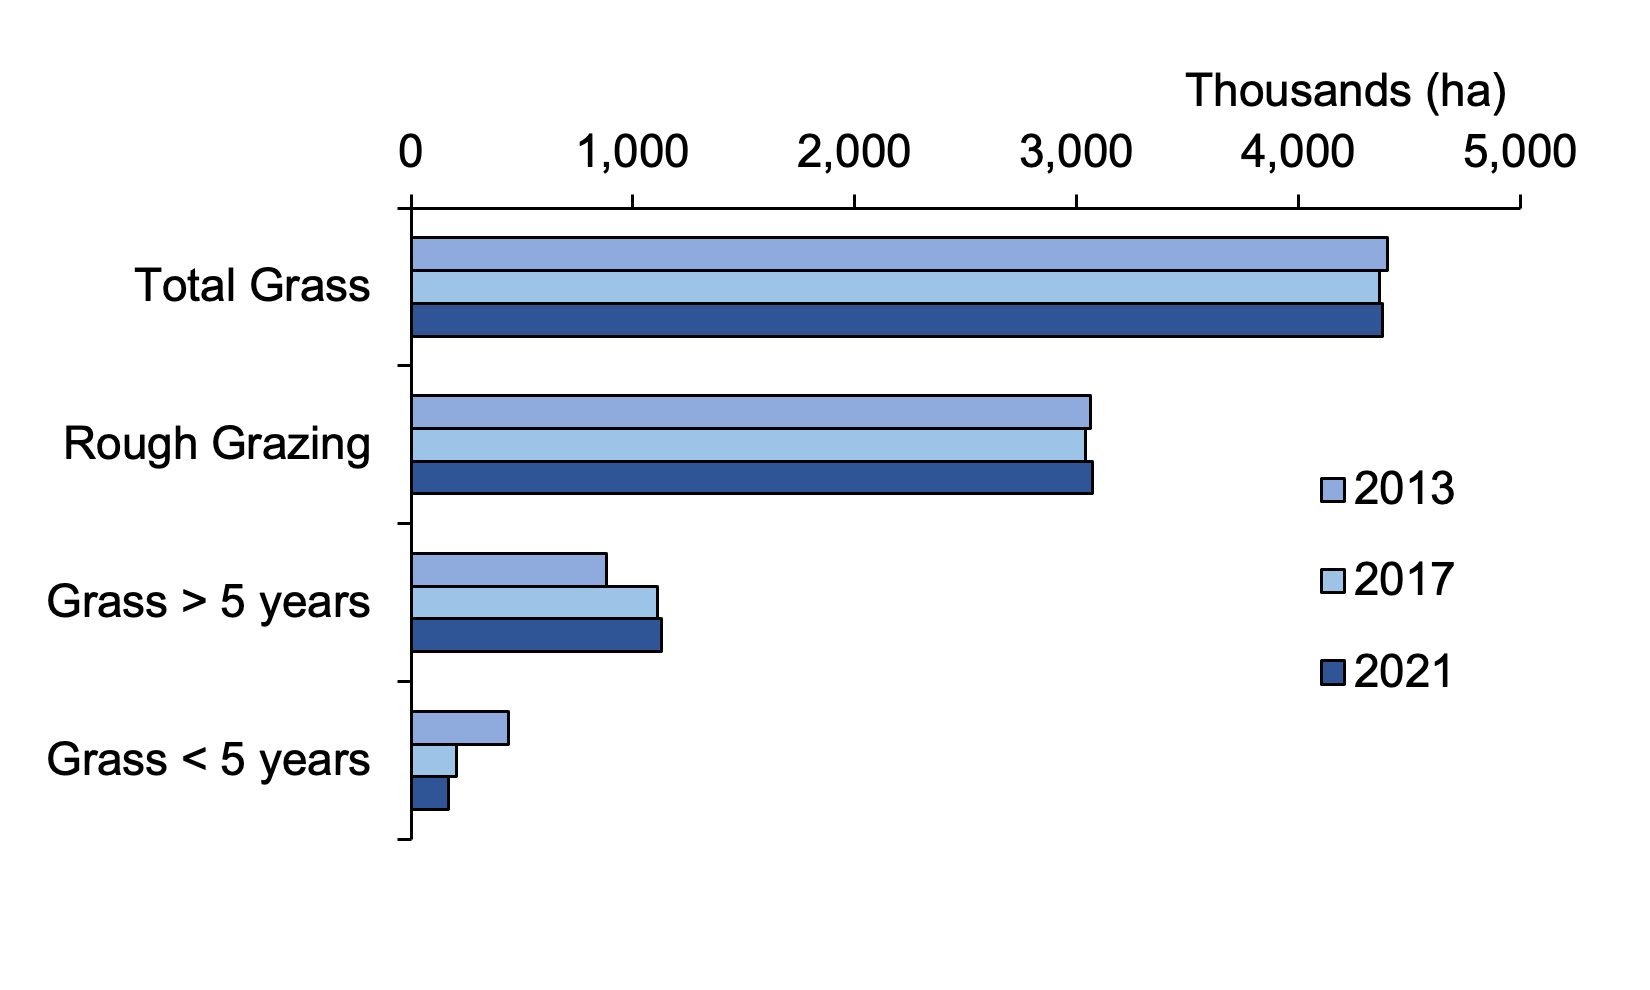
Note: undersown grass has been excluded as the area grown is < 20,000 hectares.
There was a change in census definition of temporary and permanent grass between 2013 and 2017. Therefore, reported crop changes may not wholly reflect changes in land use (Appendix 4).
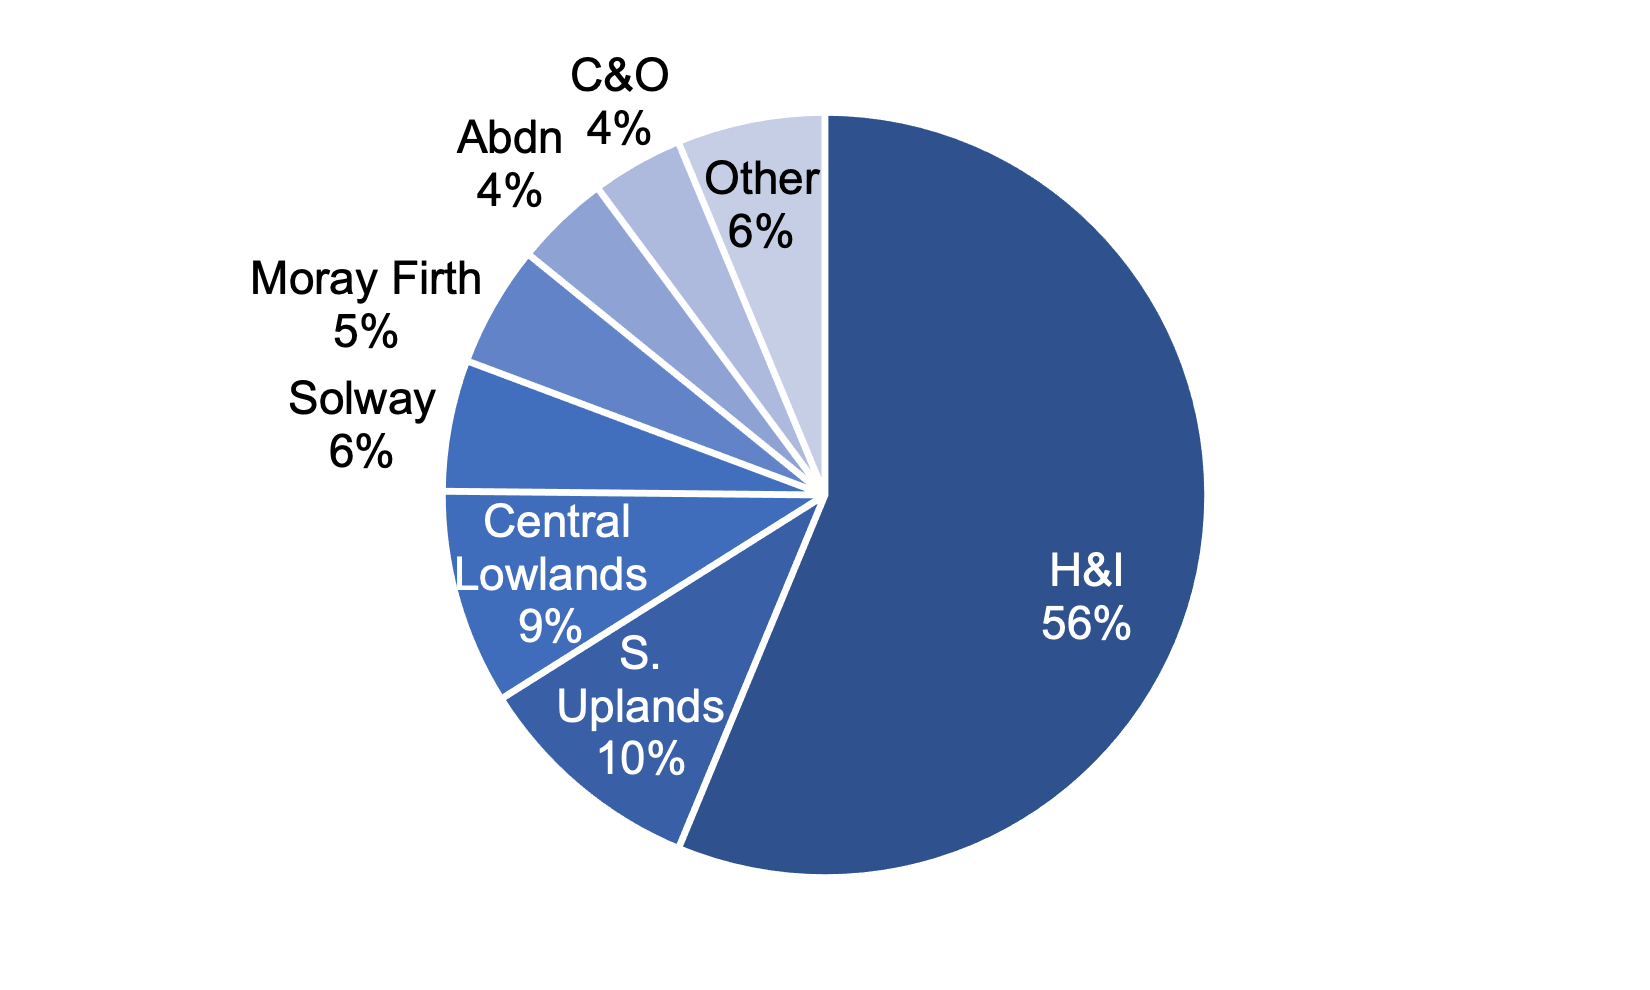
Note: H&I = Highlands and Islands, S. Uplands = Southern Uplands, C&O = Caithness and Orkney, Abdn = Aberdeen, Other = Angus, East Fife, Lothian and Tweed Valley.
Crop area – fodder crops
The estimated area of fodder crops grown in 2021 was 17,214 hectares (Table 15). This represents a six per cent increase from 2017 and a 12 per cent decrease from 2013. Since the previous survey, the area grown with turnips & swedes and other stock-feeding crops have decreased (eight & five per cent respectively). Conversely, the area grown with fodder beet, maize, fodder rape, kale & cabbage have increased (95, 55, 12 and eight per cent respectively, Figure 4).
In 2021, 38 per cent of fodder crops were found in the 'other stock-feeding' category of the census (Figure 5). Arable silage accounted for 84 per cent of this category. Turnips & swedes (20 per cent), fodder rape (13 per cent) and kale & cabbage (12 per cent) were also widely grown. Maize and fodder beet accounted for seven per cent each. The distribution of fodder crops within Scotland is broadly similar to the pattern seen in 2017 and 2013, with the largest proportion, 17 per cent, grown in the Aberdeen region (Figure 6).
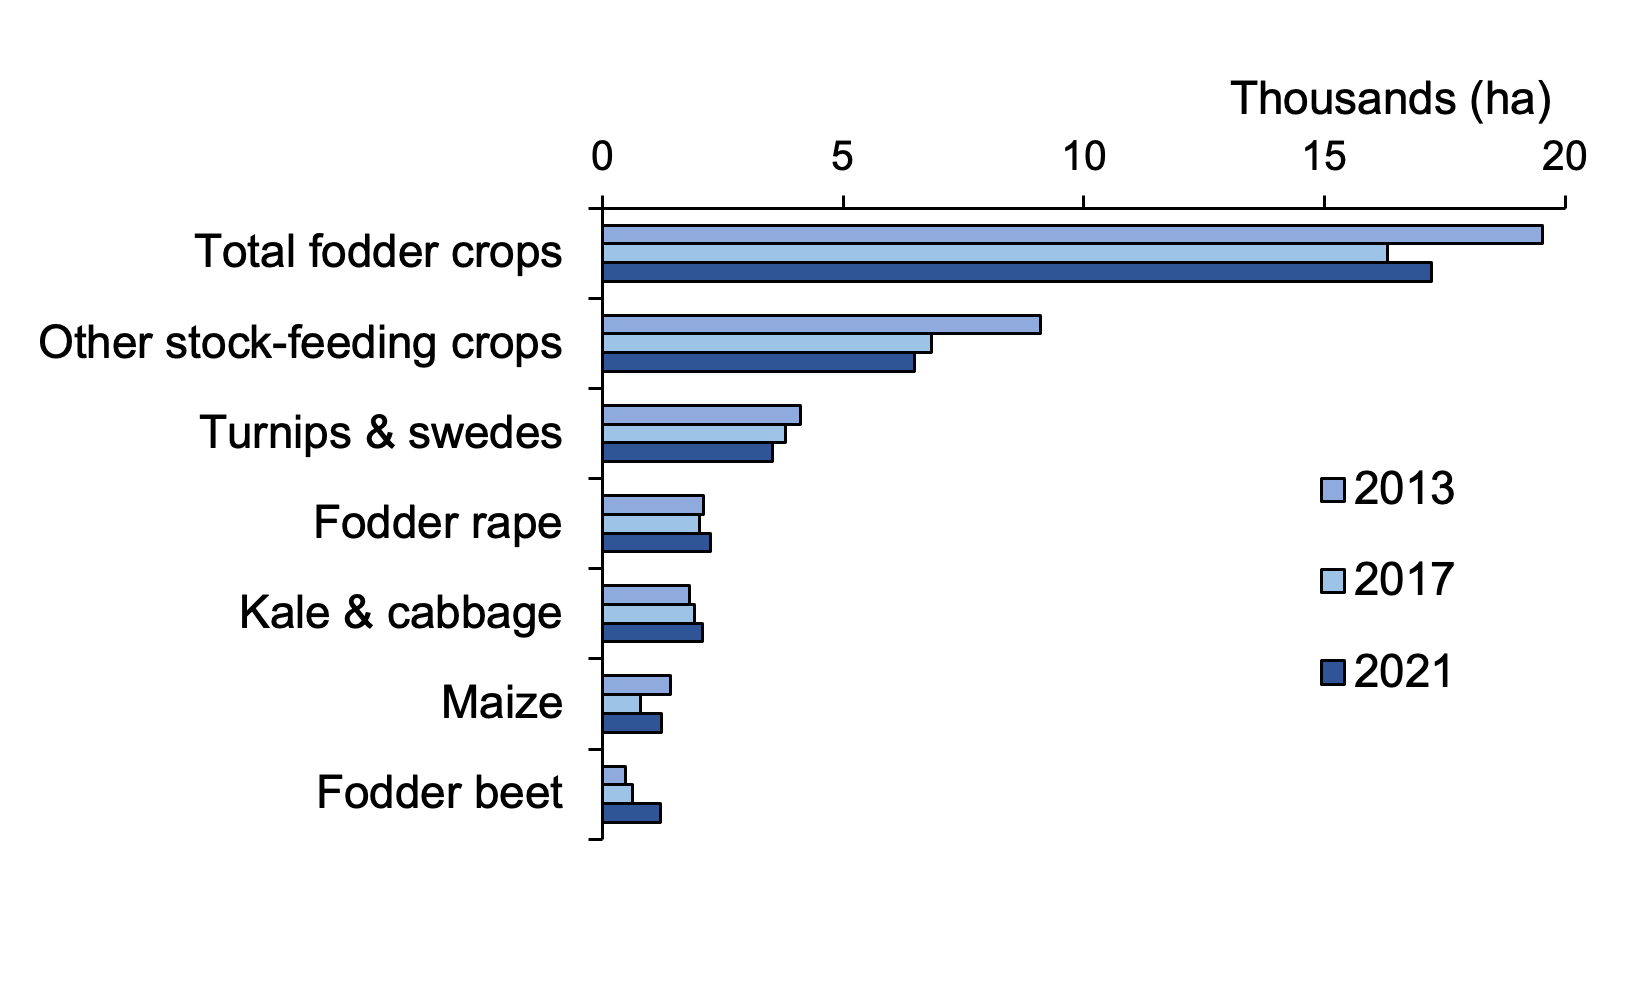
Note: 'other stock-feeding crops' include arable silage, fodder rape, kale, stubble turnips and fodder crop mixes.

Note: 'other stock-feeding crops' include arable silage, red clover, swedes, kale, stubble turnips and fodder crop mixes.
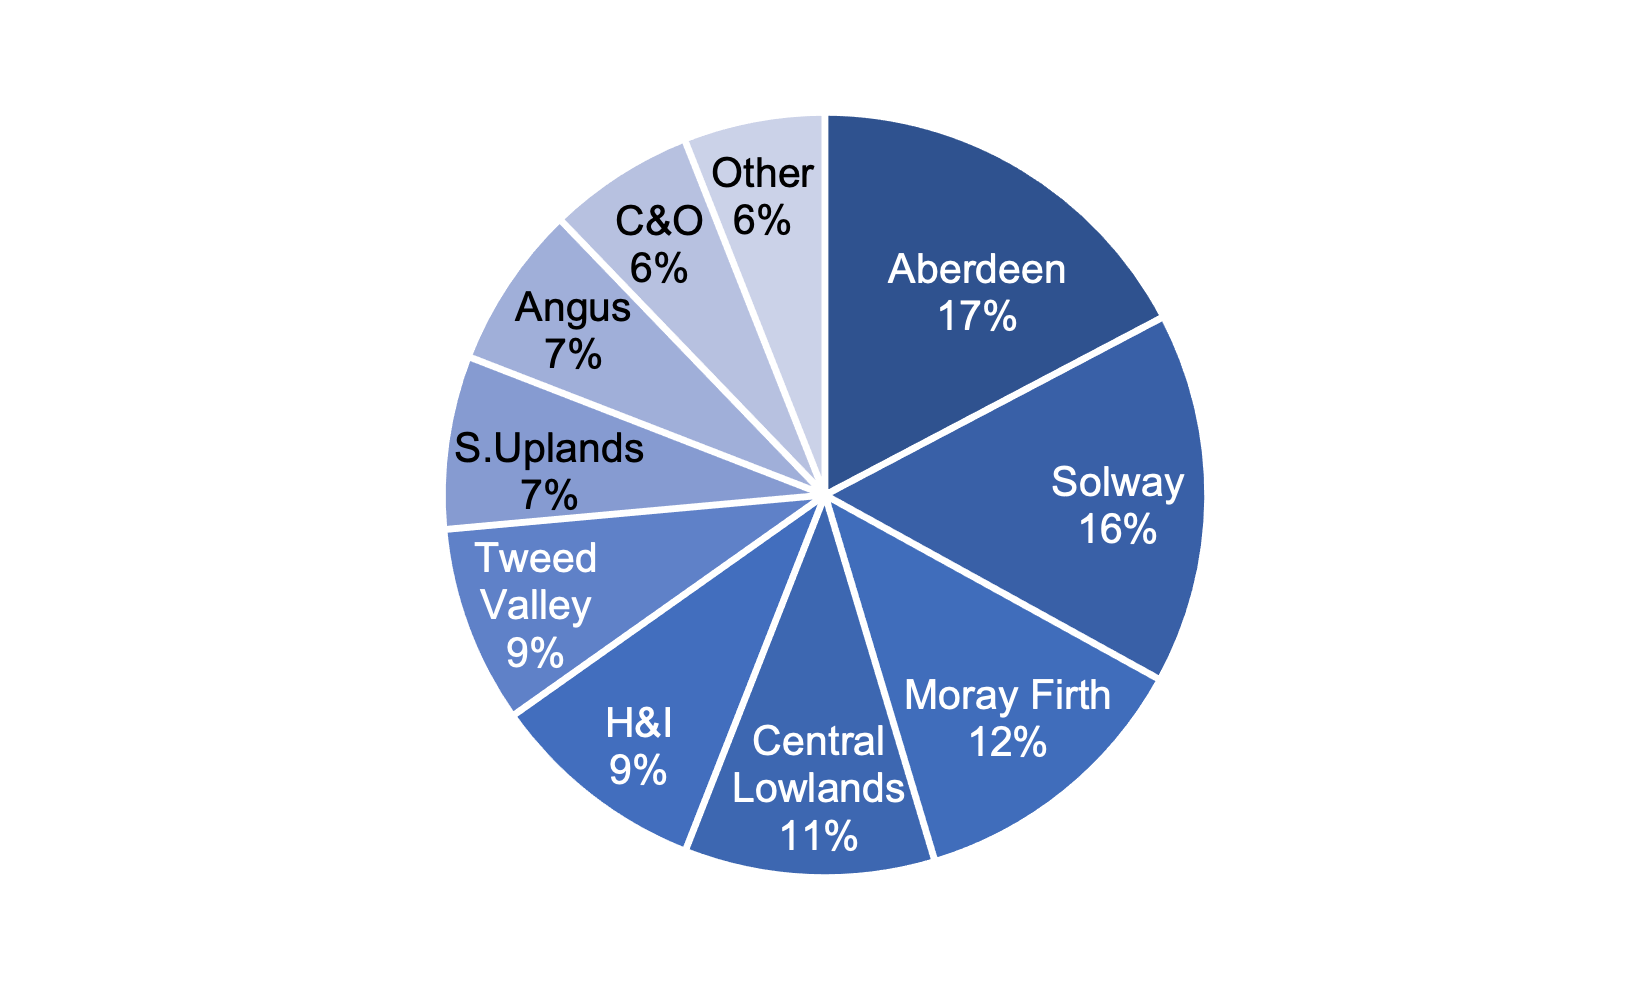
Note: H&I = Highlands and Islands, C&O = Caithness and Orkney, S. Uplands = Southern Uplands, Other = Lothian and East Fife.
Pesticide usage – grassland and rough grazing
As in previous surveys, the proportion of grassland and rough grazing treated with a pesticide was very low. As in 2017, only four per cent of grassland and less than 0.5 per cent of rough grazing was treated with a pesticide. These areas received 1.1 and 1.0 sprays respectively, on average, during 2021 (Table 1).
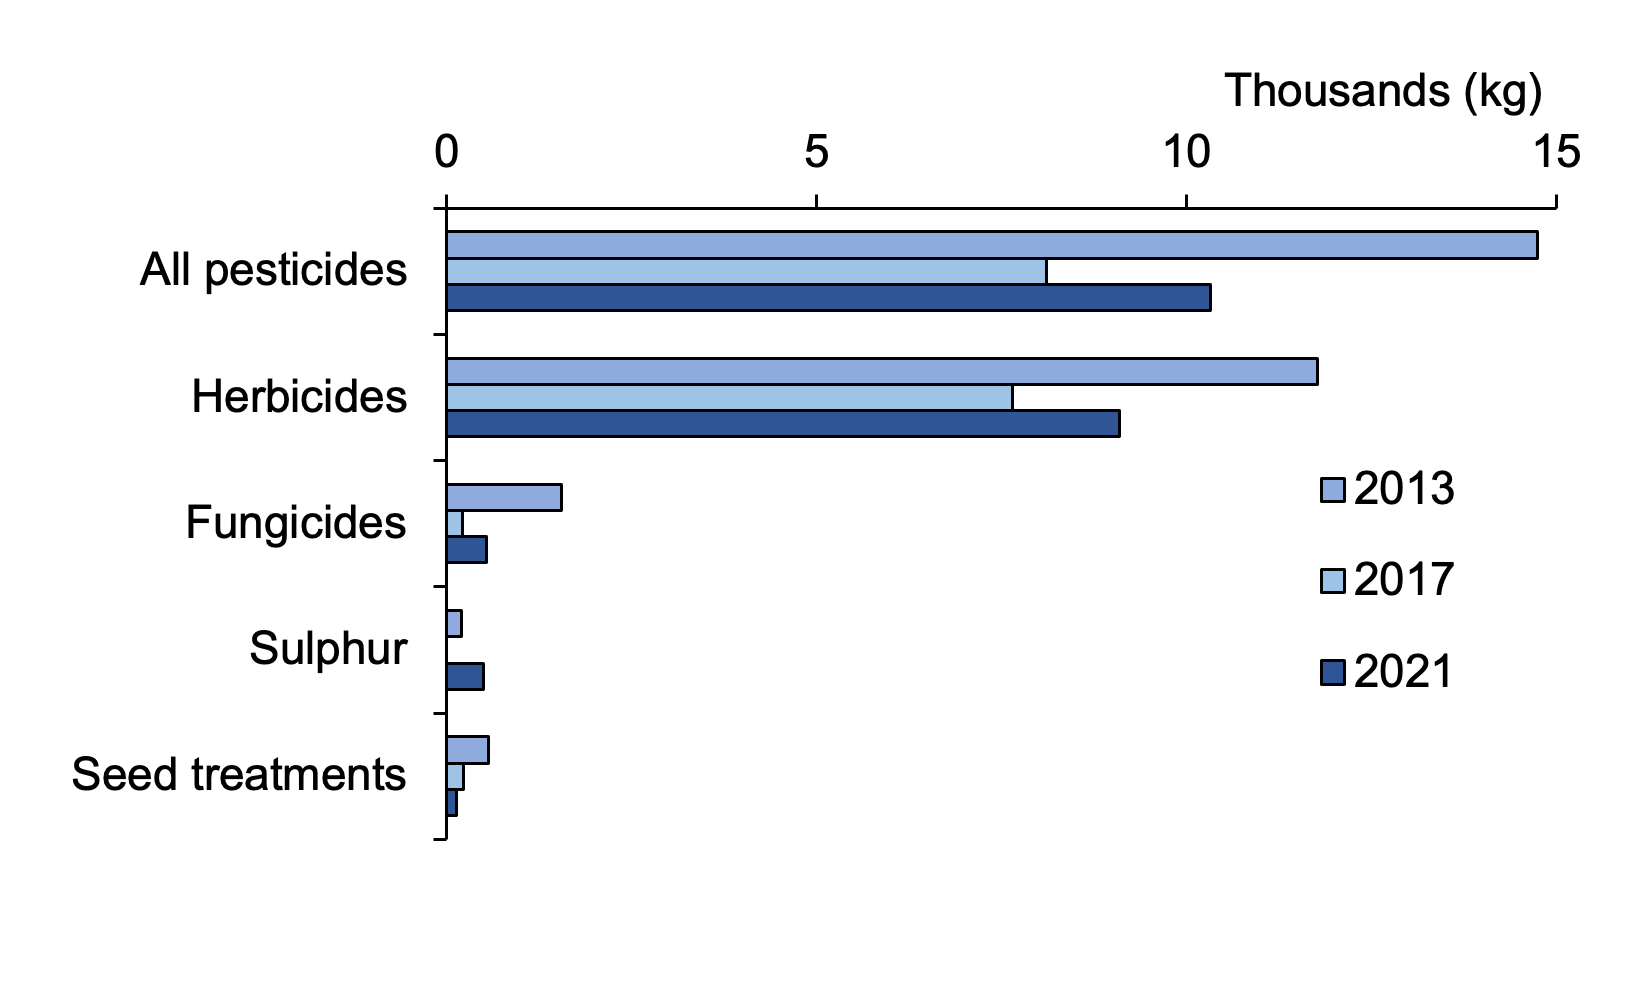
It is estimated that the area of grassland and rough grazing treated with a pesticide formulation in 2021 was ca. 81,000 hectares (Table 14 & Figure 7). This represents a decrease of eight per cent since 2017 and seven per cent since 2013. In relation to the weight of pesticide applied, ca. 66.7 tonnes was applied in 2021, a decrease of 20 per cent from 2017 and 22 per cent from 2013 (Figure 8).
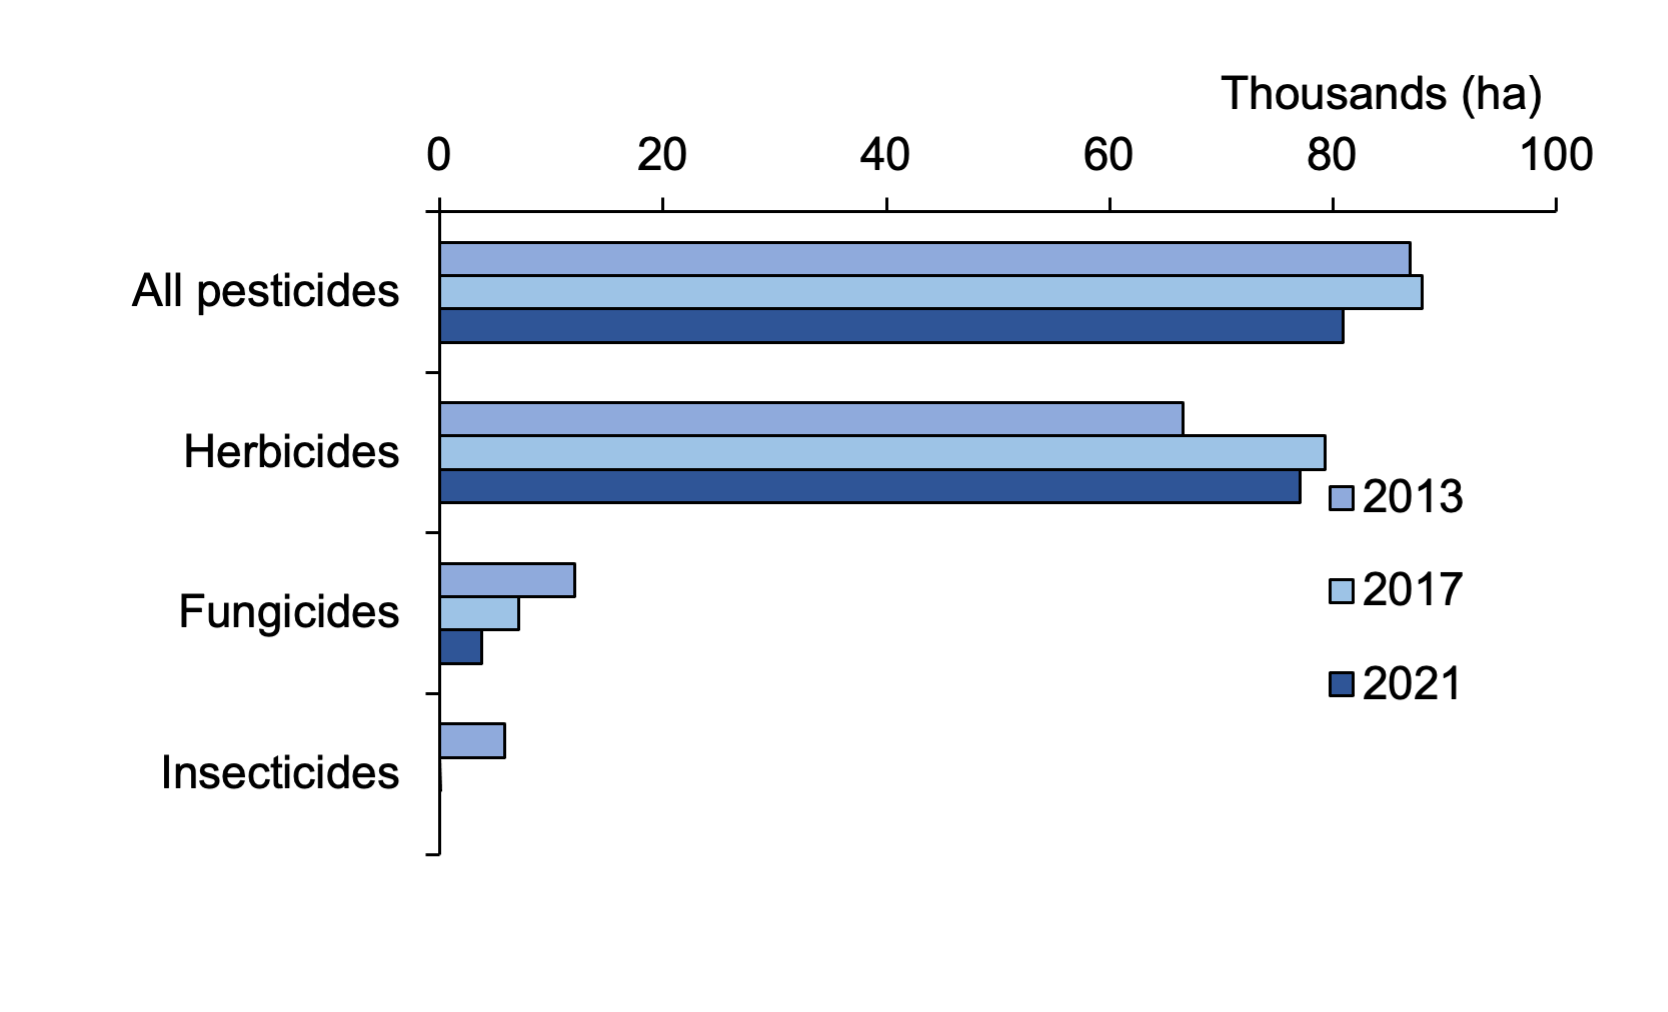
Note: seed treatments, growth regulators, molluscicides and sulphur have been excluded as they represent < 1,000 hectares. No seed treatment, growth regulator, molluscicide or insecticide use was recorded in 2021.
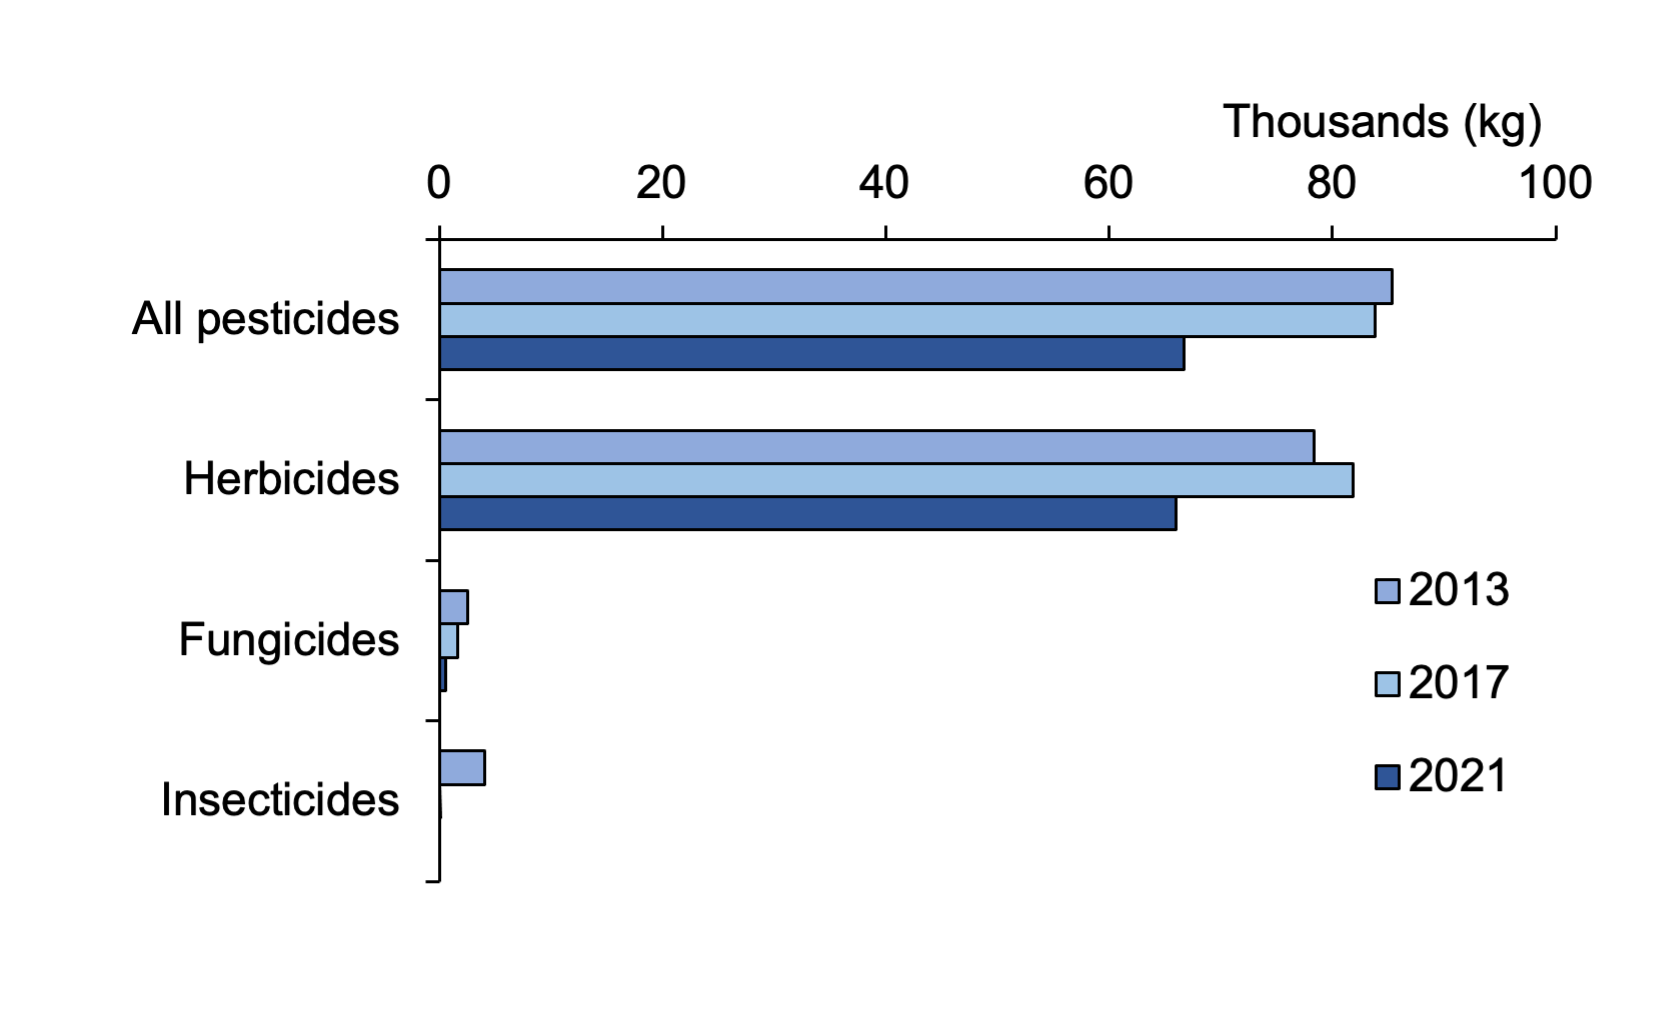
Note: seed treatments, growth regulators, molluscicides and sulphur have been excluded as they represent < 1,000 kg. No seed treatment, growth regulator, molluscicide or insecticide use was recorded in 2021.
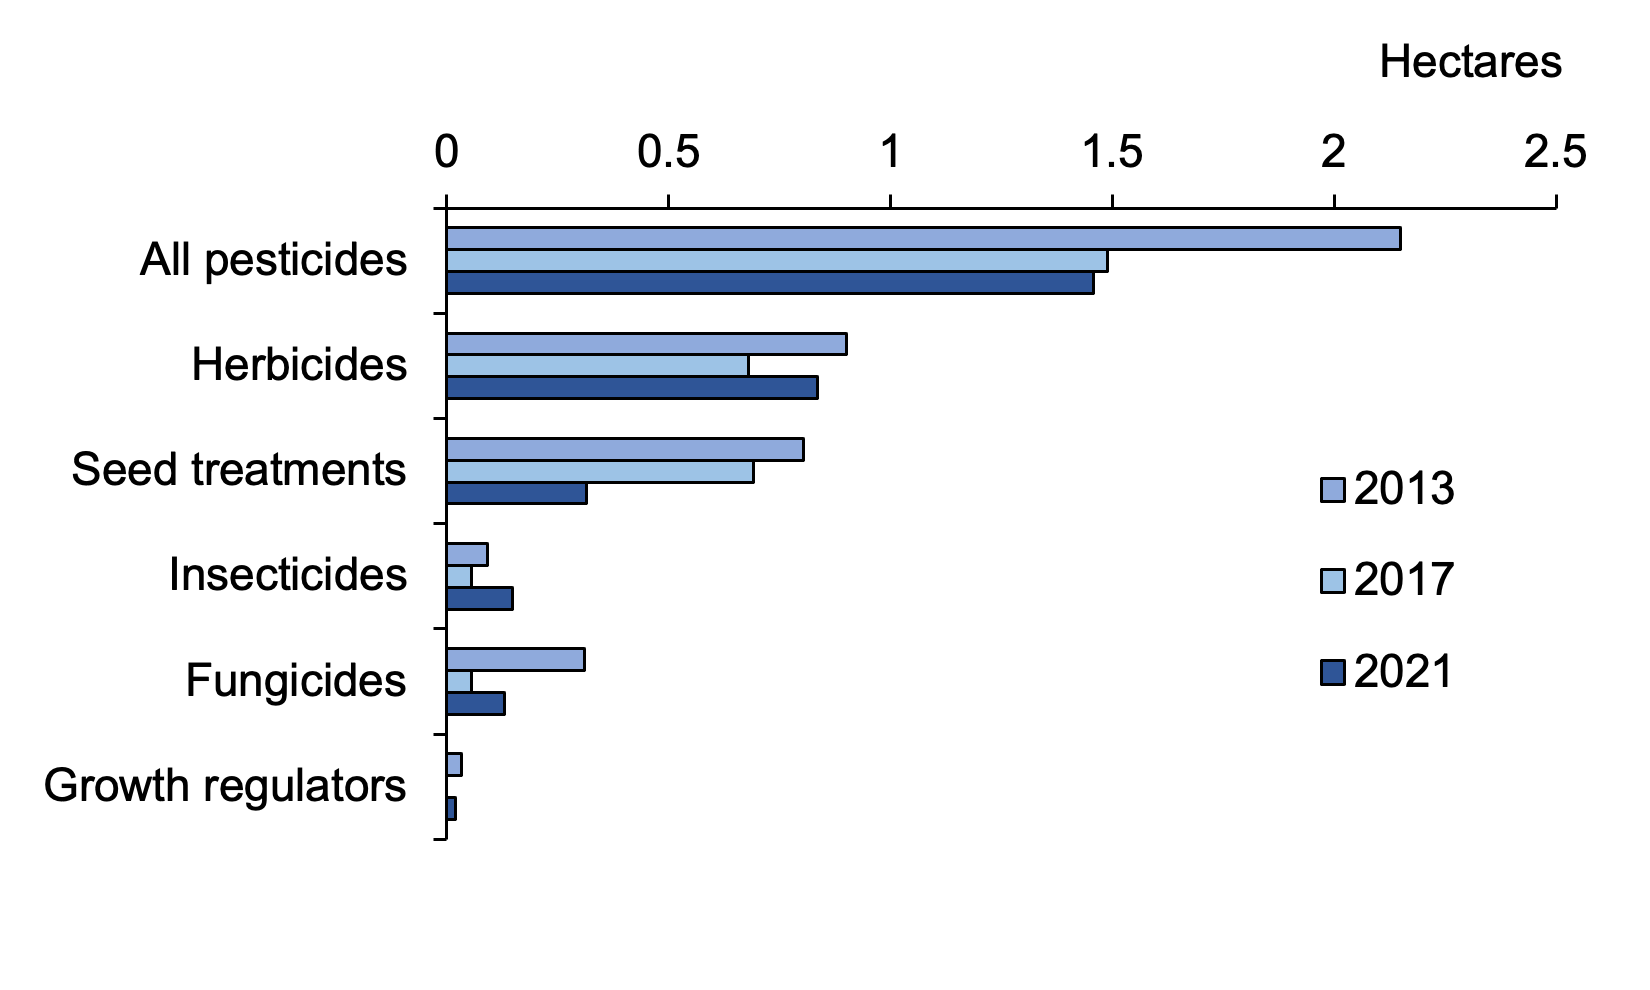
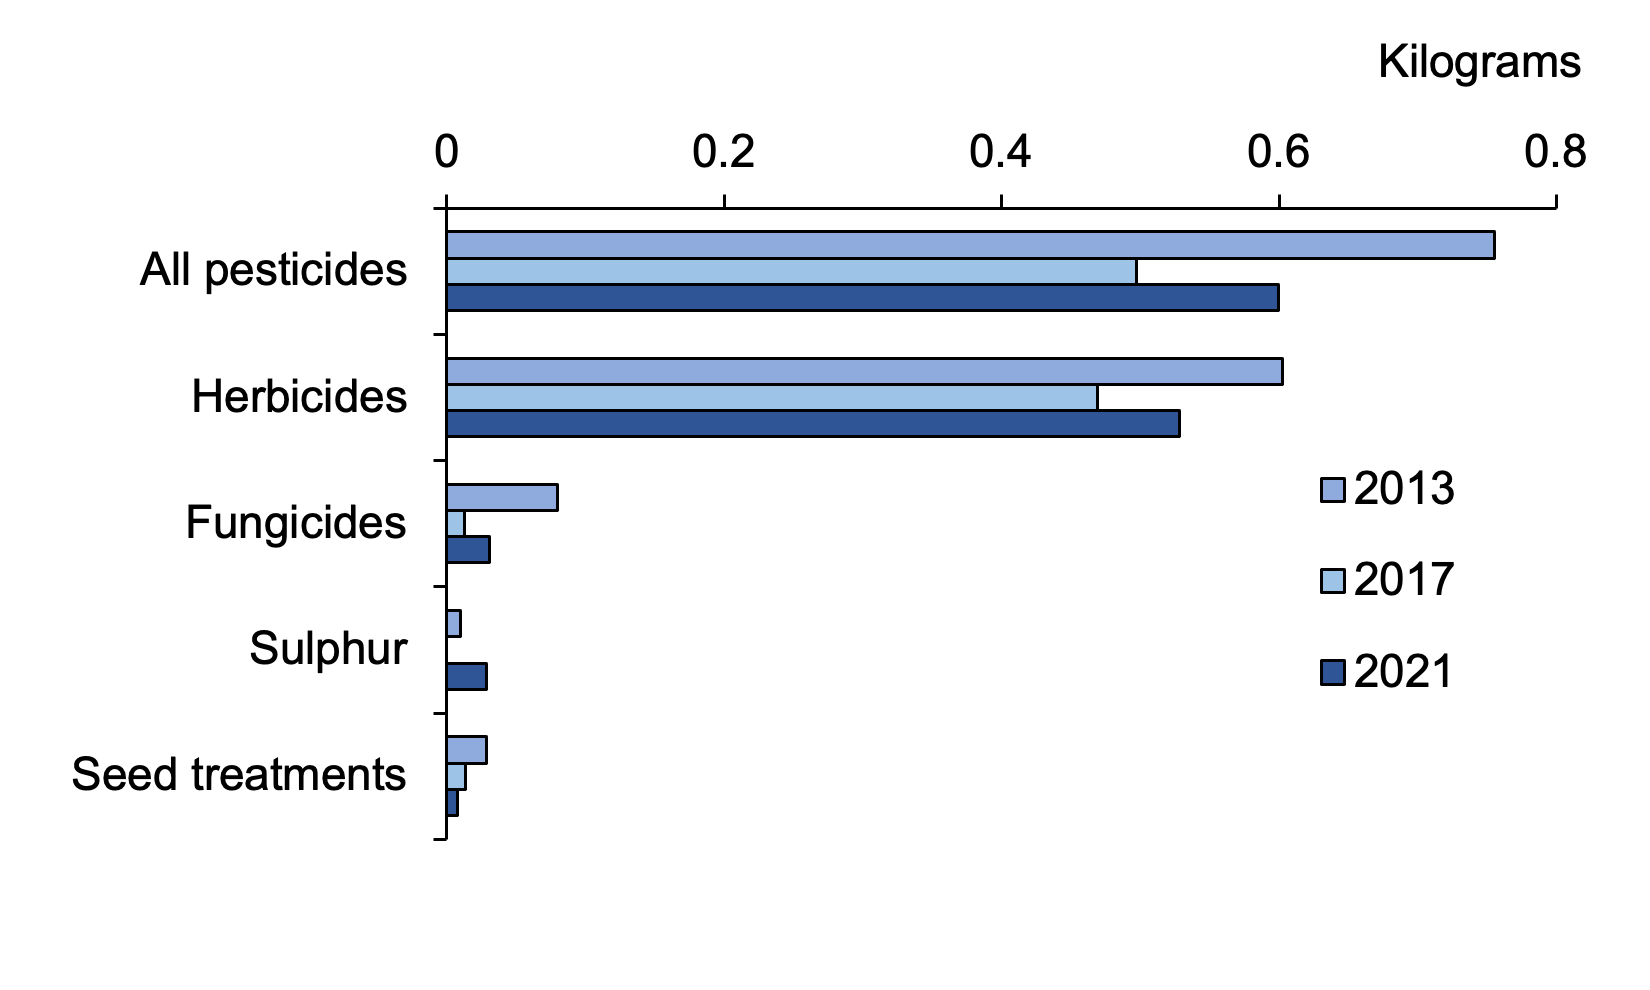
In order to make accurate comparisons between surveys, temporal differences in crop area must be taken into account. Therefore, the number of pesticide treated hectares and total weight of pesticide used per hectare of crop grown were calculated. When crop area is taken into account, there was a nine per cent decrease from 2017 to 2021 and a seven per cent decrease from 2013 to 2021 in terms of the total pesticide treated area of crop grown (Figure 9). Similarly, in terms of quantity of pesticides used per hectare of crop grown, there was a decrease of 21 per cent from 2017 to 2021 and a decrease of 22 per cent from 2013 to 2021 (Figure 10).
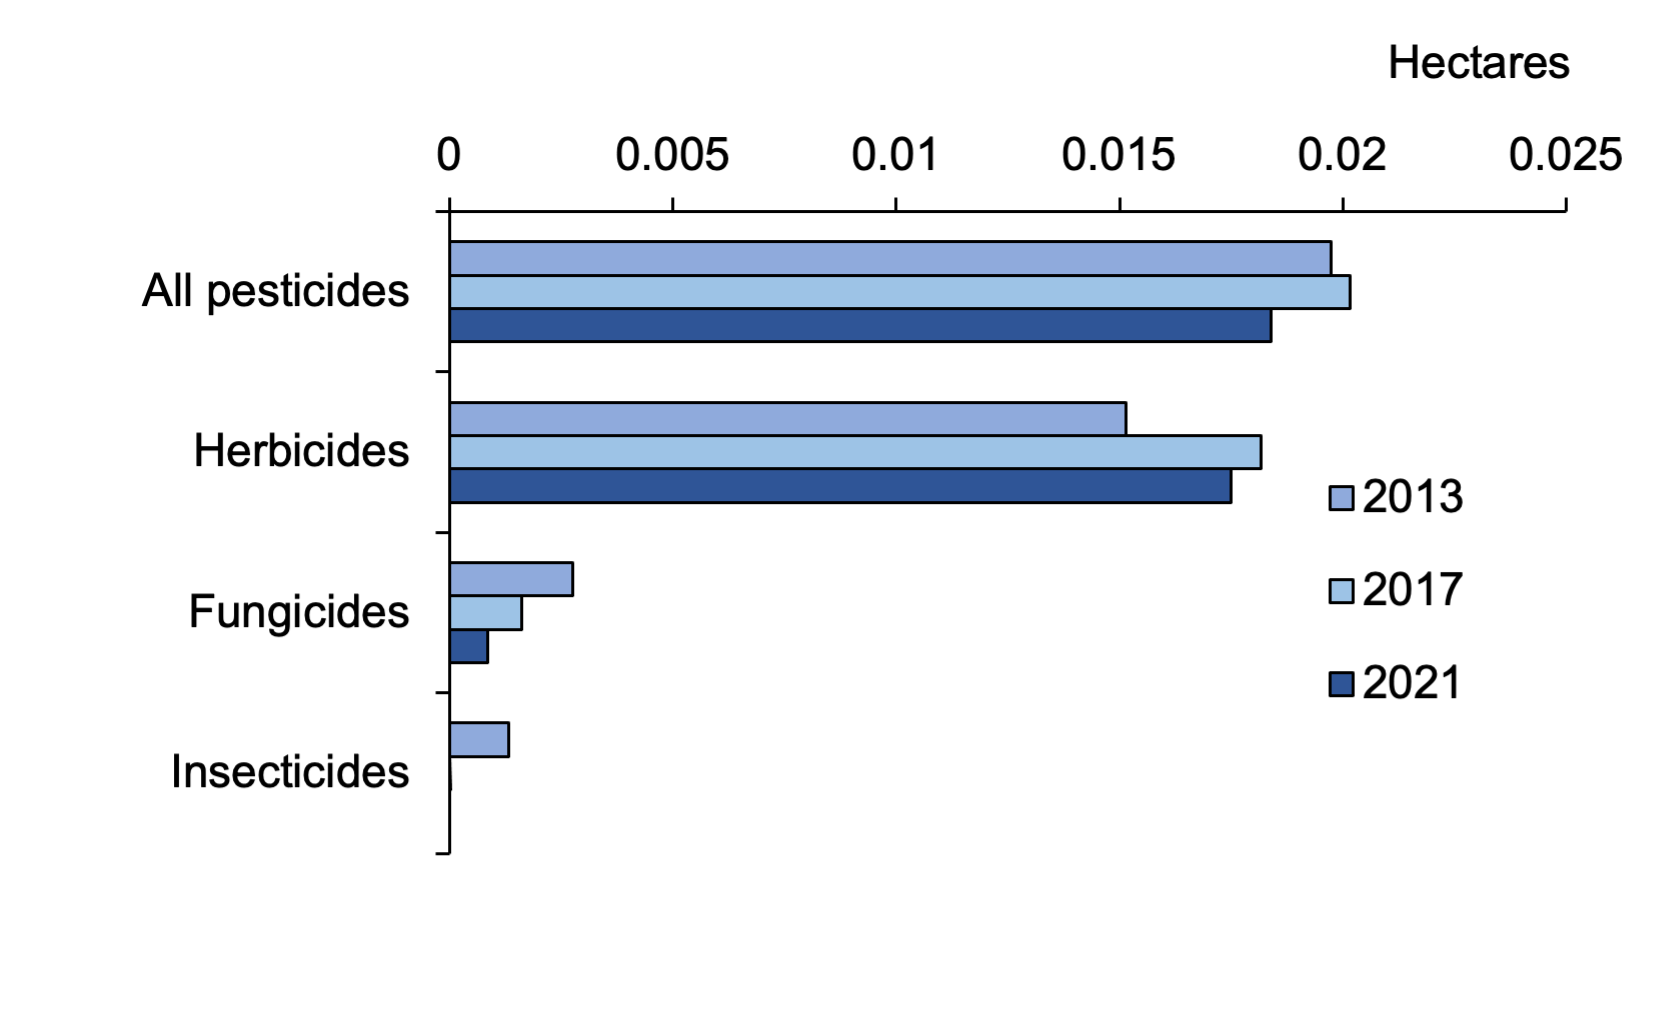
Note: seed treatments, growth regulators, molluscicides and sulphur have been excluded as they represent < 1,000 hectares. No seed treatment, growth regulator, molluscicide or insecticide use was recorded in 2021.
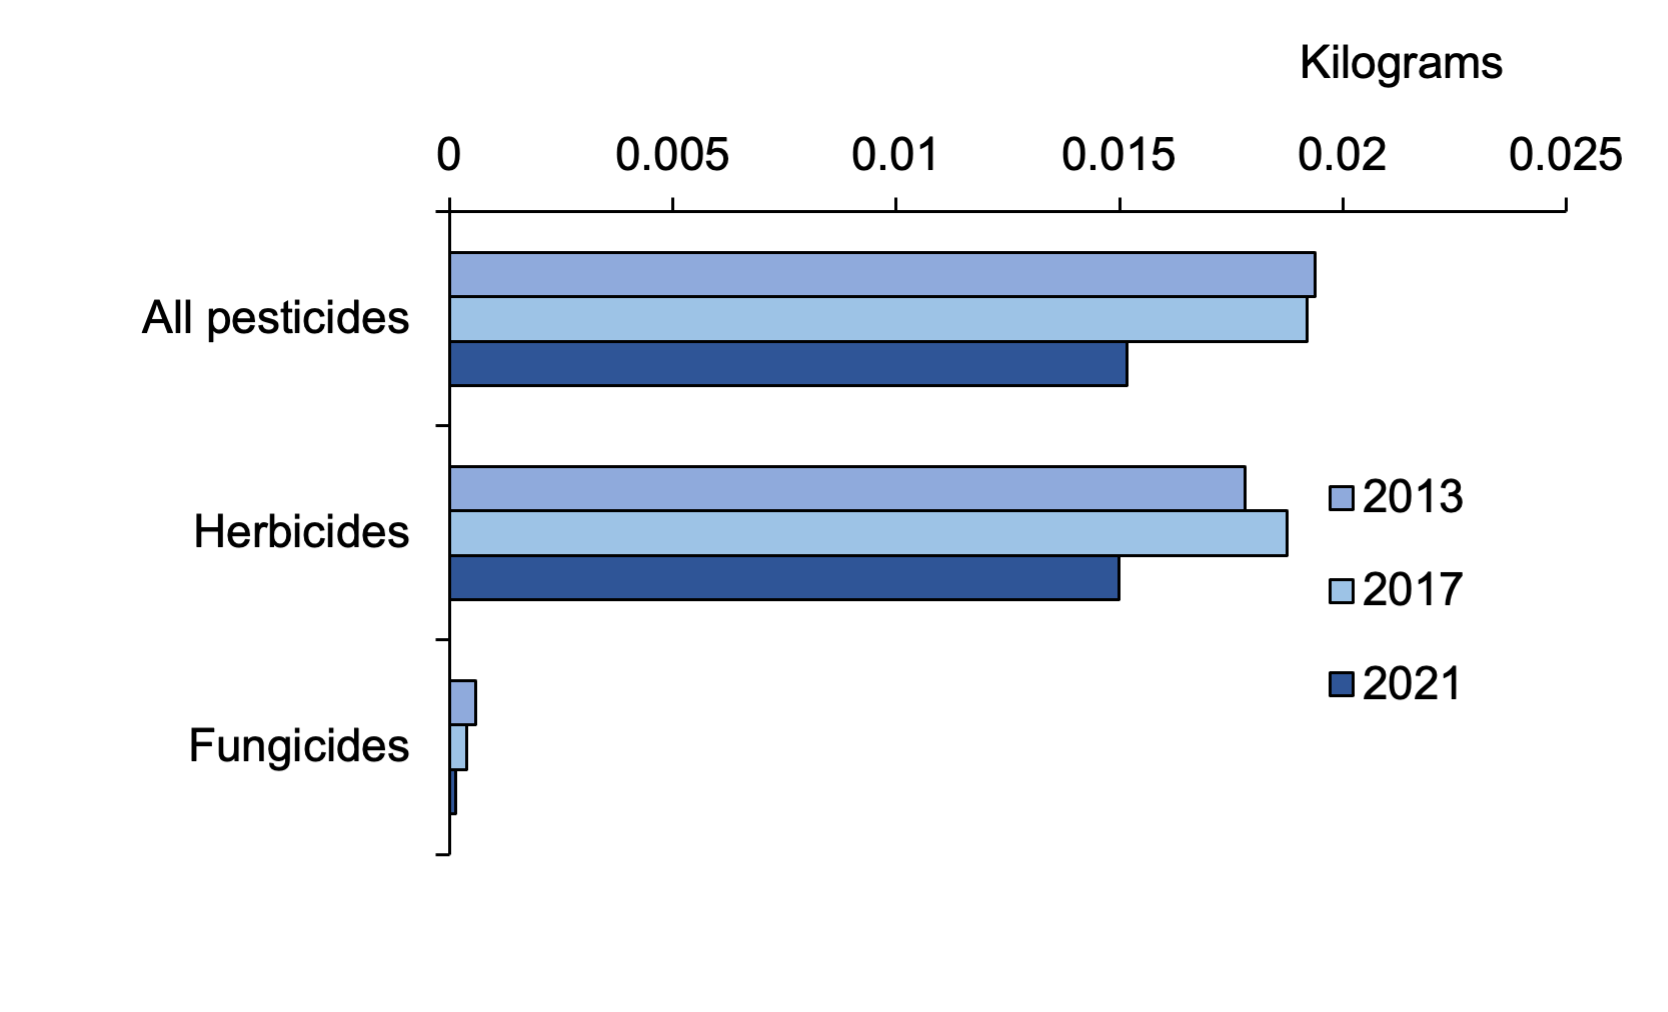
Note: insecticides, seed treatments, growth regulators, molluscicides and sulphur have been excluded as they represent < 0.0005 kg. No seed treatment, growth regulator, molluscicide or insecticide use was recorded in 2021.
As noted in the General trends, Crop area section of the report, the census grass area and, as a result, subsequent estimates of pesticide use, may have been influenced by changes in census definitions of temporary and permanent grass implemented between the 2013 and 2017 surveys, rather than wholly reflecting changes in land use (refer to Appendix 4), but have no impact on comparisons between the 2017 and 2021 surveys.
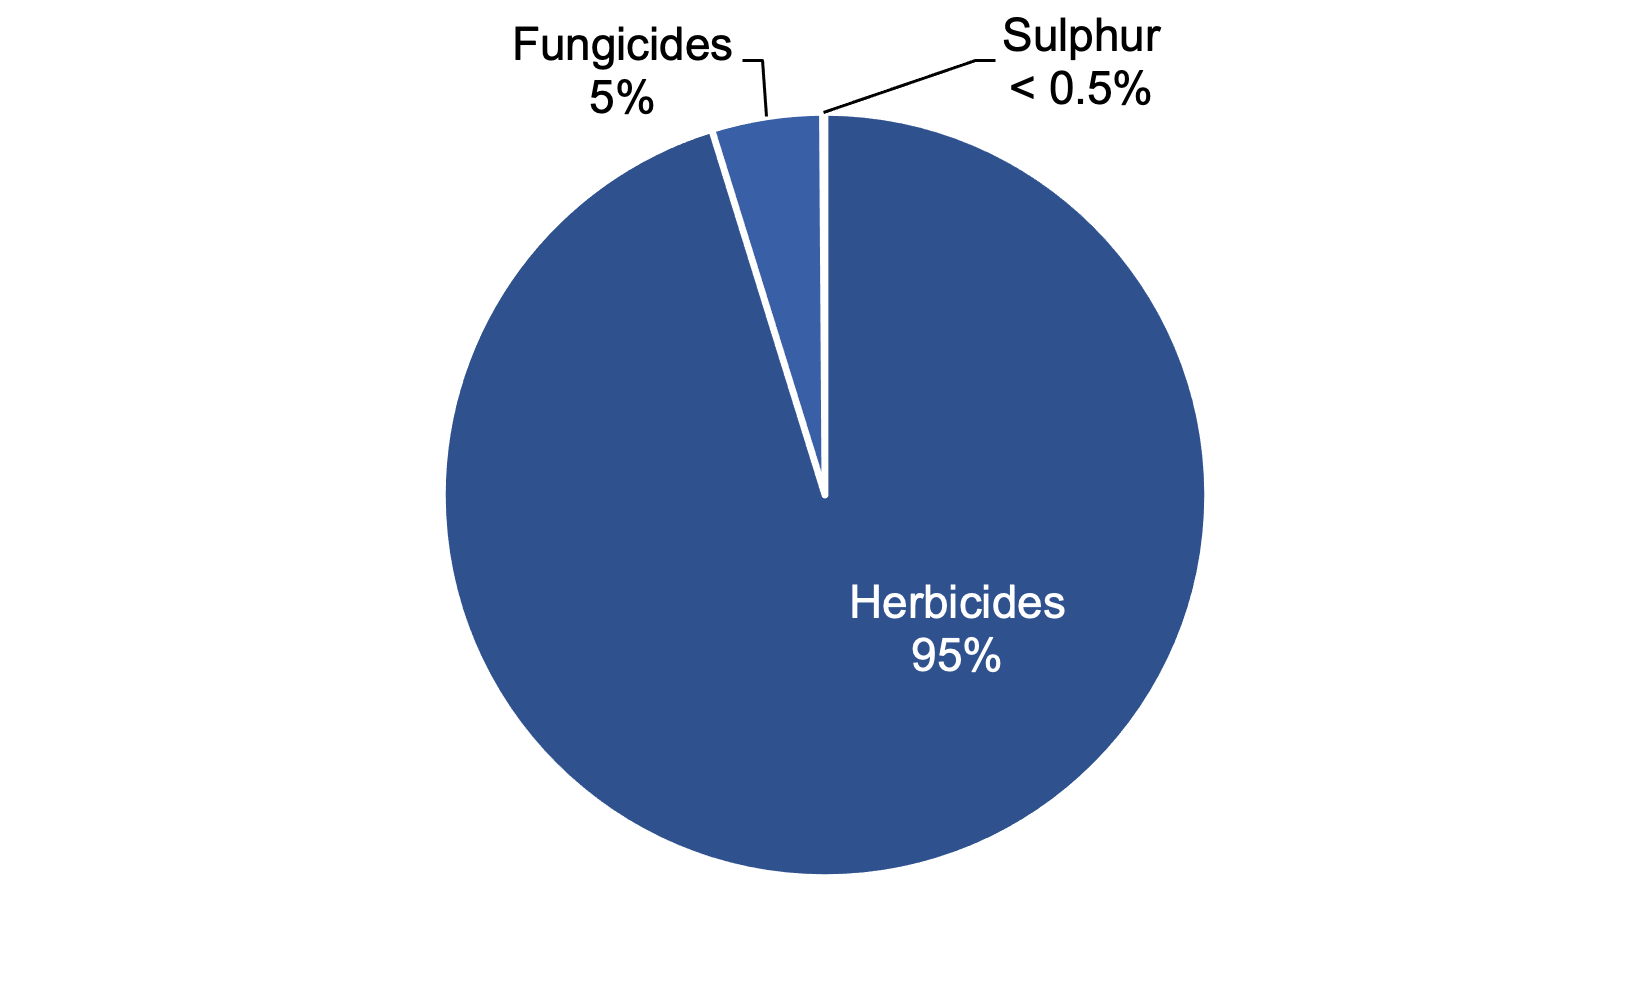
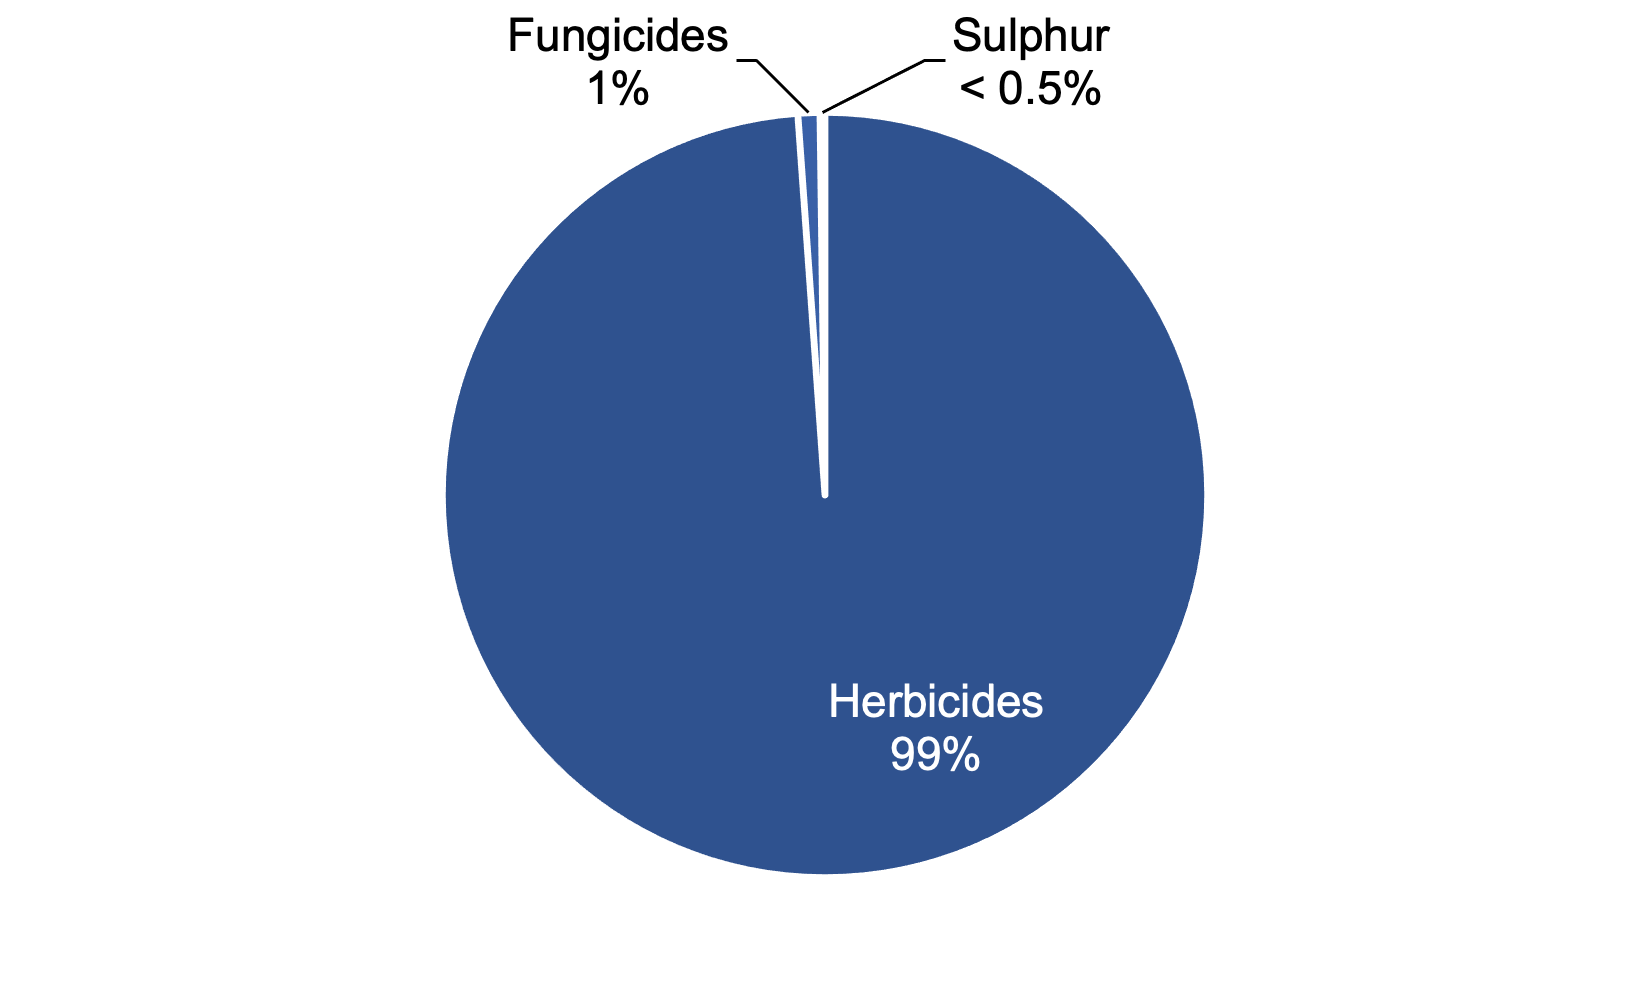
Herbicides were again the most commonly used pesticides on grassland and rough grazing in 2021, accounting for 95 per cent of the treated area and 99 per cent of total pesticide use by weight (Figures 11 & 12). The majority of herbicide use was on undersown and direct sown grass (34 per cent and 23 per cent of crop area treated respectively). Herbicides were the only type of pesticide applied to one to four year old grass, grass over five years old and rough grazing (Table 1). When changes in crop area are considered, there was a four per cent decrease in the area treated with herbicides from 2017 to 2021 and a 16 per cent increase in area treated from 2013 to 2021 (Figure 9). Accounting for changes in crop area, the weight of herbicide applied per hectare decreased by 20 per cent from 2017 and by 16 per cent from 2013 (Figure 10). The decrease in overall herbicide use between 2017 and 2021 may have been influenced by the 2021 sample. During the 2021 survey, only one holding applying asulam to a small area was encountered, therefore the asulam treated area and weight applied will be underestimated. This was a ground-based application and no aerial application was encountered. In the 2017 report it was estimated that 24,817 kg was applied to 6,028 ha. In comparison, in 2021 only 187 kg was estimated to have been applied to 42 ha. This is clearly an underestimate as the majority of asulam used in Scotland is applied by helicopter. Fera Science Ltd reported that 3,128 ha of bracken were treated with a total of 13,763 kg of asulam via aerial application in Scotland in 2021 (D. Garthwaite, FERA, pers. comm. Sep 2022), very similar to the 3,459 ha treated in 2017(5).
Note: no insecticides, molluscicides, growth regulators or seed treatments were recorded on grassland in 2021.
Note: no insecticides, molluscicides, growth regulators or seed treatments were recorded on grassland in 2021.
In 2021, fungicides accounted for just five per cent of the total pesticide treated area and one per cent of the total weight applied (Figures 11 & 12). Fungicides were only applied to undersown grass for the control or prevention of disease on the nurse crop. Thirty per cent of undersown grass was treated, with an average of 1.2 fungicide applications (Table 1). When changes in crop area are taken into account, the fungicide treated area decreased by 47 per cent from 2017 to 2021 and by 69 per cent from 2013 to 2021 (Figure 9). Accounting for changes in crop area, the weight of fungicides applied decreased by 63 per cent from 2017 and 75 per cent from 2013 (Figure 10). There was a fairly dry, cold spring in 2021 which resulted in many of the undersown grass crops being late drilled and thus late to emerge(6). These cold, dry conditions may have reduced disease pressure in the nurse crop and the requirement for fungicide sprays(7). In addition, the continued reduction in pesticide options may also have influenced use figures(8). Several of the key fungicide active substances used during 2013 and 2017 such as chlorothalonil, epoxiconazole and fenpropimorph have now been withdrawn and were unavailable in 2021.
No growth regulators were encountered during this survey. Growth regulators accounted for only one per cent of the total pesticide treated area and less than 0.5 per cent of the total weight of pesticides applied in 2017. Similarly, no pesticide seed treatments were encountered in 2021. In 2017 thiram was the only seed treatment active recorded, applied to five per cent of the direct sown grass area. Thiram was withdrawn in January 2020.
No insecticide use was recorded in 2021. This follows the substantial decrease in the use of insecticides on grass crops between 2013 and 2017 following the withdrawal of chlorpyrifos in 2016 (Figures 7 & 8). There are now no insecticides approved for leatherjacket control in grassland.
In 2021 no molluscicide use was recorded and sulphur accounted for less than 0.5 per cent of the total pesticide treated area (Figures 11 & 12). No molluscicides or sulphur were applied to grassland or rough grazing crops in 2017.
Pesticide usage – fodder crops
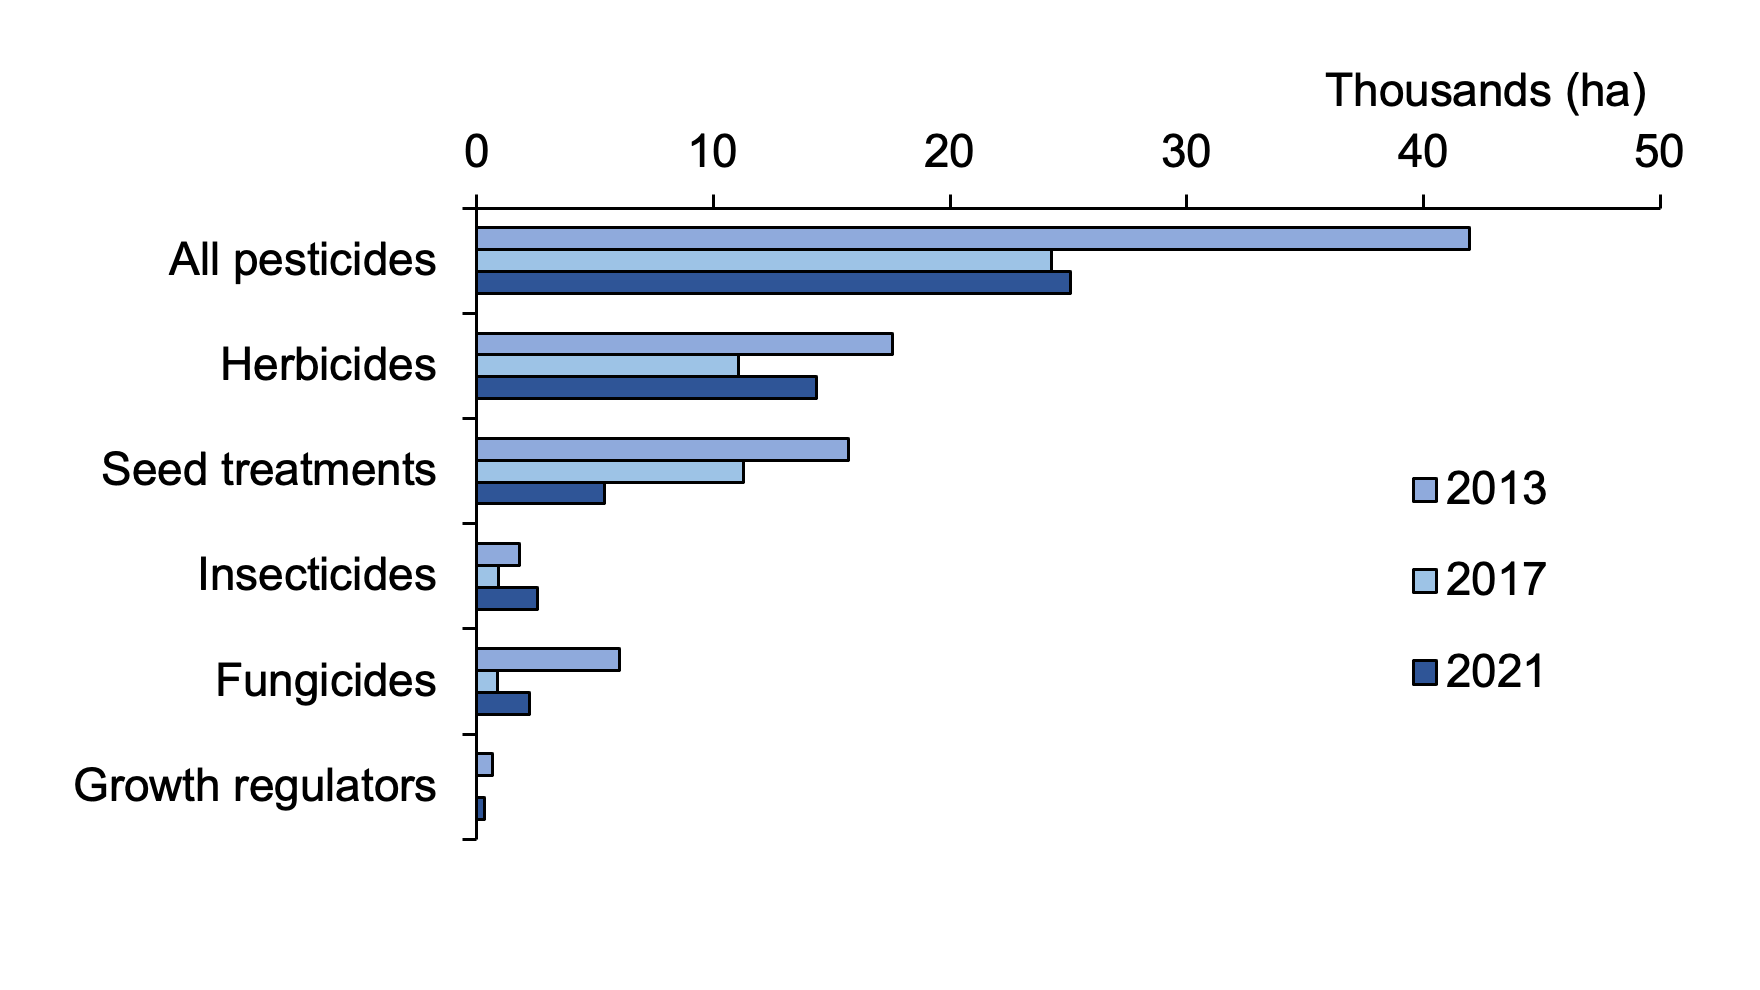
In contrast to pesticide use on grassland, an estimated 38 per cent of the total fodder crop was treated with a pesticide (Table 1). During the 2021 survey the area of fodder crops treated with a pesticide formulation was estimated to be ca. 25,100 hectares (Table 15 & Figure 13) and the total weight of pesticide applied ca. 10 tonnes (Figure 14). When crop area is accounted for, there was a decrease of two per cent in total area treated with pesticide formulations from 2017 to 2021 and a 32 per cent decrease from 2013 to 2021 (Figure 15). Weight of pesticide applied showed a 20 per cent increase from 2017 to 2021 and a 21 per cent decrease from 2013 to 2021 (Figure 16). The decrease in area treated but the increase in weight applied between 2017 and 2021 may have been influenced by the loss of seed treatment active substances and the subsequent increase in foliar fungicides and insecticides. Substituting foliar applications for seed treatments has a lower impact on area treated but a large impact on weight applied as seed treatments make a small contribution to overall weight of pesticide applied in comparison to foliar applications. It is also worth noting pesticide usage was low in 2017, influenced by the particularly dry spring, drier than 2021, so pest pressure was particularly low.
As in 2017, maize and fodder beet crops had the highest proportion of area treated with all crops encountered receiving at least one pesticide treatment (Table 1). The remaining fodder crops received a range of pesticide input, with 20 to 77 per cent of their crop area treated with pesticide, primarily herbicide.
Note: molluscicides and sulphur have been excluded as they represent < 500 hectares.
Note: insecticides, growth regulators and molluscicides have been excluded as they represent < 500kg.
Note: molluscicides and sulphur have been excluded as they represent < 0.02 treated hectares per hectare grown.
Note: insecticides, growth regulators and molluscicides have been excluded as they represent < 500kg.
Herbicides were the most commonly used pesticide, accounting for 57 per cent of the area treated (Figure 17) and 88 per cent of the total weight of pesticides applied (Figure 18). When changes in crop area were taken into account, there was a 23 per cent increase in area treated with herbicides from 2017 to 2021 (Figure 15) and a 13 per cent increase in weight (Figure 16). However, use in 2021 is seven per cent lower than 2013 in terms of area treated and 12 per cent lower in terms of weight applied. As noted previously, pesticide usage was low in 2017, influenced by the particularly dry spring followed by a very wet summer resulting in low weed pressure and low herbicide use. Crop composition may influence overall herbicide use. For example, the area of fodder beet and maize grown in Scotland increased by 95 and 55 per cent respectively between 2017 and 2021 and as mentioned before these crops had the highest proportion of area treated with a herbicide. Although the area of maize grown in 2021 was higher than in 2017, it was lower than in 2013.
Seed treatments accounted for 22 per cent of the total area treated and one per cent of the total weight of pesticide applied (Figures 17 & 18). When changes in crop area were taken into account, the area treated decreased by 54 per cent from 2017 to 2021 (Figure 15) and weight decreased by 42 per cent (Figure 16). Since the 2017 survey there has been a further reduction in approved seed treatments available, with the two principal seed treatments in 2017 (thiram and thiamethoxam) now withdrawn. This particularly has impacted turnips and swedes where 80 per cent of the crop received a seed treatment in 2017 compared to none of the crop in 2021.
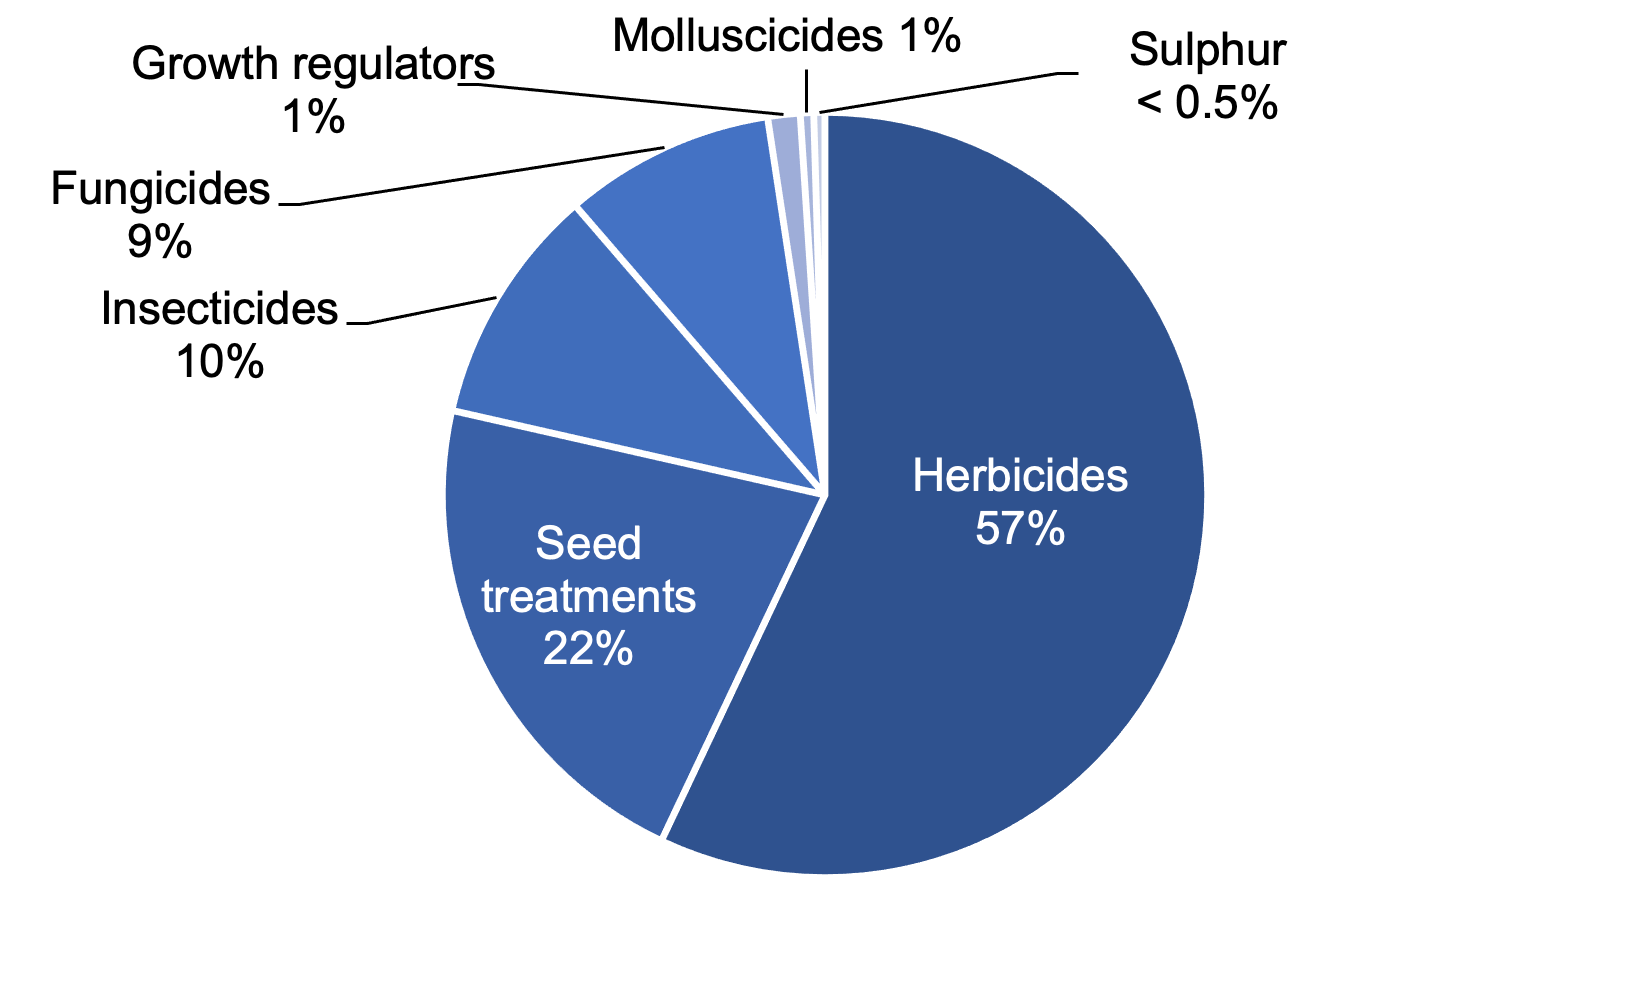
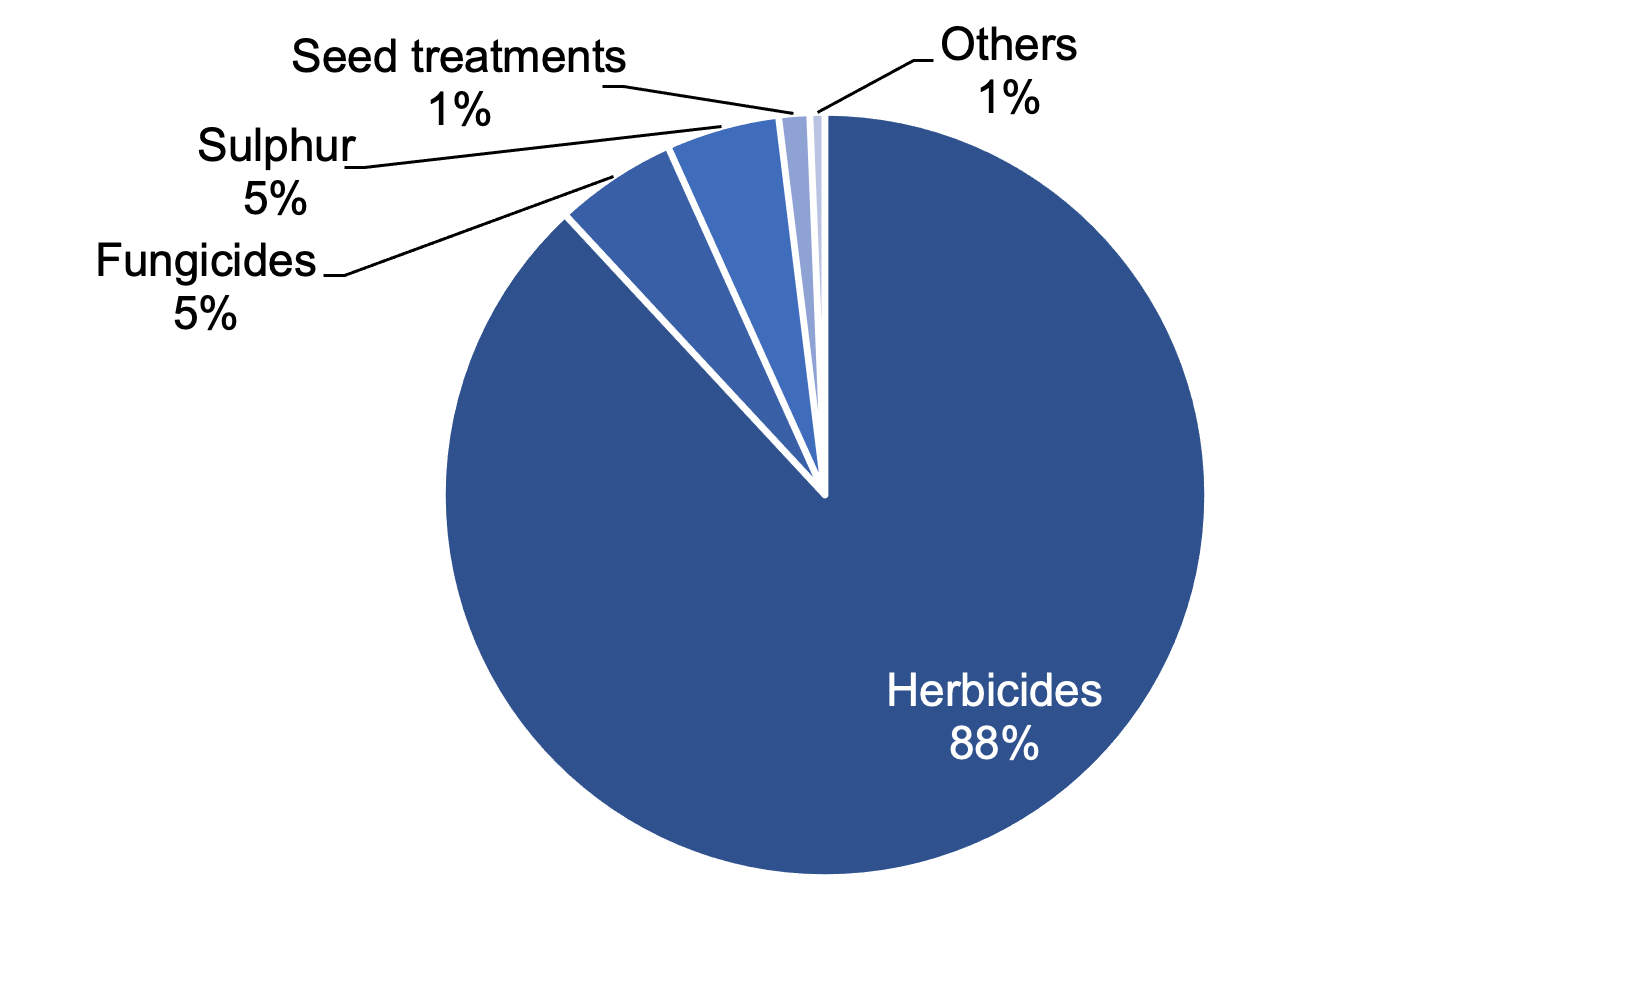
Note: others include: insecticides, growth regulators and molluscicides.
Fungicide use remained low in fodder crops, accounting for nine per cent of the total treated area and five per cent of the total weight of pesticides applied (Figures 17 & 18). When changes in crop area are considered, there was a 140 per cent increase in area treated from 2017 to 2021 (Figure 15) and a similar 142 per cent increase in weight (Figure 16). However, fungicide usage in 2021 was much lower than in 2013 in terms of both area treated and weight applied (58 per cent and 61 per cent decrease respectively). Loss of fungicide seed treatments such as thiram from the market since the previous survey and a subsequent increase on foliar sprays on crops such as arable silage and turnips and swedes may partly explain the large increase in the use of fungicides in 2021 compared with 2017. As noted previously, 2017 had an unusually dry spring with low disease pressure and thus low fungicide use.
Insecticide use remained low, accounting for 10 per cent of the total treated area and less than 0.5 per cent of the total weight of pesticides applied (Figures 17 & 18). When changes in crop area are taken into account, there was a 169 per cent increase in area treated between 2017 and 2021 (Figure 15) and a 230 per cent increase in weight (Figure 16). Most insecticidal sprays were applied to turnips and swedes for the control of flea beetle. The increase in foliar insecticide sprays may be partly due to the removal of neonicotinoid seed treatments since 2017 which were used to control the pest. Ninety-five percent of all insecticides encountered in 2021 were pyrethroids, with flonicamid use on fodder beet the only non-pyrethroid recorded (Table 11).
Molluscicides accounted for less than one per cent of both pesticide treated area and weight (Figures 17 & 18). When changes in crop area are taken into account, there was a four per cent decrease in area treated from 2017 to 2021 (Figure 15) and a 44 per cent decrease in weight (Figure 16). Ferric phosphate was the only molluscicide recorded in 2021. Metaldehyde had been the only molluscicide recorded in 2017 and 2013 but sales of this active substance stopped from 31st of March 2021 prior to its final use date in March 2022.
Growth regulators accounted for one per cent of area treated and less than 0.5 per cent of weight applied in 2021 (Figure 17 &18). No growth regulators or sulphur were applied to fodder crops in 2017.
General trends in active substances encountered – grass & fodder crops
The most commonly used pesticides in grass and fodder crops are herbicides. In terms of area treated, the same three herbicide active substances, fluroxypyr, triclopyr and MCPA, were the most used in 2021 and 2017 (Table 14), although use has increased by nine, 14 and six per cent respectively. These three active substances were also in the top five most commonly used herbicides in the 2013 survey. In relation to weight, the most used actives were the herbicides, MCPA, 2,4-D and glyphosate (Table 15). MCPA showed a decrease of 12 per cent in 2021, however 2,4-D and glyphosate use both increased since the previous survey (by 176 and 53 per cent respectively).
Other notable changes in herbicide active substance use since the previous survey include increases in the use of dicamba, metamitron, amidosulfuron and florasulam. These increased in terms of area treated by 105, 114, 104 and 148 per cent respectively (448, 91, 78, 149 per cent increase in weight applied respectively). In contrast the use of 2,4-DB decreased by 94 per cent in both area and weight. The use of asulam also significantly decreased (99 per cent decrease by area treated and weight applied). As discussed previously, this has been influenced by the infrequency of aerial spraying encountered in the 2021 sample.
As in both 2013 and 2017, the most used foliar fungicide active substance by area in this survey was prothioconazole. It is worth noting that the area of the multi-site fungicide folpet increased substantially between 2017 and 2021 (750 per cent increase by area treated and 937 per cent by weight) following the loss of the multi-site fungicide chlorothalonil in May 2020. The most used seed treatment active substance was prothioconazole. The most commonly used insecticide in terms of area treated in the 2021 survey was deltamethrin, in 2017 the most commonly used was lambda-cyhalothrin.
The herbicides halauxifen-methyl, mesosulfuron-methyl and napropamide, the fungicides benzovindiflupyr and mefentrifluconazole and the insecticide flonicamid were recorded for the first time in grass and fodder crops in 2021 (Table 10). Two seed treatments, sedaxane and ziram were recorded for the first time in this survey. It should be noted that ziram was present on imported maize. Although ziram has no authorisation in the UK, imported seed treated with a plant protection product authorised for that use in EU countries were allowed at the time of use(9).
Integrated Pest Management
Information about the uptake of IPM measures by Scottish growers was collected alongside the 2021 grass and fodder crops pesticide usage survey. This 2021 IPM survey represents the second in the series of surveys of IPM measures on grass and fodder crops, allowing the adoption of IPM techniques to be monitored. This is a summary of the data; please refer to Appendix 6 for the full dataset. Growers were asked a series of questions about the IPM activities that they implemented for grass and fodder crop production. Unlike the other statistics in this report, the figures relating to IPM are not raised to produce national estimates but represent only the responses of those surveyed.
In total, IPM data was collected from 158 growers, collectively representing 163 holdings and 13 per cent of Scotland's 2021 grass and fodder crop area. Of these growers, 24 per cent had an IPM plan (13 per cent completed their own IPM plan and 11 per cent had a plan completed by their agronomist) (Figure 38). There was very strong evidence for an increase in the use of IPM plans from the 2017 survey where five per cent of growers had an IPM plan (p-value ≤ 0.001). Since 2017 there has been increased focus on the promotion of IPM and the introduction of mandatory completion of IPM plans within some key quality assurance schemes to help growers make the best possible and most sustainable use of all available methods of pest control. Growers were asked about their IPM activities is relation to three categories; risk management, pest monitoring and pest control.
In 2021, all growers sampled reported that they implemented at least one IPM risk management activity (Table 30). There was very strong evidence for an increase in the proportion of growers reporting the use of catch and cover cropping (p-value ≤ 0.001), and strong evidence for an increase in the proportion of growers reporting the use of varietal or seed choice to reduce pest risk (p-value ≤ 0.01) and through protection or enhancement of beneficial organism populations (p-value ≤ 0.01). There was some evidence for an increase in the proportion of growers implementing crop rotation (p-value ≤ 0.05).
In terms of the uptake of pest monitoring activities, there was strong evidence for an increase in the proportion of growers conducting pest monitoring activity (p-value ≤ 0.01) (Table 31), primarily due to strong evidence for an increase in the proportion of growers setting action thresholds for crops (p-value ≤ 0.01).
All growers responding in 2021 adopted as least one IPM pest control activity, a slight increase from 2017 (p-value > 0.05). There was very strong evidence for a decrease in the proportion of growers following anti-resistance strategies (p-value ≤ 0.001), and strong evidence for a decrease in the proportion of growers reporting targeted pesticide application (p-value ≤ 0.001) (Table 32). There was no evidence of a change in the portion of growers using non-chemical control in partnership or instead of chemical control or monitoring success of crop protection measures. Of the holdings sampled in 2021, eight per cent were organic, an increase from four per cent reported in 2017.
Contact
Email: psu@sasa.gov.scot