Ocean literacy survey: headline findings
Headline findings from an online survey with the public in Scotland on the topic of ocean literacy - exploring the public's understanding of the marine environment. It is part of a wider project covering England and Wales.
Lifestyle impacts & changes
Overall, 50% thought their lifestyle has an impact on the marine environment. A slightly higher proportion thought that their lifestyle has a positive impact (27%) compared to a negative impact (23%) (Figure 18).
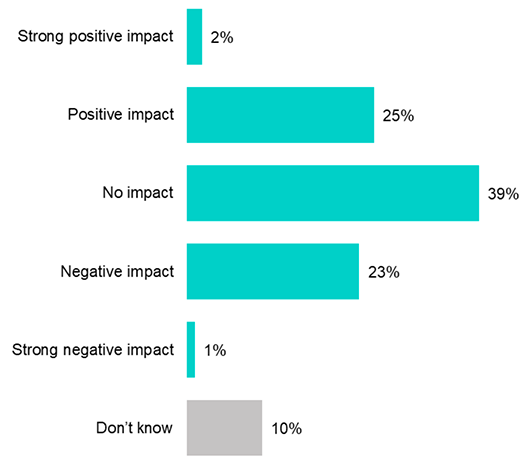
Q17: What impact do you think your lifestyle has on the marine environment of Scotland?
Unweighted base: 3,055
Dimensions
- Activism
- Behaviour
- Attitudes
- Knowledge
- Awareness
Twenty-seven percent said they've already made changes but plan on doing more, whilst 44% said it's quite or very likely they will make changes. 8% said they've already made changes but don't plan on doing any more. Only 13% said they won't or don't think they will make changes to their current lifestyle within the next 12 months in order to protect the marine environment in Scotland (Figure 19).
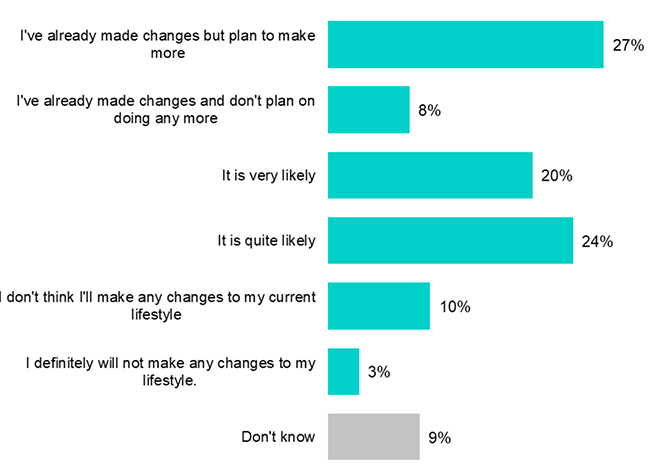
Q22: Within the next 12 months, do you plan on making changes to your lifestyle to protect the marine environment in Scotland?
Unweighted base: 3,055
Dimensions
- Activism
- Behaviour
- Attitudes
- Knowledge
- Awareness
The top reasons for making or planning lifestyle changes (Figure 20) were concern over climate change (67%), desire to be greener (63%), desire to care and protect (59%), concerns about impacts on the marine environment (58%) and worry about future generations (57%).
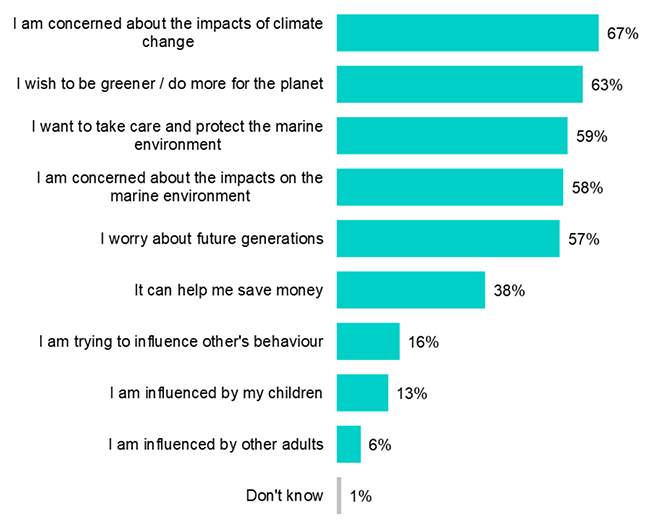
Q24: [Where likely to make changes to lifestyle to protect the marine environment] Is this because?
Unweighted base: 3,055
Dimensions
- Activism
- Behaviour
- Attitudes
- Knowledge
- Awareness
In contrast, the top reason for not making lifestyle changes (Figure 21) was already doing as much as possible (38%) followed by it being too expensive (29%) and thinking it would not have an impact (27%).
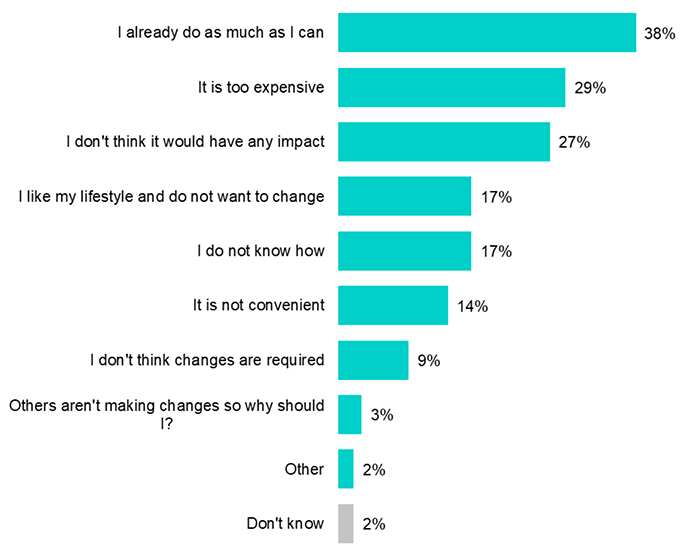
Q23: [Where unlikely to make changes to lifestyle to protect the marine environment] Is this because?
Unweighted base: 3,055
Dimensions
- Activism
- Behaviour
- Attitudes
- Knowledge
- Awareness
Contact
Email: socialresearch@gov.scot