NHSSCOTLAND STAFF SURVEY 2014 National Report
This National Report provides an overview of the results of the 2014 NHSScotland Staff Survey. The National Staff Survey gives all NHSScotland staff the opportunity to provide feedback on their experience of working for the organisation.
6 Key findings
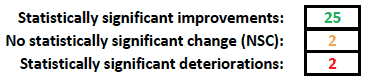
For 26 of the 29 top-level questions (asked of all respondents), the results show an improvement in the proportion of staff giving a positive response compared to the 2013 survey results (the improvement is found to statistically significant for 25 of these 26 questions) and there was no change in the result for one other top-level question. Similarly, all but one of the fourteen sub-questions showed an improvement or no change in the proportion giving a positive response.
The average percentage point increases of positive responses have been calculated for questions using the standard five-point scale in each of the five Staff Governance Standard strands, and for the questions relating to overall experience of working for NHSScotland. It can be seen that the average percentage point increase for two strands is five percentage points or more:
- staff should be well informed; and
- treated fairly and consistently, with dignity and respect, in an environment where diversity is valued.
The average percentage point increase for questions relating to the overall experience of working for NHSScotland was more than five percentage points between 2013 and 2014.
Average improvement in experience under Staff Governance Strands (2013-14)
")
On the following pages, tables present the five most positive perceptions from the 2014 survey (Table 1) and the five least positive perceptions (Table 2).
In most cases where the combined positive responses (e.g. strongly agree and agree) have increased, the combined negative responses (e.g. strongly disagree and agree) have decreased. However, the percentage changes between positive and negative responses may not be equal as a neutral response was also included in the questions/statements response range.
6.1 Five most positive perceptions in 2014
The question receiving the most positive responses in the 2014 survey was Q6-3 I am happy to go the 'extra mile' at work when required. Overall, 90% of respondents strongly agreed or agreed with this statement, compared with 87% in 2013, 3% strongly disagreed or disagreed, whilst 7% indicated a neutral response. Positive responses to this question ranged between 85% and 93% for the vast majority of Health Boards.
Of the five most positive perceptions (attitudinal questions), the question showing the largest improvement since 2013 was Q1-5 I understand how my work fits into the overall aims of [Health Board]; the overall positive response for this question was 78%, compared with 66% in 2013.
For Q6-5 I still intend to be working with [Health Board] in 12 months time, 79% of respondents gave a positive response, compared with 75% in 2013. Positive responses by individual organisations ranged between 59% and 86%.
Table 1: The 5 most positive perceptions and their percentage increases on combined positive responses comparing 2013 and 2014 (combined negative responses also shown for completeness)
| Question Number |
Question |
Positive Response % (change on 2013 shown in brackets) |
Negative Response % (change on 2013 shown in brackets) |
||
|---|---|---|---|---|---|
| 6-3 |
I am happy to go the 'extra mile' at work when required |
90% |
(+3%) |
3% |
(-2%) |
| 1-4 |
I am clear what my duties and responsibilities are |
86% |
(+2%) |
2% |
(-1%) |
| 4-2 |
I get the help and support I need from colleagues |
79% |
(+3%) |
6% |
(-1%) |
| 6-5 |
I still intend to be working with [Health Board]* in 12 months time |
79% |
(+4%) |
7% |
(-1%) |
| 1-5 |
I understand how my work fits into the overall aims of [Health Board] * |
78% |
(+12%) |
5% |
(-5%) |
Positive and negative responses are based on combining all relevant responses on the five point response scale.
* The appropriate Health Board name was inserted in questions shown in this report with [Health Board].
This convention is used throughout this report, where questions were tailored with the appropriate Health Board name.
6.2 Five least positive perceptions in 2014
The question receiving the least positive responses in the 2014 survey was Q3-1 Staff are always consulted about changes at work. Overall, 29% of respondents strongly agreed or agreed with this statement, compared with 26% in 2013. Almost half, 46% strongly disagreed or disagreed, whilst 25% indicated a neutral response. Positive responses to this question ranged between 16% and 51%.
For Q5-2 There are enough staff for me to do my job properly, 33% of respondents gave a positive response, compared with 31% in 2013. Positive responses by individual organisations ranged between 21% and 52%.
All of the five least positive perceptions (attitudinal questions) showed an improvement over their 2013 result.
Table 2: The 5 least positive perceptions and their percentage increases on combined positive responses comparing 2013 and 2014 (combined negative responses also shown for completeness)
| Question Number |
Question |
Positive Response % (change on 2013 shown in brackets) |
Negative Response % (change on 2013 shown in brackets) |
||
|---|---|---|---|---|---|
| 3.1 |
Staff are always consulted about changes at work |
29% |
(+3%) |
46% |
(-4%) |
| 5.2 |
There are enough staff for me to do my job properly |
33% |
(+2%) |
46% |
(-1%) |
| 3.4 |
I have a choice in deciding what I do at work |
40% |
(+2%) |
24% |
(-4%) |
| 1.3 |
When changes are made at work, I am clear how they will work out in practice |
41% |
(+2%) |
30% |
(-2%) |
| 3.3 |
I am confident my ideas or suggestions would be listened to |
42% |
(+5%) |
30% |
(-5%) |
Positive and negative responses are based on combining all relevant responses on the five point response scale.
6.3 Summary results by Staff Governance Standard
Summarised below are the main survey findings in relation to each of the five strands of the Staff Governance Standard and the overall experience of working for NHSScotland.
Well informed
There were five questions/statements in this section of the survey: all of which showed improvements (compared with 2013) in both positive and negative perceptions for this strand of the Staff Governance Standard.
The most positive perception within this strand was for Q1-4 I am clear what my duties and responsibilities are: 86% of respondents strongly agreed or agreed with this statement. The most improved positive response was for Q1-5 I understand how my work fits into the overall aims of my Health Board - 78% responded positively compared with 66% in 2013.
Appropriately trained and developed
There is a 2 percentage point increase in staff indicating they have had a KSF development review, performance review, appraisal, Personal Development Plan meeting or equivalent (i.e.75% compared with 73% in 2013).
Staff who had participated in a review within the last year were asked a small number of additional sub-questions, each of which showed an overall increase in positive responses. The largest of these increases since 2013 was the proportion of staff who said it had helped them to improve how they did their job, a 4 percentage point increase, to 43%.
Some 84% of those staff who had had a review said they had agreed a Personal Development Plan (PDP) or equivalent. Of those with a PDP, 77% indicated they have received, or expect to receive, the training that was identified in that plan.
Involved in decisions
All question/statement responses within this Staff Governance Standard strand of the survey improved by between 3 and 5 percentage points since 2013.
The least positive perception for this strand was for Q3-1 staff are always consulted about changes at work (29%). Some 54% agreed that they have sufficient opportunities to put forward new ideas or suggestions for improvement in their workplace.
Treated fairly and consistently, with dignity and respect in an environment where diversity is valued
The largest improvement to a question/statement in the overall staff survey is found under this strand. Three fifths (59%) of staff had a positive response to Q4-3 [Health Board] acts fairly and offers equality of opportunity with regard to career progression/promotion, compared to 44% in 2013 (a 15 percentage point increase).
The percentage of staff saying they have experienced unfair discrimination from their manager in the last 12 months has seen a positive change from 8% in 2013 to 6% in 2014, and similarly from 8% to 7% for experience of unfair discrimination from other colleagues.
Provided with a continuously improving and safe working environment promoting health and wellbeing of staff, patients and the wider community
For this strand, all of the questions/statements on the five-point scale show a trend to more positive responses, as do most of the factual questions.
Agreement by staff with Q5-3 I believe it is safe to speak up and challenge the way things are done
if I have concerns about quality, negligence or wrongdoing by staff increased by five percentage points, in 2014 57% of staff agreed with this statement.
The only exception to this trend of increase was for the factual question Q5-4 Have you had any health and safety training paid for or provided by [Health Board]? e.g. Fire training, manual handling etc, which shows a fall of one percentage point between the years.
In 2013, 11% of staff said they had experienced bullying/harassment from their manager, but in 2014 this shows a positive change in the percentage at 9%. The percentage of staff indicating they have experienced harassment or bullying from their colleagues is 15%.
Overall experience of working for NHSScotland
The questions/statements in this section of the survey all showed more positive responses than in 2013, with two of the largest changes between the years found in this section.
Respondents' perception relating to the Care of patients/service users being a top priority showed an increase of 12 percentage points i.e. to 67% from 55% in 2013.
The percentage of staff who responded positively to Q6-4 I would recommend my workplace as a good place to work also saw a change from 51% in 2013 to 61% in 2014. However, it should be noted this question changed slightly between the years, with 'workplace' replacing the word 'Board'.
Around 90% of respondents indicated they are happy to go 'the extra mile' at work when required and 79% still intend to be working with their Health Board in 12 months time.
6.4 Main changes: 2013 to 2014
For 26 of the 29 top-level questions (asked of all respondents), the results show an improvement in the proportion of staff giving a positive response compared to the 2013 survey results (the improvement is found to statistically significant for 25 of these 26 questions) and there was no change in the result for one other top-level question. Similarly, all but one of the fourteen sub-questions showed an improvement or no change in the proportion giving a positive response. The biggest improvement related to the perception of whether their Board acts fairly and offers equality of opportunity with regard to career progression/promotion showing a 15 percentage point increase in positive response.
Table 3: Table of largest percentage increases on combined positive responses comparing 2013 and 2014 (combined negative responses also shown for completeness)
| Question Number |
Question |
Positive Response % (change on 2013 shown in brackets) |
Negative Response % (change on2013 shown in brackets) |
||
|---|---|---|---|---|---|
| 4-3 |
[Health Board] acts fairly and offers equality of opportunity with regard to career progression/promotion |
59% |
(+15%) |
15% |
(-5%) |
| 6-1 |
Care of patients/service users is [Health Board] top priority |
67% |
(+12%) |
15% |
(-4%) |
| 1-5 |
I understand how my work fits into the overall aims of [Health Board] |
78% |
(+12%) |
5% |
(-5%) |
| 6-4 |
I would recommend my workplace as a good place to work |
61% |
(+10%) |
16% |
(-1%) |
| 1-1 |
I am kept well informed about what is happening in [Health Board] |
56% |
(+9%) |
18% |
(-5%) |
| 5-3 |
I believe it is safe to speak up and challenge the way things are done if I have concerns about quality, negligence or wrongdoing by staff |
57% |
(+5%) |
23% |
(-4%) |
| 3-2 |
Sufficient opportunities to put forward new ideas |
54% |
(+5%) |
23% |
(-3%) |
| 3-3 |
Confident ideas or suggestions would be listened to |
42% |
(+5%) |
30% |
(-5%) |
Decreases in positive responses were very small, with two questions showing a one percentage point decrease between the years.
- Q5-4 Have you had any health and safety training paid for or provided by your Health Board? e.g. Fire training, manual handling etc
- Q5-10 During the past 12 months while working for my Health Board, have you experienced emotional/verbal abuse from patients/service users or other members of the public?
In most cases where the combined positive responses (e.g. strongly agree and agree) have increased, the combined negative responses (e.g. strongly disagree and agree) have decreased. However, the percentage point changes between positive and negative responses may not be equal as a neutral response was also included in the questions/statements response range.
It should be noted the following figures show increases and decreases in percentage terms and not statistically significant differences between the years.
Figure 2 shows the percentage of positive responses to each attitudinal question (ordered from most to least positive), with the percentage change from 2013 also listed.
Figure 3 shows the percentage point change from 2013 of positive responses to each question (ordered from most to least improved).
Figure 2 ‐ Percentage of positive responses to each attitudinal question in the NHSScotland Staff Survey 2014 (ordered from most to least positive result).
.")
Figure 3 ‐ Percentage change in positive responses to each question in the NHSScotland Staff Survey between 2014 and 2013 (ordered from most to least positive change).
")
6.5 Identifying opportunity for improvement across NHSScotland
This part of the report displays all primary questions in the survey compared to the results in 2013, but excludes sub set or secondary questions. Table 4 (see page 20) contains the full question text; the 2014 percentage; the 2013 percentage; and the percentage change between the two years. (Due to rounding, the percentage difference may appear to be 1 percentage point different to the figure that would be obtained by simply comparing the rounded percentages for the two years).
Where questions are negatively worded the positive perception is shown to enable the ranked order
e.g. The results for the question: During the past 12 months while working for my health board, have you experienced unfair discrimination from your manager? are displayed for those who said NO to this question i.e. in the example below, 6% of staff said they felt they had experienced unfair discrimination from their manager, therefore this is displayed as 94%. The text of these questions is highlighted in grey in the table.
| Total number of responses: | 55077 | 44389 | Diff SS +/- |
|---|---|---|---|
| Question | 2014 % |
2013 % |
|
| Q4-4 During the past 12 months while working for your health board, have you experienced unfair discrimination from your manger? ('No', or positive response used in calculation') |
 |
The 2014 question results are in a descending ranked order i.e. the most positive responses appear at the top of the list. The 2013 results are displayed alongside the 2014 rankings and both sets of results are colour coded to help to identify areas of strength or improvement.
The cell containing questions results are colour coded Red, Amber or Green according to the percentage of respondents giving a positive response:
-
 indicates 'strength'- agreement from 65% or more of staff
 -
 indicates 'opportunities for improvement' - agreement from between 41% & 64%
 -
 indicates 'areas for improvement' - agreement from 40% or fewer staff.
The parameters for the 'red', 'amber' and 'green' colour coding have been set by Capita for this survey in line with the parameters used in analysis of the results of other public sector staff surveys. When using a 5-point scale the cut-off for 'areas of strength' is usually questions or statements generating an average score of over 4.00 on a scale of 1 to 5. Analysis of the national survey data informed the conversion of the threshold for 'areas of strength' to questions or statements where 65% or more strongly agree or agree.
Similarly, the cut-off for 'areas for improvement' is usually questions or statements generating a score below 3.00 (mid-point on the scale from 1 to 5) and this is converted into 40% or fewer staff agreeing.
The red/amber/green colour coding is designed to act as a guide to interpreting the results and to help to identify areas of strength and areas that present opportunities for improvement.
Further explanation of this is provided in the Technical Report.
The coloured text in the third column highlights where there has been a change in perception between the years. The summary table of improvements, no significant change or deteriorations between the years shown below is shown at the top of each page.
Only statistically significant differences are presented in green or red font. Where a zero or a small, but not statistically significant change, has occurred the percentage agreeing, NSC (no significant change) is shown in amber font.
Table 4 shows the percentage of respondents who gave positive responses to the question
Responses to negatively‐phrased questions (highlighted in grey) have been treated in reverse to allow direct comparison with positively‐worded questions. e.g. 'Q4‐5 During the past 12 months while working for my health board, have you experienced unfair discrimination from other colleagues?', the percentage stated represents the respondents who said 'No' to that question (i.e. gave the positive response).


Contact
Email: Malcolm Summers