Negative Emissions Technologies (NETS): Feasibility Study - Technical Appendices
Technical annex for study that estimates the maximum Negative Emissions Technologies (NETs) potential achievable in Scotland, 2030 - 2050.
1. Current status of global nets projects
1.1 Introduction
As outlined in chapter 1 of the main report document, it is now well established that NETs are needed to reach global Net Zero targets. Significant efforts are therefore underway to develop and deploy NETs, with several advancements, feasibility studies and deployment of pilot and commercial scale NETs plants.
To achieve the NETs deployment rates necessary, the UK Government has funded £31.5M for the Greenhouse Gas Removal Demonstrators Programme and £70M for the GHG R&D Programme and Direct Air Capture and Greenhouse Gas Removal technologies competition in 2020[1]. The purpose of the funds is to help improve the technological maturity of NETs[2].
Under the £70M fund, funding was split into two segments: 1.) Phase 1 delivering £250,000 of funding per project; 2.) Phase 2 utilising funding to help construct 15 facilities, 13 of which fall into our criteria of being an engineered NET[3], [4]. Only one of these projects will be partially situated in Scotland, led by Black Bull Biochar Ltd, who plan to utilise waste biomass residues from a site in Fort William to produce biochar in Cumbria[4]. Please see Table 57 in Appendix 8 for further information.
There were two additional Scottish projects that did not pass Phase 2 funding: Storegga Dreamcatcher, a 0.5 MtCO2/year DACCS project investigating the replacement of natural gas used in Carbon Engineering’s prototype with an alternative heat source (e.g. hydrogen)[6], [5]; and the University of Edinburgh’s DACCS project, investigating the use of solar energy to capture 50ktCO2/year of atmospheric CO2 using an activated carbon adsorbent[6].
1.1.1 Examples of NETs facilities
This section presents NETs facilities currently operational and in planning in the UK and globally. The list presented here is not exhaustive and is intended to provide examples of the various technologies being implemented worldwide.
1.1.1.1 Carbon Capture Scotland
Carbon Capture Scotland (previously known as Dry Ice Scotland) operate a dry ice production facility at Crocketford, Dumfries & Galloway, commissioned in 2021 and costing £4m. The company operate a combined capture capacity of 22 ktCO2per year from biogenic sources such as biogas upgrading and fermentation in distilleries. The propriety equipment is modular and can be scaled up and applied across multiple sites and industries. The captured CO2 is used to produce dry ice for the health, and food and drink sectors. The company also intend to provide NETs removals and future storage potential, with a stated aim of greater than 200 ktCO2per year by 2030[7].
Carbon Capture Scotland has recently announced Project NEXUS which has received funding from the Scottish Government and private investment. The £120m investment will consist of a series of infrastructure and supply chain projects that allow for a sustainable and commercial means of carbon dioxide removal, starting in 2023 with projects in central and northern Scotland. Note that whilst not definitively NET projects (due to the question over the permanence of the captured CO2 (at least in the interim period before geological storage is available)), the project will support the development and advancement of NETs in Scotland.
1.1.1.2 BECCS Power
1.1.1.2.1 Drax Power Station, UK
Drax Power Station is currently operating two pilot scale BECCS facilities in North Yorkshire, with plans for commercial scale capture in 2027. The pilot scale facilities became operational in 2019 and 2020, capable of capturing a total of approximately 1.3 tonnes of CO2 per day[8]. One of the facilities is demonstrating the use of chemical absorption (based on an innovative solvent developed by C-Capture, a spin off from Leeds University) for capturing CO2 from a stream of one of the Drax biomass boilers while the other is demonstrating Molten Carbonate Fuel Cell technology for CO2 capture.
1.1.1.2.2 The Stockholm Exergi BECCS facility in Sweden
Stockholm Exergi is demonstrating BECCS on their biomass CHP site in Stockholm. The BECCS plant will be capable of capturing 800,000 tCO2/year[9]. Heat is recovered from the CHP system as well as the capture unit (potassium carbonate-based chemical absorption) and is used and is fed into the district heating system leading to improved efficiencies. The 120 MWe project received funding from the European Commission under the EU Innovation Programme and is expected to become operational by 2026.
1.1.1.2.3 Toshiba Mikawa Power Plant, Japan
In 2009, Toshiba Energy Systems and Solutions (ESS) began an initial pilot to capture 10 tCO2/day from the Toshiba Mikawa power plant in Japan, a 50kW biomass-fired power plant. As of 2020, Toshiba ESS announced the operation of a large-scale carbon capture facility, building on the findings of the initial pilot in 2009. The large-scale facility is capable of capturing up to 500 tCO2/day and is now one of the largest operational BECCS plant worldwide[10].
1.1.1.3 BECCS EfW
The list of EfW sites considered is in Table 46 of Appendix 2.
1.1.1.4 BECCS biofuels
1.1.1.4.1 Operational
Carbon capture from fermentation is common areas with widespread bioethanol industry, such as Europe and North America. Table 1 shows a selection of the largest bioethanol with capture facilities currently operating. Also shown in the table is the total CO2 captured from bioethanol production in Europe in 2021 and the USA in 2022.
| Site | CO2 destination | Location | Year | CO2 Captured (MtCO2/year) |
|---|---|---|---|---|
| Alco Bio Fuel[11] | Food and drink Refrigerated transport | Ghent, Belgium | 2016 – 2022 | 0.1 |
| Alco Energy[12] | Horticulture | Rotterdam, Netherlands | 2016 | 0.4 |
| Total capture from European bioethanol producers[13] | 2021 | 1.05 | ||
| Illinois industrial CCS[14] | Geological storage | Illinois, USA | 2017 | 1 |
| Arkalon CO2 compression facility[14] | Enhanced Oil Recovery | Kansas, USA | 2009 | 0.29 |
| Bonanza bioenergy[14] | Enhanced Oil Recovery | Kansas, USA | 2012 | 0.1 |
| Red Trail Energy CCS[14] | Geological storage | Dakota, USA | 2022 | 0.18 |
| Total capture from USA bioethanol producers[15] | 2022 | 2.55 | ||
| Husky Energy CO2 Injection[16] | Enhanced Oil Recovery | Saskatchewan, Canada | 2012 | 0.1 |
1.1.1.4.2 Projects in planning
Projects in planning are those either with granted permission to construct their CCS facility or in the process of obtaining such permission.
The CCS institute lists 37 bioethanol CCS projects in development[14]. 36 of the planned projects are in the USA with the majority (35 of 36) ranging from 90-570 ktCO2per year in capture capacity, amounting to a total capacity of 9.32 MtCO2 per year. The only planned project at mega tonne scale in the USA is the Aemetis ethanol plant in California, with a planned capacity of 2 Mt. However, only 400 ktCO2per year capture is planned from Aemetis’ ethanol production facility, the remainder will be provided by third party facilities[17]. In Canada, a further 3 MtCO2 of capture capacity from ethanol production is expected to be operating by 2024[14].
| Site | Location | CO2 destination | Year | Capture capacity |
|---|---|---|---|---|
| 35 bioethanol facilities throughout USA | Geological storage | 2024-2025 | 9.32 MtCO2 total. Ranging from 0.09 to 0.57 MtCO2, averaging 0.266 MtCO2 | |
| Aemetis | California, USA | Geological storage | 2024 | 2 MtCO2. 0.4 MtCO2 from own production facility. 1.6 MtCO2 from third parties. |
| Federated co-operatives | Saskatchewan, Canada | Enhanced Oil Recovery | 2024 | 3 MtCO2 |
In terms of potential UK pilot plants there are three that were being considered for Phase 2 CCUS funding[18], but failed to pass.
| Project | Technology | Location | Capacity | Operational Date | ||
|---|---|---|---|---|---|---|
| Mt,waste/year | Ml,fuel/year | MtCO2/year | ||||
| Alfanar’s Lighthouse Green Fuels plant[19] | Waste-to-SAF plant using gasification and Fischer Tropsch | Teesside, England (East Coast Cluster) | 1 | 180 | N/A | 2027 |
| Altalto Immingham waste to jet fuel[20] | Waste-to-fuel plant | Immingham, England (East Coast Cluster) | 0.5 | 60 | 0.08 | 2027 |
| Protos Biofuels Ltd[21] | Waste-to-fuel plant | Northwest England (HyNet) | 150,000 | N/A | 0.16 | 2025 |
1.1.1.5 BECCS Industry
The list of industry sites considered is in Table 43 of Appendix 2.
1.1.1.6 BECCS Hydrogen
1.1.1.6.1 Operational
There are currently no operating BECCS Hydrogen plants in Scotland. However, there are circa 20 existing biomethane sites which could be used to produce hydrogen via SMR or auto thermal reforming (ATR)[22].
Outside of the UK, there are some existing biohydrogen and bio-syngas production plants, with Table 4 summarising key projects identified from the IEA’s Clean Energy Demonstration Projects Database[23] and Bioenergy ExCo database[24].
| Project | Hydrogen Technology Type | CCS Installed | Location | Year | Capacity |
|---|---|---|---|---|---|
| AquaGreen PCE | Fast Pyrolysis of wet sludge and waste streams to produce syngas with CCS | Yes | Denmark | N/A - operational | N/A |
| Tokyo Sewage-to-H2plant | Waste-to-hydrogen gasification plant with CCS | Yes | Japan | 2021 | 15-18 t/year of hydrogen |
| BayoTech H2-1000 hydrogen + carbon clean pilot | Methane reforming of syngas or biogas plant with CCS | Yes | USA | 2022 | 3 ktCO2/year, |
| Waste2Value, Bioenergy and Sustainable Technologies GmbH | Gasification of lignocellulosics to produce H2 rich syngas without CCS | No | Austria | 2022 | 1MW |
| AquaGreen/Farevejle wastewater facility | Fast Pyrolysis of wet sludge and waste streams to produce syngas without CCS | No | Denmark | 2022 | N/A |
| DTU Chemical engineering LT-CFB | Fast Pyrolysis to produce syngas without CCS | No | Denmark | 2002 | N/A |
| DTU Chemical engineering Viking Gasifier | Gasification of organic residues and waste streams to produce syngas without CCS | No | Denmark | 2002 | N/A |
| Hazer Process Demonstration Plant | Methane pyrolysis-cracking of biogas from sewage treatment without CCS* | No | Australia | 2020 | 100 t/year of hydrogen |
*Novel technology which stores carbon in the form of graphite
Key things to note from the above is that existing projects appear to favour the use of waste feedstocks (5 out of 8 projects) over more traditional biomass feedstocks, and that gasification and fast pyrolysis are the favoured routes of production (7 out of 8 projects). Furthermore, the majority of projects do not utilise CCS (5 out of 8 projects), and hence do not deliver negative emissions.
Several pilot projects producing syngas and/or biohydrogen without CCS also exist:
- LTU Green Fuels, DP1+DME pilot: Operating from 2011 to 2016, this Swedish pilot plant produced 2MW of clean syngas by gasifying black liquor and bio-oil. DME and methanol were also produced and sold as by-products.
- BIONICO pilot plant: Operating from 2015 to 2019, this Italian pilot plant produced 100kg/day of hydrogen using waste feedstocks that were anaerobically digested and converted to biohydrogen via membrane reactor technology[25]. The project was funded by the EU’s Horizon 2020 programme.
These have now closed down.
1.1.1.6.2 Projects in planning
There appears to be considerable scope for biohydrogen and bio-syngas within the next decade, with 32 projects being identified: 23 projects within the rest of the UK and 9 projects outside of it. Please note that some of the listed projects do not utilise CCS, and hence are considered as biohydrogen/bio-syngas projects instead of BECCS hydrogen.
1.1.1.6.3 Non-UK projects
Projects that are under development were discovered using the IEA’s Clean Energy Demonstration Projects Database[23] and the Bioenergy ExCo database[26].
| Project | Hydrogen Technology Type | Location | Year | Capacity |
|---|---|---|---|---|
| FUREC[23] | Waste gasification without CCS | Netherlands | 2022* | 54 ktH2/year |
| Wabash Valley Resources (IN)[23] | Waste gasification with CCS | USA | 2024 | 1,700 ktCO2/year |
| Mote biomass-to-hydrogen plant (CA)[23] | Waste gasification with CCS | USA | 2024 | 150 ktCO2/year |
| OMNI CT – California[23] | Waste gasification without CCS | USA | 2023 | 5 ktH2/year |
| Solena Group Plasma enhanced gasification[23] | Waste gasification without CCS | USA | 2023 | 4 ktH2/year |
| Yosemite Clean Energy - Oroville[23] | Waste gasification without CCS | USA | 2024 | 4.5 ktH2/year |
| Eni, Waste to Hydrogen[26] | Gasification of solid waste without CCS | Italy | N/A | 0.1tH2/year |
| Stiesdal, SkyClean[26] | Fast pyrolysis of agricultural residues to produce syngas | Denmark | Mid 2020s | N/A |
| Springkildeprojektet, Frichs Pyrolysis ApS[26] | Fast pyrolysis of manure without CCS | Denmark | 2021* | 100 m3/hr syngas |
*Project delayed and still under development
The majority of projects appear to be situated within the USA (5 out of 9 projects), which in turn promise to deliver the most significant carbon savings of 1.85 MtCO2/year by 2024. These carbon savings will be attributed to the Wabash Valley Resources (IN) plant and Mote biomass-to-hydrogen plant. The choice of feedstock is also heavily weighted towards waste (8 out of 9 projects), which will likely not deliver negative emissions due to the lack of CCS being installed (7 out of 9 projects).
1.1.1.6.4 UK Projects
The UK specific projects were identified by referring to BEIS’s list of Phase 2 projects under the Direct air capture and greenhouse gas removal programme[1] and the list of Phase 1 projects under the Hydrogen BECCS Innovation Programme[27]. Both programmes form part of the UK’s Net Zero Innovation Portfolio. These projects all cover feasibility and FEED studies, which aim to investigate ways to improve the economics, energy efficiency and broaden the range of biomass feedstocks that can be utilised to produce biohydrogen.
| Project | Company | Hydrogen Technology Type |
|---|---|---|
| Biohydrogen Greenhouse Gas Removal Demonstration | Advanced Biofuel Solutions Ltd[1] | Waste gasification with CCUS |
| CCH2: Carbon Capture and Hydrogen | KEW Projects Ltd[1], [1] | Gasification of biomass and refuse derived fuels (RDF) with CCS |
| Ince Bioenergy Carbon Capture & Storage (INBECCS) - Phase 2 | Ince Bio Power Ltd[1] | Gasification of waste wood with CCS |
| Development of Biomass Gasification Tar Reformation and Ash Removal | Advanced Biofuel Solutions Ltd[27] | Biomass gasification with tar reformation and ash removal |
| Micro-H2hub utilising biogenic feedstock for hydrogen and CO2 production | Compact Syngas Solutions Ltd[27] | Gasification |
| Bio-hydrogen Produced by Enhanced Reforming (Bio-HyPER) | Cranfield University[27] | Gasification and biogas with the HyPER process |
| RiPR (Rising Pressure Reformer) using SCWG (Super Critical Water Gasification) | Helical Energy Ltd[27] | Gasification and RWGS |
| Enhancement of KEW biomass gasification technology performances through optimisation of the H2/CO2 separation process stage | Kew Projects Ltd[27] | Gasification |
| Northeast Waste Wood Hydrogen Demonstrator (NEW2H2) | Northumbria University[27] | Hydrogen production using waste wood |
| Novel plasma reforming technology for tars reduction in BECCS | Queen Mary University of London[27] | Plasma reforming |
| H2 production via Biomass gasification Integrated with innovative one-step Gas shift reforming and separation (BIG-H2) | Translational Energy Research Centre - The University of Sheffield[27] | Gasification |
| Hydrogen from Cyanobacteria - a biological route to zero-carbon or carbon-negative hydrogen | 17Cicada Ltd[27] | Cyanobacteria |
| Eco Dark Fermentation | Alps Ecoscience UK Ltd[27] | Fermentation |
| Production of biohydrogen from waste biomass | CATAGEN Ltd[27] | Hydrogen production using recirculating-gas reactor |
| Pure Pyrolysis Refined | Environmental Power International (UK R&D) Limited[27] | Pyrolysis |
| HAROW – Hydrogen by Aqueous-Phase Reforming of Organic Wastes | ICMEA-UK Ltd[27] | Aqueous-Phase Reforming |
| Biohydrogen from Dark and Photo Fermentation | Phoebus Power Limited[27] | Fermentation |
| Thermal Catalytic Conversion of Syngas to Carbon Nanotubes | The Cool Corporation Ltd[27] | Thermal Catalytic Conversion |
| The Sustainable Biogas, Hydrogen, Graphene LOOP | United Utilities Water[27] | Biogas reforming |
| Hydrogen from organic waste with an integrated biological-thermal-electrochemical process | University of Aberdeen[27] | Thermal-electrochemical process |
| H2-Boost | University of Leeds[27] | Advanced wet oxidation and dark fermentation of organic waste |
| BIOHYGAS | University of South Wales[27] | Two-stage biohydrogen / biomethane AD system |
| Bio Hydrogen Demonstrator | Wood Group UK Ltd[27] | SMR of liquid biological feedstocks |
Several key projects producing syngas and/or biohydrogen with CCS include:
- Advanced Biofuel Solutions Ltd: This UK company already has a plant in Swindon that is expected to become the world’s first facility to convert household waste into grid-quality biomethane (1,500 t/year) and hydrogen (500t/year)[26], [28]. The funding from the Direct air capture and greenhouse gas removal programme will be utilised to expand hydrogen production, similar to that of the Swindon plant, with the aim to capture 1MtCO2/year by 2030.
- KEW Projects Ltd: This midlands-based company is developing the world's first pressurised advanced gasification plant with CCS, with works expected to be completed by 2023-2024. The plant will produce a combination of renewable fuels and bio-hydrogen using waste. The aim is to produce 50 ktCO2/year during 2025-2030 and 24 MtCO2/year in the subsequent decade[22], [29]
- Ince Bio Power Ltd: The largest waste wood gasification plant in the UK, providing 22MW of power to local households. The aim of the project is to install CCS to the existing site, which will deliver 7 ktCO2/year of negative emissions by 2027 and be the first of its kind in the UK.[30]
1.1.1.7 Biomethane BECCS
The list of biomethane sites considered is in Table 41 of Appendix 2.
1.1.1.8 Direct Air Capture (DAC)
1.1.1.8.1 Operational
There are 20 DAC pilot plants in operation worldwide at the moment, capturing less than 0.01 MtCO2/year. These are detailed in Table 7 below.
| DAC Technology Type | Company | Location | Year | Capacity (t/year) | Utilisation or Storage |
|---|---|---|---|---|---|
| Solid sorbent DAC | Climeworks[31] | Germany | 2014 | 1 | Utilisation for diesel |
| Switzerland | 2016 | 50 | Utilisation for fuels | ||
| Switzerland | 2017 | 900 | Utilisation for horticulture | ||
| Iceland | 2017 | 50 | Storage | ||
| Switzerland | 2018 | 600 | Utilisation for beverage carbonation | ||
| Switzerland | 2018 | 3 | Utilisation for fuels | ||
| Italy | 2018 | 150 | Utilisation for fuels | ||
| Germany | 2019 | 3 | Utilisation for fuels | ||
| Netherlands | 2019 | 3 | Utilisation for fuels | ||
| Germany | 2019 | 3 | Utilisation for fuels | ||
| Germany | 2019 | 50 | Utilisation for fuels | ||
| Germany | 2020 | 50 | Utilisation for fuels | ||
| Germany | 2020 | 3 | Utilisation for fuels | ||
| Germany | 2020 | 3 | Utilisation for fuels | ||
| Iceland | 2021 | 4,000 | Storage | ||
| Global Thermostat[31] | United States | 2010 | 500 | N/A | |
| United States | 2013 | 1,000 | N/A | ||
| Hydrocell[32], [52] | Finland | N/A | 1.387 | Utilisation for e-fuels | |
| Liquid solvent DAC | Carbon Engineering | Canada[31] | 2015 | 365 | Utilisation for e-fuels |
| Canada[33] | 2021 | 1,000 | Utilisation for e-fuels |
1.1.1.8.2 Projects in planning
On a global scale, Iceland, Saudi Arabia, and Scotland are all ideal locations for DAC, due to the proximity of cheap and abundant excess renewable energy (the average auction price of Saudi-Arabian solar projects awarded in 2020 was $18.3/MWh (£14.3/MWh[34])[22], [35]. However, as detailed below, only 2 projects are being built in these locations at present. There are 11 DAC facilities under development at the moment, capable of capturing 5.5 MtCO2/year by 2030[36], as well as five pilot projects funded by the UK’s Direct Air Capture and Green House Gas Removal technologies competition. A breakdown of these projects is illustrated in Table 8.
The key projects in the pipeline cover both CO2 storage and utilisation. For storage, Climeworks’ Mammoth project[37] will build upon their existing DAC technology to capture 36,000 tCO2/year, and Carbon Engineering aims to capture 1.5-2.5 MtCO2/year through their DAC1[38], Storegga[4] and Norwegian Carbon Removal[39] projects. In terms of utilisation, both Climeworks and Global Thermostat are aiming to produce e-fuels for Norsk e-fuels[40] and HIF Haru Oni e-fuels[41]. There are also plans for 1PointFive and Carbon Engineering to collaborate and deploy up to 70 large scale DAC projects by 2035, each of which could capture 1MtCO2/year[42].
If successful, the pilot projects funded under the UK’s DAC competition could capture up to 1.6 MtCO2/year. In particular, the NNB Generation Company (SZC) Ltd and Rolls Royce Plc projects show the most potential; with the former aiming to utilise 400MWth of waste heat from Sizewell C power station to capture 1.5MtCO2/year, and the latter aiming to capture circa 0.1 MtCO2/year.
| DAC Technology Type | Company | Project | Location | Year | Capacity (t/year) | Utilisation or Storage |
|---|---|---|---|---|---|---|
| Solid sorbent DAC | Climeworks | Norsk e-fuel[40] | Norway | 2026 | 80,000* | Utilisation in e-fuels |
| Mammoth[37] | Iceland | 2024 | 36,000 | Storage | ||
| Global Thermostat | HIF Haru Oni e-fuels[41] | Chile | N/A | 2,190** | Utilisation in e-fuels | |
| NNB Generation Company (SZC) Limited | Sizewell C[4] | England, UK | N/A | 1,500,000 | Storage | |
| CO2CirculAir B.V. | SMART-DAC[4] | Northern Ireland, UK | N/A | 100 | Storage | |
| Liquid solvent DAC | Carbon Engineering | DAC1[38] | Unites States | 2024 | 500,000 | Storage |
| Storegga[4] | Scotland, UK | 2026 | 500,000-1,000,000 | Storage | ||
| Carbon Removal Project[39] | Norway | N/A | 500,000-1,000,000 | Storage | ||
| Rolls-Royce plc | Environmental CO2 Removal[4] | England, UK | N/A | 100,000 | Storage | |
| Mission Zero Technologies Ltd | DRIVE[4] | UK | N/A | 120 | Storage and utilisation | |
| Mineralisation DAC | Cambridge Carbon Capture Ltd | Direct air CO2 capture and mineralisation[4] | England, UK | N/A | 100 | Utilisation in construction |
* Producing 25 Ml/year by 2026. Converted to CO2 utilisation by assuming a fuel density of 800 kgm-3 and 100% conversion of CO2 to fuel.
** Utilising 250 kgCO2/day and assuming 24/7 operation throughout the year
1.1.1.9 Biochar
There are currently no operating biochar plants in the UK. However, there are a considerable number of demonstration plants situated in Western Europe, Australia, Canada, and China. The table below summarises these projects using data taken from the IEA’s Clean Energy Demonstration Projects Database[43] and Bioenergy ExCo database[26]. Note that projects which dispose of or burn biochar have been included in this table.
| Project | Biochar Technology Type | Location | Year | Capacity/ products |
|---|---|---|---|---|
| Loganholme Wastewater Treatment Plant Gasification Facility Demonstration Project[23] | Biochar and biofuel production from wastewater | Australia | 2019 | N/A |
| Renergi, Bioenergy, Collie, Waste to Energy through Pyrolysis[23] | Biodiesel, biokerosene and biochar production via pyrolysis of waste | Australia | 2020 | 13kt/year of pyrolysis products |
| PCH Alberta | Produces SNG from fast pyrolysis of biomass. Biochar produced is burnt onsite | Canada | 2018 | 0.1 m3/year of syngas |
| Dali County Facility | Pyrolysis of rice husks to produce bio-oil, biochar, and non-condensable gases | China | N/A - operational | 4,500 m3/year of bio-oil |
| AquaGreen PCE | Pyrolysis of wet sludge to produces syngas, solid fuels, and biochar | Denmark | N/A - operational | N/A |
| AquaGreen Farevejle wastewater facility | Pyrolysis of wet sludge to produces syngas, solid fuels, and biochar | Denmark | 2022 | N/A |
| Susteen TCR300 | Pyrolysis of sewage sludge to produce bio-oil and biochar | Germany | 2018 | 0.1t/year of pyrolysis oil |
| Empyro Enschede | Fast pyrolysis to produce bio-oil and char. Char is burnt onsite. | Netherlands | 1998 | 1,000 t/year of pyrolysis oil |
| Empyro | Fast pyrolysis of organic residues to produce pyrolysis oil, steam, power and biochar | Netherlands | 2015 | 3,200 kg/hr pyrolysis oil |
| Karlsruhe Institute of Technology (KIT), Bioliq | Fast pyrolysis of straw to produce bio-oil, solid fuels, and biochar | Germany | 2010 | 0.3 t/h bio-oil |
Unlike BECCS Hydrogen, the source of feedstock appears to be evenly distributed between the use of waste, woody biomass, and other organic products (i.e., straw and rice husks). Furthermore, the majority of these projects only produce biochar as a by-product, which is either burnt onsite, disposed of, or utilised in other industries.
1.1.2 Pathways for global NETs (capacity)
As of April 2021, the European Union as well as 44 countries have pledged to meet a Net Zero emissions target, accounting for approximately 70% of global CO2 emissions. The use of NETs feature in the pledges, albeit with varying approaches and scale of deployment. The Climate Change Act commits the UK to an 80% reduction in GHG emissions by 2050 relative to 1990 levels. To achieve this reduction of NETs emissions to a value of 160 MtCO2/year in 2050, NETs, particularly DACCS and BECCS, will contribute significantly.
The IEA published its “Net Zero by 2050: A Roadmap for the Global Energy Sector”[44] in 2021, outlining a pathway for the global energy sector to achieve Net Zero emissions by 2050. The Net Zero Emissions (NZE) Scenario developed states that a total of 7.6 GtCO2 is to be captured in 2050; 30% of which comes from BECCS and DACCS, 50% from fossil fuel combustion, and 20% from industrial processes. Currently, there are approximately 35 commercial CCUS facilities in operation globally, with a collective CO2 capture capacity of 45 Mt CO2/year.
To meet the targets outlined in the NZE Scenario, global capture capacity needs to increase to 1.2 GtCO2/ year in 2030 and 7.6 GtCO2/ year in 2050. .
1.2 Technology options
Several options existing for engineered NETs including BECCS, DACCS and biochar.
A key indicator of a technology’s maturity, and hence likelihood of deployment, is known as its Technology Readiness Level (TRL). Each technology and project will be assigned a TRL level, ranging from 1-9, with a TRL of 1 being the lowest and TRL 9 the highest. Definitions of each TRL level are detailed in Table 10 below.
| Phase | TRL Level | Description |
|---|---|---|
| Research | 1 | Basic principles |
| 2 | Concept and application formulation | |
| 3 | Concept validation | |
| Development | 4 | Experimental pilot |
| 5 | Demonstration pilot | |
| 6 | Industrial pilot | |
| Deployment | 7 | First implementation |
| 8 | A few records of implementation | |
| 9 | Extensive implementation |
1.2.1 BECCS
BECCS refers to technologies which combine bioenergy applications with CCS. BECCS processes consist of biomass production, biomass conversion, CO2 capture, CO2 transport and CO2 utilisation or storage. There are a wide range of available biomass conversion and CO2 capture technologies, which are introduced within this section. The final output will depend on the technologies used, ranging from the generation of electricity and heat to the production of hydrogen, biofuels or biomethane. A more detailed review of BECCS applications is given in section 2.
1.2.1.1 Biomass conversion
Biomass conversion refers to the process in which biomass feedstocks are converted into energy. There are several different methods and technologies available, consisting of combustion, gasification, pyrolysis, fermentation and anaerobic digestion. A summary of the various technologies is outlined in Table 11 below.
| Conversion technology | Description | Products |
|---|---|---|
| Combustion | Combustion with oxygen | Electricity, heat |
| Gasification | Partial combustion of biomass or waste feedstocks | Syngas, electricity, heat |
| Pyrolysis | Thermal degradation of a solid fuel in the absence of oxygen to produce char | Biochar, syngas |
| Fermentation | Organic material is broken down by micro-organisms with low oxygen levels | Bioethanol and other biofuels |
| Anaerobic digestion | Organic material is broken down by micro-organisms in the absence of oxygen | Biogas |
All of the listed technologies are at TRL 9 (without CO2 capture) but not are all well-established with CO2 capture. CO2 capture on combustion of biomass has been demonstrated by Drax and Stockholm Exergi as well as other operators worldwide. The capture of CO2 from process emissions in fermentation and AD sites has also been demonstrated. The capture of CO2 from biomass gasification and pyrolysis processes is less established and still at TRLs below 7.
Biomass combustion technologies are substantially advanced and have been demonstrated commercially in the UK and globally at large capacities up to 300MWe. All other biomass conversion technologies have been demonstrated on a smaller scale. More detail on the various conversion techniques is shown in Appendix 2.
1.2.1.2 CO2capture Options
There are many carbon capture options including post-combustion carbon capture, pre-combustion carbon capture, oxy-fuel combustion, chemical looping, carbonate looping and supercritical CO2 (the Allam cycle). Different approaches are applicable to the different biomass conversion technologies listed above. Table 12 provides a summary of the three most-developed carbon capture approaches (post-combustion capture, pre-combustion capture and oxyfuel combustion are discussed below) applicable to power plants (including CHP and DH) and industrial sites. For each approach, there are also several different technologies available as shown in Table 13. The TRL levels in the last column refers to biomass plants with carbon capture with post-combustion capture being the most advanced in terms of large-scale technology demonstration while gasification systems with pre-combustion capture are still in the pilot testing phase (Assessing the cost reduction potential and competitiveness of novel (Next Generation) UK carbon capture technology, Benchmarking state-of-the-art and next generation technologies, Wood)[45].
| Carbon capture technology | Description | Advantages | Disadvantages | CO2 capture rate | TRL |
|---|---|---|---|---|---|
| Post-combustion capture | Removal of CO2 from a flue gas stream. Chemical absorption |
|
High energy penalty for solvent regeneration | ~90% | TRL 7-8 |
| Pre-combustion capture | Capture of CO2 from syngas, where the syngas is produced through gasification. Can utilise physical absorption due to relatively high pressures, thus reducing costs. | Results in a high CO2 concentration and high partial pressure | High capital and operating costs | ~90% | TRL 5-6 |
| Oxy-fuel combustion capture | Combustion with a stream of oxygen, resulting in a flue gas with higher CO2 concentration and hence easier CO2 separate | Reduced downstream processing of CO2 | High energy requirement for air separation unit (ASU) | ~90% | TRL 7 |
Pre-combustion capture
Pre-combustion carbon capture systems are applied to biomass gasification processes. CO2 is extracted from the syngas prior to combustion, where specific options included biomass integrated gasification combined cycle plants (BIGCC) with solvent absorption, sorbent enhanced reforming using carbonate looping and membrane separate of hydrogen from syngas[46].
Post-combustion capture
Post-combustion capture systems are applied at the end of biomass conversion processes, where CO2 is separated from the flue gas stream from biomass combustion or incineration.
| CO2 capture technology | Description | Variations |
|---|---|---|
| Membrane separation | Separation of CO2 across a selective membrane | Inorganic membranes, Polymeric membranes, hybrid membranes |
| Adsorption | Molecular sieves or activated carbon are used to adsorb CO2. Desorption of CO2 is then carried out by pressure swing adsorption, or temperature swing adsorption | Molecular sieves, activated carbon |
| Chemical absorption | Reaction of CO2 with a chemical solvent to form an intermediate compound. The original solvent and CO2 can be regenerated upon application of heat | Solvents include amines, ammonia, ionic liquids |
| Physical absorption | Physical absorption of CO2 into a solvent | Solvents include methanol and glycol based |
| Cryogenic separation | Separation of CO2 by condensation at low temperatures and separation by boiling point difference. |
Oxy-fuel combustion capture
Oxy-fuel combustion involves the combustion of a fuel in a high purity oxygen stream, rather than air, resulting in the production of a flue gas with a much higher CO2 concentration. This allows for a much easier CO2 separation process when compared to combustion with air, as the CO2 can be cleaned, compressed, and stored with less downstream processing when compared to combusting fuel with air[46].
Although oxy-fuel combustion capture systems have several advantages, a key disadvantage relates to the energy requirements of the Air Separation Unit (ASU) to produce the oxygen required, and the CO2 purification unit.
1.2.2 Direct Air Carbon Capture and Storage (DACCS)
DACCS works by drawing in ambient air using fans and contacting the CO2 present with specialist sorbents, where the CO2 is subsequently captured via adsorption or absorption. CO2-depleted air is produced as an output. The sorbent is then regenerated by altering the process conditions, typically by elevating temperatures and/or reducing pressures, which in turn releases the CO2 as a pure stream ready for capture.
As the CO2 concentration in air is significantly lower than compared to BECCS and biochar flue gas streams (between 3-8 vol%)[47], then DACCS exhibits a higher energy penalty and hence is more expensive. Despite this, researchers have suggested that DACCS shows the most immediate promise in Scotland out of all engineering NETs[22], as it can achieve considerable carbon removal efficiencies (85.4%-97%)[48], is flexible in location[49], [50], and is not constrained by the availability of limited resources (e.g. biomass)[35]. Furthermore, DACCS does not require complex MRV and carbon accounting methods, as it is a closed system technology achieving permanent removal[35].
Existing DACCS systems are predominantly based on liquid solvent CO2 capture or solid sorbent-based carbon capture[51]. The liquid solvent process is pioneered by Carbon Engineering, whilst the solid sorbent process is led by Climeworks and Global Thermostat. There are also new technologies being developed which offer promises of reduced energy demands and cost[52]. The energy demands of these alternative configurations, along with their carbon removal potential, are detail in Table 14 below. The costs of these configurations are broken down in Table 33, page 68. More detail on the specific DACCS technology aspects is given in Appendix 3.
| Company | Heat (MWh/tCO2)* | Electrical (kWh/tCO2) | Carbon removal efficiency |
|---|---|---|---|
| Carbon Engineering | 1.46[23]-2.45** | 0[23]-1,535[52] | 10-92%[49] |
| Climeworks | 1.5-2.0[52] | 200–300[52] | 9-97%[50] |
| Global Thermostat | 1.17-1.41[52] | 150–260[52] | N/A |
| Antecy | 2.08[52] | 694[52] | N/A |
| MSA | 0[52] | 316-326[52] | N/A |
| Molecular filters | N/A | 333[52] | N/A |
*Units transposed to MWh from varying sources
** In this instance natural gas is burnt in a NGCC unit and electricity is generated onsite.
When compared to BECCS, DACCS is less effective in terms of carbon removal, as it requires large quantities of heat and power per tCO2; BECCS on the other hand act as a NETs producer[53]. However, the potential for DACCS scale up is technically unlimited, as CO2 is sourced directly from the atmosphere and is not constrained by biomass feedstocks that can exhibit supply chain, price, and transport issues.
1.2.3 Biochar
Biochar is a charcoal-like product formed during pyrolysis, where a biomass feedstock is thermally decomposed in the absence or at very low oxygen levels[54]. This process is similar to gasification, despite exhibiting lower efficiencies, and can be achieved through slow or fast pyrolysis[55].
Slow pyrolysis is favoured when producing biochar and can be achieved following a batchwise or continuous process configuration. During batchwise pyrolysis, heat is sourced from burning a portion of the biomass feedstock, whilst continuous pyrolysis initially sources heat externally, before switching to burning the combustible gases released during pyrolysis. Fast pyrolysis is favoured when maximising biofuel production, with yields of up to 80% being achievable under the right conditions. The heat used in fast pyrolysis is typically delivered using an inert solid material that acts as the energy carrier (i.e., a fluidised bed)[56].
The choice of feedstock to produce biochar is broad, with organic wastes, forestry residues and mixed plastic all being possible[57], [58]. The biochar product can subsequently be applied to soils, where the original carbon sequestered during biomass feedstock growth (via photosynthesis) is retained in a stable form that is resistant to decomposition, and thus enables negative emissions[59]. Typically, slower biochar application rates are prefered[54]. Pyrolysis temperatures typically range from 350degC to 650degC, below which the process is considered to be “toast” rather than pyrolysis, and above leads to significant material loss. Varying these temperatures also has a direct impact on the structure, composition, and physical characteristics of the biochar, which in turn contribute towards the biochar’s recalcitrancy. In particular, temperature impacts the number of aliphatic chains and aromatic rings, the proportion of fulvic and humic acids, the concentration of nutrients (e.g., phosphorous and nitrogen), ash content, pH, porosity and surface area. Typically, higher temperatures are favoured[54].
An alternative production method is via hydrothermal carbonization (known as wet mild pyrolysis), where biomass is anaerobically decomposed at 180degC to 280degC in the presence of subcritical liquid water. The advantage of this process is its ability to process biomass with a high moisture content (i.e., wetter waste feedstocks)[60].
1.3 Policy & regulatory evidence review
1.3.1 Existing Scottish policies and regulations
Under an amended Climate Change Act, Scotland set out an ambitious target to achieve a 75% reduction in emissions by 2030 compared to 1990 levels[61]. This will be funded through the Industrial Strategy Challenge Fund[3]. However, according to the CCC[62] this would not be possible even under the most optimistic scenario (the ‘tailwinds’ pathway), which predicts a 69% reduction in emissions.
Under the ‘Developing Scotland’s circular economy’ paper[63], the Scottish Government proposes to reduce landfill waste to 5%, by achieving a recycling rate of 70%, reducing 15% of total waste compared to 2011, and reducing food waste by 33% (compared to 2023) by 2025. This reduction in waste could significantly impact feedstock supplies going towards EfW, gasification and biomethane sites.
1.3.2 Existing UK policies, regulations and recommendations
The UK Government has announced over £100M in funds to help develop GGRs and screen them on their potential to deliver negative emissions, reduce costs and scalability[2]. £31.5M of these funds will be delegated to five land based GGR demonstrator projects (including biochar and perennial bioenergy crops) under the Strategic Priorities Fund. The development of CCUS clusters is also underway, with the UK Government announcing £1B worth of funds[59]. To help further encourage the deployment of NETs and formation of a CO2 utilisation market, the UK Government is planning to invest £15M in a new grant-funding competition for SAF production and introduce SAF blending mandates by 2025[2]. SAFs typically comprise of biofuels and e-fuels, that latter of which is manufactured via the Fischer Tropsch process using captured CO2[64].
In 2021, the National Infrastructure Commission (NIC) made 8 key policy suggestions for the UK Government to enact[3], the majority of which the UK Government agreed with[65]. Firstly, the UK Government has reiterated that they are committed to achieving at least 5 MtCO2/year of GGRs by 2030, by delivering on their £100M GGR innovation fund and wishing to develop GGRs incentives. Secondly, the UK Government has confirmed they will obligate polluting sectors to offset their emissions, covering 100% of emissions by 2050. Lastly, they have reiterated that CO2 T&S infrastructure will be delivered by the end of this decade[65]. However, the UK Government only partially accepts to have polluting sectors pay for removals in order to reach carbon targets[65], which can undermine the viability of implementing policies that penalise heavy emitting polluters, such as the GGR Obligation Scheme (please see Section 1.3.3 for further detail).
The UK is expecting to issue a Biomass Strategy in 2023, which will review the amount of sustainable biomass in the UK to source biochar[59].
Stakeholders wish for a combination of price and quantity instruments to promote GGR deployment. Price mechanisms will be vital to attracting investment in early GGR projects and quantity mechanisms will play a larger role in reaching targets for removals once technologies have matured. Also, technology-neutrality should be a long-term goal once technologies mature, and a market-led mechanism becomes feasible[59].
UK Government must ensure that new policies complement existing ones, such as the 25 Year Environment Plan and Sustainable Development Goals[59].
1.3.3 Potential policy or regulatory levers
1.3.3.1 Expand support for GGRs via additional funds
The CCC[2] recommends that the UK Government should expand upon its existing UK Greenhouse Gas Removal Demonstrators programme, in order to further develop field experiments, pilots, and demonstration and commercialisation projects. For less mature GGRs, government support is necessary to enable innovation and demonstration, before the private sector deploys them in response to £/tCO2 incentives[59]. As for large-scale NETs, public funding provides a chance to develop and test the technology without the risk of private investment being retracted[66]. Continued government support for pilot projects helps improve understanding of a technology's risks, so that appropriate safeguards can be put in place, as well as help provide financial certainty through long term contracts[59]. Analysis by Vivid economics further builds upon this and suggests that research councils can fund research and innovation into low-carbon technologies through the Natural Environment Research Council (NERC), Economic & Social Research Council (ESRC), and Engineering and Physical Sciences Research Council (EPSRC)[59]. Furthermore, the Government should help coordinate opportunities between GGRs and wider CCUS deployment, to help share the cost of CO2 T&S infrastructure[59].
Despite the benefit of Government funds, it is also necessary that fiscal incentivises are put in place. Without them the high capital and operating costs of GGRs makes private investment unattractive and there is lack of a stable revenue stream for the provision of negaisstive emions[59]. Furthermore, pilot projects are needed to more fully understand the environmental impacts, negative emissions potential, and can help establish repeatable and effective practices in deploying land-based GGR[59].
1.3.3.2 Expand the Contracts for Difference (CfD) scheme
The CfD scheme is the UK Government’s main mechanism for supporting low-carbon electricity generation. CfDs incentivise investment in renewable energy by providing developers of projects that have with high upfront costs and long lifetimes with direct protection from volatile wholesale prices, and they protect consumers from paying increased support costs when electricity prices are high. This is done by having a pre-agreed price for the low carbon electricity that the generators produce, for the duration of the contract – this is known as the ‘strike price’.
The CfD scheme could be expanded to include GGR or CCUS facilities. This approach could prove attractive to investors, as it secures a revenue stream for the GGR developers and reduces financial risk associated with upfront capital investment[59]. Furthermore, it has proven to be successful in the past for renewable energy, which experienced significant cost reductions and scale up once initial CfDs were issued.
Analysis by Ricardo[67] highlights that a CfD auction could be easily adjusted to target BECCS specifically, and be applied to the three main biomass conversion/CHP sites in Scotland: Markinch CHP (55 MWe), Steven's Croft power station (44 MWe), and Westfield Biomass Plant (10 MWe). These sites have potential to achieve 0.8MtCO2/year of negative emissions[67], which is equivalent to 15% of the CCPu’s 2032 target[68] Further analysis by Vivid economics[59]suggests that the ‘strike price’ for BECCS Power could be linked to the electricity price, whilst for BECCS Industry and DACCS the ‘strike price’ could be linked to the ETS price.
1.3.3.3 UK ETS
Prior to Brexit, the UK had adopted the EU-ETS. This policy allowed operators that undertook CCS to not have to surrender allowances where emissions had been verified as captured and permanently stored. The UK now has its own ETS, which follows a similar cap and trade scheme that caps the total level of GHG emissions a at a reserve price of £22/t. This cap will reduce in line with the UK’s Net Zero commitments (i.e., reaching zero by 2050), increasing the price. This scheme does not cover any GGRs[69].
The Government can link contracts with GGR providers (i.e., CfDs) for revenue to the UK ETS, allowing offsets to be traded. This will act as an additional revenue source for GGR providers, helping us reduce the initial volatility of GGR revenues. The inclusion of GGRs in the UK ETS will help provide market-based solutions for stimulating investment, and move us towards a single, integrated compliance market for carbon, with negative emissions supporting liquidity as the ETS allowance cap falls over time[59], [62]. However, the UK ETS won’t be a sufficient incentive on its own[59].
1.3.3.4 GGR Obligation Scheme
As an alternative to including negative emissions within the UK ETS, a negative emissions obligation scheme could be implemented instead. This is viewed as a good alternative, as it avoids the risk of potentially undermining the UK ETS due to the uncertain nature of GGRs[59], [62]. Companies would be required to secure negative emission certificates to meet their obligations, focussing on fossil fuel suppliers (calculated as a percentage of the carbon content of fuels) and wholesale distributors of agricultural products (calculated as a percentage of GHG emissions associated with agricultural activities). These certificates can be traded with other obligated emitters[59], [62]. Additional benefits of the system include focussing on a “polluter pays principle”, which will be more politically acceptable, and the fact that the heaviest emitting sectors would be covered[59], [62]. However, one key risk is pass through costs impacting low-income households disproportionately. Another key disadvantage is the initial limited GGR market size, which could lead to volatile certificate prices during the early stages of deployment, and risk weaking the incentives. Furthermore, the trading of these certificates would require rigorous accounting standards (please see the MRV section above)[59], [62].
1.3.3.5 GGR tax credit/carbon levy
This is a scheme where energy intensive industries receive a reduction in tax liabilities (£/tCO2) if they adopt GGRs and/or CCS, which can then be traded to allow realisation of their true value[59]. There two main options available: 1.) provide tax credits paid for in £/tCO2 of GHGs removed, modelled after the 45Q tax credit for CCS; 2.) provide a tax credit for initial (capital) investment for GGRs, similar to the 48a/b tax code in the US[62]. It has been proven in the past that high carbon prices/carbon taxes/tax credits have created markets where NETs are more commercially viable (e.g., the California carbon tax credit)[66]. Please note that stakeholders believe tax credits should be available to everyone, and not just be limited to heavily polluting industries[59].
The benefits of this tax credit are that it provides a strong incentive to develop capital intensive GGRs (e.g. BECCS Power), has a lower MRV accounting requirement compared to the GGR Obligation Scheme, and incentivises both emission reductions and GGR deployment simultaneously[59]. However, a key risk is that tax credits can easily change overtime, which exposes investors to risk, and hence the Government needs to provide additional guarantees to ensure that tax credits will pursue over time. Furthermore, the monetary benefits of this scheme will go to corporations, which is less politically favourable than compared to the other options discussed. Finally, similar to the GGR Obligation Scheme, there is a risk of pass-through costs impacting low-income households[59], [62].
Analysis on the necessary carbon and negative emission prices needed to make BECCS and EfW-CCS competitive with coal-CCS and coal was conducted by Pour et al[70]:
- For BECCS to be competitive with coal-CCS, the carbon price will need to be between £107/tCO2* to £160/tCO2 *
- For BECCS to be competitive with coal-CCS the negative emission price will need to be between £17/tCO2 - £68/tCO2 *
- For BECCS to be competitive with coal the negative emissions price needs to be between £68/tCO2* to £135/tCO2* respectively.
- For EfW-CCS to be competitive with coal-CCS, the negative emissions price needs to be £68/tonne* to complete with coal-CCS.
- For EfW-CCS to be competitive with coal, the carbon price will need to be between £110- £169/tCO2*
We could also input a fertiliser tax to incentivise the application of biochar to soils[59].
*Values converted from USD to GBP using conversion of 1 USD = 0.83 GBP.
1.3.3.6 GGR Subsidies
Subsidies from the Government are another option, which are categorised into:
1.) Targeted grants aimed at individual landowners who deploy small-scale GGR projects (e.g., biochar).
2.) Service contracts aimed at businesses that deploy large-scale GGRs.
In both instances, a government body responsible for the programme would screen the proposals based on feasibility and enter into contracts with successful bidders[59].
Some key benefits associated with this incentive are its lower risk, its cost being progressively distributed across the tax base, and greater Government control over GGR locations. This latter point is important, as it enables targeted GGR deployment to maximise co-benefits. However, this choice of incentive is expensive (costing £6B-£20B/year by 2050) and leads to less efficient allocation of resources compared to market-based policies[59]. These levers have not been included in the pathway analysis but could aid deployment, particularly in scenario 1).
1.3.3.7 Monitoring, verification and reporting (MVR)
Across the literature reviewed, a frequently cited barrier to GGR deployment is the lack of a MRV protocol[2]. To ensure BECCS is low carbon, biomass feedstocks need to be sourced locally and sustainably. However, at present the IPCC's Guidelines for National Greenhouse Gas Inventories does not account for removals reported in the jurisdictions producing the biomass or storing the CO2[2], and there are no UNFCCC accounting guidelines for most GGRs[59]. A robust MVR protocol would fill in these gaps; reducing the risk of relying on carbon-intensive biomass imports and accommodate for varying GHG accounting accuracies between different GGRs[66]. This latter point is key, as it facilities an environment where negative emission certificates can be traded whilst maintaining certificate equivalence[59]. Furthermore, an appropriate Certificate Authority (CA) should be established, who can issue negative emission certificates and hold the power to guarantee removals are verifiable and quantifiable[59]. There is also a risk associated with the ‘mitigation deterrence’ effect of GGRs[66], which refers to the risk of incentives making GGRs more attractive than compared to developing/adopting other low-carbon technologies[2]. The Government has confirmed that they understand this risk, and will design an appropriate GGR monitoring scheme to combat it accordingly[59]Please note that the Government has only partially accepted putting in place a MRV regime by 2024[65].
Biochar carbon accounting is still under development and depends on the potential for mobilisation of the stored carbon and its possible return to atmosphere. Carbon permitting and regulations that prevents such releases will be necessary[35].
1.3.3.8 Other policy options
The permanent land use change requirement could be relaxed to help support production of biomass for BECCS, so that farmers can more flexibly switch back to agricultural land use after an initial rotation, and biochar could be incentivised through inclusion in the Agriculture Reform Programme (ARP)[59]. Furthermore, BECCS Hydrogen deployment could be scaled up if included in the Renewable Transport Fuels Obligation (RTFO)[59].
1.3.3.9 Potential policy issues
The Climate Change Committee highlighted potential policy issues[2]:
- Who has responsibility for accounting of GHG removals, does it lie with the producer or consumer?
- Setting a negative emission threshold may only lead to inefficient GGR technologies being deployed (e.g., a BECCS Power plant without heat recovery). This is counterintuitive, and policy should include a minimum NETs efficiency alongside any negative emissions thresholds.
- Public support for NETs is necessary, with analysis by the Climate Assembly highlighting the public’s negative view on engineered GGRs compared to natural solutions. Building early on with sequential small-scale deployment could help build a social license for engineered GGRs.
- Policy must ensure strong governance so that biomass is harvested sustainably. Biomass cannot be harvested if it is detrimental to the surrounding area and impacts natural CO2 sequestration.
1.3.4 Existing International policies
In recent years, there have also been several global advancements in incentives that have been developed to promote the accelerated deployment of NETs. NETs policy support to date has predominantly focused on direct grant support, aimed at addressing financial barriers with deployment of NETs due to high upfront capital costs and potential high operating costs. However, efforts are underway to develop further incentives for NETs through regulations and mandatory standards.
In November 2022, the European Commission adopted a proposal for an EU-wide voluntary framework for certification of carbon removals[71]. The proposal is now under review by EU countries and lawmakers to determine if it will be approved. The certification process must be credible, hence the proposal sets out proposed rules for independent verification of CO2 removals, as well as proposed rules to recognise certification schemes that can be used to demonstrate compliance[71]. The certification of carbon removals from NETs can help support future inclusion of NETs in carbon markets, hence providing a direct incentive to invest in the technologies.
An overview of existing global support mechanisms is outlined in Table 15 below.
| Policy support | Location | Year |
|---|---|---|
| BECCS reverse auction | Sweden | 2021 (announced) |
| NETs tariff | Luxembourg | 2022 |
| Direct Air Capture combined with long-term carbon storage, coupled to existing low-carbon energy | US | 2021 |
| Bipartisan Infrastructure Law | US | 2021 |
1.3.4.1 BECCS Reverse auction, Sweden
The Swedish Government has announced a reserve auction, covering bio-CCS projects with a total budget of £3.2 billion. The reverse auction will determine who can deploy BECCS at the lowest cost, with companies bidding on the quantities of CO2 that can be captured[72]. Winners of the auction will then receive support in the form of subsidies. The support will cover CO2 capture, transport and storage fees over a period of 15 years. The Swedish Energy Agency hope to hold the first round of the auction in 2023, followed by storage occurring in 2026[73].
1.3.4.2 NETs Tariff, Luxembourg
NETs have been concluded as being required to reach Net Zero targets for the EU and many of the member states, as part of the strategy identified in the European Green Deal and the 2021 European Climate Law. The EU commission has therefore proposed to develop the certification of carbon removals (CCR) which will be discussed in the first quarter of 2023. The aim of the CCR is to support the scale-up of atmospheric carbon removal with the use of engineered GGR technologies, such as BECCS and DACCS, as well as improved forestry and agriculture practises.
Luxembourg has developed and introduced national legislation to support engineered GGR, known as the Luxembourg Negative Emissions Tariff (LNET). The LNETS is designed as a support scheme to CCR based upon the German renewable energy feed-in tariff, providing a premium per tonne of removed carbon through five-year contracts assured by the government.
1.3.4.3 Direct Air Capture combined with long-term carbon storage, coupled to existing low-carbon energy, USA
This funding opportunity in the US aims to support front-end engineering design (FEED) studies for DACCS projects, capable of capturing a minimum of 5,000 tCO2/year. Covering a total of £11.8 million*, 5 DACCS projects have received funding through this policy mechanism as of August 2022.
1.3.4.4 Bipartisan Infrastructure Law, USA
Beginning in 2021, the Bipartisan Infrastructure Law (BIL) aims to commercialise carbon management, industrial decarbonisation technologies and associated infrastructure, containing a total of £10.2 billion* to be provided over a five-year period. As part of the BIL, the Department of Energy (DOE) in the US will provide up to £3 billion* support to regional DAC hubs, with the aim of establishing four regional hubs capable of capturing 1 million tCO2/year. The BIL is made up of several additional programmes, with a focus on carbon capture technologies, as well as transport and storage infrastructure.
*Values converted from USD to GBP using conversion of 1 USD = 0.83 GBP.
1.4 Non-engineered nets
Non-engineered NETs are out of scope of this report; however, we have summarised these in chapter 1.4 of the main report and Appendix 9 for reader reference.
1.5 Bioresources
Carbon capture technologies discussed in section 1.2, with the exception of DACCS, can only be considered NETs when combined with a feedstock which has absorbed carbon from the atmosphere. The negative emissions that can be achieved is therefore dependent on sourcing such feedstocks, ensuring sustainable supply and avoiding indirect land use change.
Ricardo studied the availability of bioresources in Scotland in 2022, for ClimateXChange (CXC)[67]. The project subdivided feedstocks into directly combustible biomass and those more appropriate for anaerobic digestion or liquid biofuel production. This report has divided feedstock into solid and non-solid biomass.
The tables in sections 1.5.1 and 1.5.2 show the currently utilised biomass resource, and the available resource currently (latest available data), in 2030 and 2045. The available resource accounts for biomass that should be left in-situ (for maintenance of soil condition, for example) and those that remain after competing uses have been satisfied. Where the available resource equals the currently used resource, there is neither excess resource nor is the resource overused. Where the available resource exceeds the currently used resource, there is potential to increase the amount of biomass used for energy. Where the future available resource is lower than the currently used resource, the amount of biomass used for energy must decrease in the future or potentially use biomass at an unsustainable rate.
If biomass is sourced from forests, concerns may centre on woodland loss and degradation, and if sourced from dedicated energy crops there’s a risk of competition for land to grow food[59]. The large-scale of biomass required can cause additional pressure on land, water and biodiversity[74].
Table 16 shows some typical energy and density criteria for bioresources. Non-biogenic resources are also included in this table for reference.
| Type | Moisture content (%) | NCV (GJ/t) | Bulk density Kg/m3 | Energy density GJ/m3 |
|---|---|---|---|---|
| Biogenic | ||||
| Miscanthus (balled) | 25% | 13 | 140-180 | 1.8-2.3 |
| Wood chip | 30% | 13 | 250 | 3 |
| Wood pellet | 10% | 18 | 650 | 11 |
| Torrefied wood pellets[75] | 0% | 22 | 720 | 16 |
| Non-biogenic | ||||
| Natural gas | N/A | 38 | 0.9 | 0.035 |
| LPG | N/A | 46 | 510 | 24 |
| Heating oil | N/A | 43 | 845 | 36 |
| Coal (Anthracite) | N/A | 33 | 1100 | 36 |
| SRF*/RDF[76] | Site specific, up to 23 GJ/tonne depending on composition. Biomass content variable. | |||
*Note that the acronym SRF can stand for solid recovered fuel or short rotation forestry, here we are talking about solid recovered fuel. We have not used the acronym for forestry in this report to minimise confusion.
1.5.1 Solid biomass
The largest source for solid biomass in Scotland is from the forestry industry. Use of roundwood suitable for timber for bioenergy is not considered viable. Therefore, the available resource includes only residues: Portions of small roundwood (SRW) and brash. Arboriculturally arising (tree felling in parks, verges and gardens) have also been included in the resource, assuming this is less likely to enter sawlog supply chains.
A secondary by-product of forestry are sawmill residues. These are predominantly woodchip (60%), with smaller quantities of sawdust (28%) and bark (11%). Wood processing industries take the largest share of this resource (54%), in woodchip and sawdust for purposes such as panel board production. 26% of sawmill residues are already used for bioenergy, including wood pellet production. Most bark is sold for other purposes, not used in wood production or energy.
Due to the long maturation time of traditional forestry plantations, the current level of forestation in Scotland is indicative of the availability of forestry and sawmill residues in the medium term. Future afforestation will not increase the availability of residues until after 2045. The availability of SRW for bioenergy (constituting the greatest part of the forestry residue resource) is expected to decline to 2045, whilst brash and arboricultural arisings may increase. However, the availability of large roundwood is expected to increase to 2037-41, resulting in greater production of sawmill residues. The estimate assumes half of the sawmill residue increase will be directed to bioenergy, increasing the proportion for this purpose from 26% currently to 34% in 2030. Beyond 2041, the supply of large roundwood (and therefore sawmill residues) is expected to decline.
Emerging sources for biomass, specifically intended for energy uses, are short rotation forestry (commonly referred to as SRF, but not in this report due to acronym used elsewhere), short rotation coppicing (SRC) and perennial energy crops. There is currently no largescale resource, however, the report estimates a potential SRF resource of 100kt/year by 2045 and a perennial energy crop resource (including short rotation coppice) of 150kt/year per year by 2030, rising to 640kt/year by 2045.
Previous work by Ricardo, for CXC, indicated a theoretical potential of 5.78, 1.75 and 0.52 Mt/year for short rotation forestry, SRC and miscanthus respectively[67]. This work accounted for physical constraints on land suitability (such as access, soil type and climate). The later work for CXC (resulting in estimates presented in Table 17) assumed limits on planting rates for each type of energy crop. For short rotation forestry and Miscanthus this was fixed at 1000ha per year. For SRC this started at 1000 ha per year, increasing by 20% with each passing year. The planting area for SRC was limited to 5% of permanent grassland (amounting to 57,113 ha). This limit was imposed to comply with Greening rules at the time of the study and, at the assumed planting rate, is reached by 2036. SRF and Miscanthus planting is allowed up to the area of suitable land identified in the 2020 Ricardo study (912,600 ha and 51,800 ha, respectively), however neither limit is reached within the timeline of the model due to the restricted planting rate. It should also be noted that a rotation of 15 years was applied to short rotation forestry, therefore even if widespread planting begins by 2025, resource is not available until 2040.
| Feedstock | Currently used for bioenergy (Mt) | Current available resource (Mt) | 2030 available resource (Mt) | 2045 available resource (Mt) |
|---|---|---|---|---|
| Forestry residues and arb arisings | 1.12 | 1.2 | 0.94 | 0.95 |
| Sawmill residues | 0.45 | 0.45 | 0.98 | 0.81 |
| Short rotation forestry | 0 | 0 | 0 | 0.1 |
| Perennial energy crops | 0 | 0 | 0.15 | 0.64 |
| Straw | 0 | 0.29 | 0.29 | 0.29 |
| Waste wood | 0.29 | 0.29 | 0.29 | 0.29 |
| Residual waste (biogenic component) | 0.56 | 0.56 | 0.14 | 0.14 |
Straw is an agricultural residue of cereal crops, which may be directly combusted. There is currently no widespread use of straw for bioenergy in Scotland, straw also has a large number competing uses, such as: Animal bedding, feed and horticulture. These uses consume around 80% of the current production. Leaving a potential resource of 290kt, which is not expected to change to 2045.
Wood waste arises from a number of sectors. Cleaner wood comes from packaging, pallets and joinery, whilst dirtier waste wood arises from construction and demolition, civic amenity sites. Wood from fencing, railways and telegraph poles may be classed as hazardous waste due to use of preservatives. 290kt is currently used for bioenergy and the available resource is not expected to change throughout the time period.
Residual waste is the waste left after recyclables and food waste have been removed. The organic component of the residual waste for combustion is expected to decline from current levels, both from policies aimed at waste prevention (decoupling population and economic growth from waste quantities) and greater recovery of food waste for anaerobic digestion. The specific mix of fuel used in EfW sites determines the biogenic CO2 that can be captured – our assumptions for future sites use an equivalent CO2 capture potential per unit fuel input as the existing sites in operation – but if this mix changes, then the CO2 capture potential will also vary.
1.5.2 Non-solid biomass
Non-solid wastes are those either entirely liquid or with comparatively low solid content. They are generally not suitable for direct combustion, without first drying to remove the liquid content, but are ideal for anaerobic digestion or some methods of liquid biofuel production. Table 18 and Table 19 both show the same resources, however, Table 19 expresses the quantity of resource as the energy content (MWh) of their assumed products, which is biodiesel for used cooking oil (UCO) and tallow, and biogas for all other resources. Comparison of the two tables highlights the large range in energy content across the resources, from 0.003 MWh/t for spent lees/wash (from whisky production), to 10.1 MWh/t for UCO to biodiesel.
| Feedstock | Currently used for bioenergy (Mt) | Current available resource (Mt) | 2030 available resource (Mt) | 2045 available resource (Mt) |
|---|---|---|---|---|
| Food waste | 0.18 | 0.18 | 0.27 | 0.27 |
| Whisky by-products | 0.74 | 2.49 | 2.75 | 3.16 |
| Brewery by-products | 0 | 0 | 0 | 0.01 |
| Dairy by-products | 0.03 | 0.04 | 0.04 | 0.04 |
| Animal processing by-products | 0 | 0.07 | 0.07 | 0.07 |
| Sewage sludge | 0.35 | 1.53 | 1.56 | 1.56 |
| Farm slurries | 0.07 | 10.26 | 10.26 | 10.26 |
| Used cooking oil | 0.01 | 0.02 | 0.02 | 0.02 |
| Tallow | 0.04 | 0.06 | 0.06 | 0.06 |
| Feedstock | Currently used for bioenergy (MWh) | Current available resource (MWh) | 2030 available resource (MWh) | 2045 available resource (MWh) |
|---|---|---|---|---|
| Food waste | 202 | 202 | 299 | 299 |
| Whisky by-products | 145 | 319 | 379 | 479 |
| Brewery by-products | 0 | 0.57 | 1.14 | 2.06 |
| Dairy by-products | 5.80 | 8.64 | 8.64 | 8.64 |
| Animal processing by-products | 0 | 51.4 | 51.4 | 51.4 |
| Sewage sludge | 90.4 | 392 | 398 | 400 |
| Farm slurries | 8.66 | 1,187 | 1,187 | 1,187 |
| Used cooking oil | 138 | 210 | 213 | 214 |
| Tallow | 330 | 500 | 500 | 500 |
Food wastes arises from domestic and commercial sectors. Scotland has a target to reduce food waste by 33% by 2025. However, the Ricardo study assumed an increase in the rate of food waste collection, up to 70% by 2030. Therefore, there is a NETs increase in the available food waste resource.
Whisky by-products include draff, pot ale, spent lees/wash and distillers’ dark grains (DDG). Brewery by-products (spent grain, hops and yeast) provide a much smaller potential resource (both in weight and energy). These sectors have been identified as having growth potential. The CXC study has assumed a growth in production (and therefore by-products) of 7.5% by 2030 and 20% by 2045. Draff and DDGS have the greatest energy potential per tonne, but also have value as animal feed. The largest potential by weight and total energy is pot ale, a by-product of the first distillation process with sold content of only 4%, most of which is disposed of as waste-water.
The main dairy by-product is Whey (the liquid remains of cheese making). The current total production of 500kt is primarily located in Dumfries and Galloway, where it is mainly used for animal feed. However, a small amount of the resource (25.5kt) in Argyll and Bute is used for anaerobic digestion. The available resource is not expected to change from the current level to 2045.
Animal processing by-products include fish, shellfish and abattoir wastes (primarily blood and bones, and some fat). By energy content, shellfish waste (undersized shellfish or parts not suitable for consumption) has the greatest potential (81.6% of the available resource) and is not considered to have any competing uses. Animal blood and bones comprises 14.8% of the available resource, the total resource is greater than shellfish waste but is primarily used for fertiliser or animal feed, leaving a smaller resource available for bioenergy. The available resource is not expected to change.
Sewage sludge arises from waste treatment plants, the availability of the resource is expected to increase in proportion to Scotland’s population. An increase of 1.5% by 2030 and 2% by 2045. Some sewage sludge is dried for direct combustion and a larger amount already sent for AD, amounting to around 350kt. The available resource is estimated to be 4 times the currently utilised resource. These are naturally concentrated in areas of high population concentration.
Farm slurries constitute the largest non-solid biomass resource, by weight and total energy, it is also largely underutilised. These arise from dairy, beef and pig farms which may present difficulties for economic use as the resource is dispersed. The study has assumed that 75% of the resource may be available to bioenergy. The size of the resource is not expected to change from the present day to 2045.
Used cooking oil (UCO) and tallow are assumed to be used to produce biodiesel in Table 19. In comparison to other non-solid biomasses, the energy potential is out of proportion to the total mass due to their relatively high energy densities (10.1 and 9.1 MWh/t, respectively). UCO arises from catering premises, food factories and households. As with sewage sludge, the scale of the resource is expected to increase in proportion to Scotland’s population (increasing by 1.5% by 2030 and 2% by 2045). 70% of UCO is assumed to be available for bioenergy, alternative uses include lubricants and manufacturing additives.
Tallow is a by-product of meat processing, produced by rendering fat. Tallow, in common with many animal products, is categorised for permissible uses. Category 3 tallow, suitable for use is soap and cosmetics, is a high value product and unlikely to be used for energy. Category 2 tallow can be used for industrial applications. Category 1 may only be used for burning or fuel production, production is estimated as 55 ktper year, of which two thirds is already used for bioenergy. The current size of the resource is not expected to change to 2045.
1.6 CO2transportation and storage (T&S)
The main methods of CO2 transportation are via pipeline, shipping, rail or truck. Pipelines are favoured when transporting in large quantities (1–5 Mt) and over moderate distances (100–500 km), whilst shipping is better suited to longer journeys (>2,400 km). Shipping does have the advantage of being more flexible and scalable; however, it also requires well-developed hubs, terminals, and a pressurisation station to de-liquify compressed CO2, all of which are expensive[52].
Haszeldine et al[35]estimated the cost of CCS implementation to be between £70-200/tCO2 for capture and £20/tCO2 for storage, which are expected to reduce by 50% by 2050 if deployed at scale (meaning capturing, transporting and storing CO2 at capacities >400 ktCO2/year)[22].
The deployment of all NETs is dependent on CO2 T&S and hydrogen infrastructure. In Scotland, the Acorn site shows the most promise, which plans to repurpose the Feeder 10 gas pipeline to transport CO2 from Peterhead port to St Fergus gas terminal at a capacity of 12 MtCO2/year and be sequestered in the North Sea. The site plans to be operational until 2060[22]. In the instance that the Acorn site is not developed in time, the Scottish Government can utilise alternative CCUS clusters (e.g., East Coast Cluster) that aim to be in operation by the close of this decade. Table 20 shows a breakdown in typical CO2 transport and storage costs.
| Category | Method | Cost (£/t CO2) * |
|---|---|---|
| CO2 Transport | Truck | 11.8 |
| Train | 6.8 | |
| Onshore Pipeline | 1.7 – 40.5 | |
| Offshore Pipeline | 3.4 – 48.5 | |
| Shipping | 10.1 – 18.6 | |
| Storage | Geological storage | 9.3 |
*Values converted from USD to GBP using conversion of 1 USD = 0.83 GBP.
Additional costs found from IEAGHG Paper[77]:
| Category | Method | Capacity (MtCO2/year) | Cost range (£/tCO2) |
|---|---|---|---|
| CO2 transport | Onshore pipeline | 3 | 3.32 - 9.12 |
| 10 | 1.66 - 3.32 | ||
| 30 | 1.08 - 1.66 | ||
| Offshore pipeline | 3 | 5.81 - 12.44 | |
| 10 | 2.49 - 4.15 | ||
| 30 | 1.66 - 2.07 | ||
| CO2 Storage | Depleted Oil-Gas field onshore- reusing wells onshore | N/A | 1.33 - 9.12 |
| Depleted Oil-Gas field no reusing wells onshore | N/A | 1.33 - 13.02 | |
| Saline formation onshore | N/A | 2.49 - 14.93 | |
| Depleted Oil-gas field offshore- reusing wells offshore | N/A | 2.49 - 11.61 | |
| Depleted Oil-Gas field offshore- no reusing wells offshore | N/A | 3.9 - 18.25 | |
| Saline formation offshore | N/A | 7.46 - 25.71 |
*Costs are in per 250km of pipeline constructed. All costs quoted above were converted to sterling using a conversion factor of USD to 0.83 pounds.
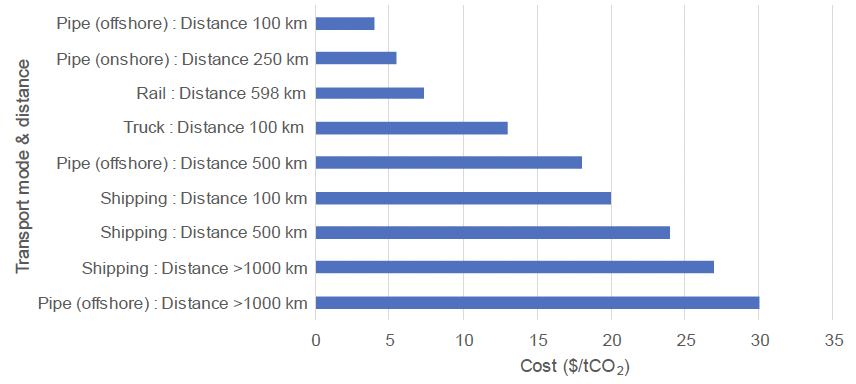
Revised costs used in the LCOC Analysis
| Transport Mode | Distance (km) | Cost ($/tCO2) | Cost (£/tCO2/km) |
|---|---|---|---|
| Truck | 100 | 13 | 0.126 |
| Rail | 598 | 7.3 | 0.013 |
| Pipe (onshore) | 250 | 5.5 | 0.015 |
| Pipe (offshore) | 100 | 4 | 0.033 |
| 500 | 18 | 0.029 | |
| >1000 | 30 | 0.024 | |
| Shipping | 100 | 20 | 0.163 |
| 500 | 24 | 0.039 | |
| >1000 | 27 | 0.022 |
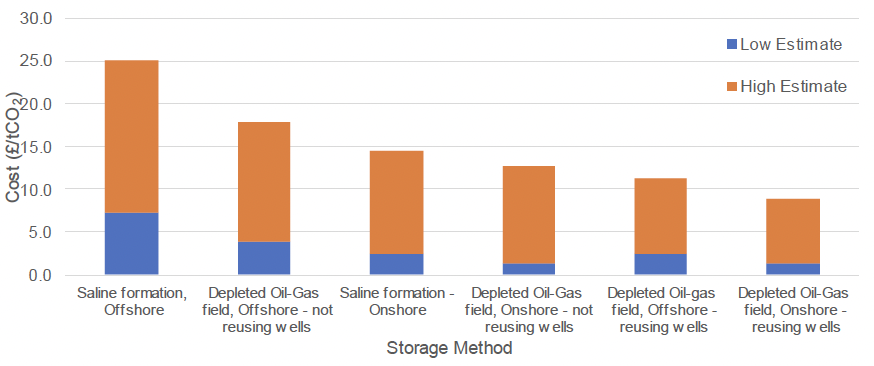
| Storage Method | Cost (£/tCO2) | |
|---|---|---|
| Low | High | |
| Depleted Oil-Gas field onshore- reusing wells onshore | 1.292256972 | 8.884266682 |
| Depleted Oil-Gas field no reusing wells onshore | 1.292256972 | 12.68027154 |
| Saline formation onshore | 2.422981822 | 14.53789093 |
| Depleted Oil-gas field offshore- reusing wells offshore | 2.422981822 | 11.3072485 |
| Depleted Oil-Gas field offshore- no reusing wells offshore | 3.796004855 | 17.76853336 |
| Saline formation offshore | 7.268945467 | 25.03747883 |
Contact
Email: NETs@gov.scot