Negative Emissions Technologies (NETS): Feasibility Study - Technical Appendices
Technical annex for study that estimates the maximum Negative Emissions Technologies (NETs) potential achievable in Scotland, 2030 - 2050.
Appendix 2. LCOC analysis
Data sources
Disregarded sites
The following sites were disregarded due to a lack of data in the literature, the site is fossil fuel powered, and/or the site is located on an island. In the instance that the site is an island, the capture carbon would have to be shipped and then transported by road to one pf our chosen CO2 injection points, which is unrealistic given that the site will offer low CO2 capture potentials.
| Site | Owner | Type of Technology | Reason |
|---|---|---|---|
| North British Distillery | Lothian Distillers | Grain whisky | Already deploys CCS |
| Caol Ila | Diageo | Malt whisky | Island based |
| Laphroaig | Beam Suntory | Malt whisky | |
| Bunnahabhain | Burn Stewart Distillers (Distell International) | Malt whisky | |
| Highland Park | The Edrington Group | Malt whisky | |
| Jura | Whyte & Mackay (Emperador) | Malt whisky | |
| Lagavulin | Diageo | Malt whisky | |
| Bowmore | Beam Suntory | Malt whisky | |
| Bruichladdich | Rémy Cointreau | Malt whisky | |
| Scapa | Chivas Brothers Ltd. (Pernod Ricard) | Malt whisky | |
| Ardbeg | The Glenmorangie Co. (LVMH) | Malt whisky | |
| Arran | Isle of Arran Distillers | Malt whisky | |
| Tobermory | Burn Stewart Distillers (Distell International) | Malt whisky | |
| Lagg | Isle of Arran Distillers | Malt whisky | |
| Ardnahoe | Hunter Laing & Co. | Malt whisky | |
| Kilchoman | Kilchoman Distillery Co. | Malt whisky | |
| Harris | Isle of Harris Distillers Ltd. | Malt whisky | |
| Isle of Raasay | R&B Distillers | Malt whisky | |
| Abhainn Dearg | Mark Tayburn | Malt whisky | |
| Lerwick Energy Recovery Plant | Shetland Islands Council | BECCS EfW (Heat only) | |
| Western Isles Integrated Waste Management Facility | Western Isles Waste Management | BECCS AD (CHP) | |
| Pulp Mill House[150] | Pulp-tec | BECCS Industry (pulp) | Lack of data |
| Cullen[151] | Robert Cullen Ltd | BECCS Industry (pulp) | |
| Sapphire Mill | Fourstones Paper Mill Co Ltd | BECCS Industry (paper towel) | A gas-powered site. No potential for NETs |
BECCS Biomethane
The following sites considered were identified using the NNFCC database and REPD.
| Plant | Owner | Operational Status | Type of Technology | Gross Electrical Capacity (MWe) | Feedstock Capacity (t/year) | Biomethane produced (m3/hr) | Data source |
|---|---|---|---|---|---|---|---|
| Portgordon Maltings Beyside | Grissan Energy | Operational | Biomethane grid injection & CHP | 5 | 837,500 | 800 | NNFCC |
| Brae of Pert Farm | Qila Energy | Operational | Biomethane grid injection & CHP | 0.25 | 35,000 | 550 | NNFCC |
| Charlesfield Industrial Estate | Charlesfield First | Operational | Biomethane grid injection & CHP | 0.249 | 24,995 | 550 | NNFCC |
| Cumbernauld AD | Shanks | Operational | Biomethane grid injection & CHP | 3.6 | 100,000 | 495 | NNFCC |
| Downiehills Farm | Buchan Biogas | Operational | Biomethane grid injection & CHP | 0.5 | 55,000 | 550 | NNFCC |
| Girvan Distillery | Grissan Energy | Operational | Biomethane grid injection & CHP | 7.2 | 300,000 | 2,750 | NNFCC |
| Glenfiddich Distillery | William Grant & Sons | Operational | Biomethane grid injection | 3.5 | 80,000 | 2,000* | NNFCC |
| Hatton Farm AD | Grissan Energy | Operational | Biomethane grid injection & CHP | 0.5 | 38,000 | 450 | NNFCC |
| Inchdairnie Farm | Qila Energy | Operational | Biomethane grid injection & CHP | 2 | 40,000 | 500 | NNFCC |
| Invergordon Distillery | Whyte & Mackay | Operational | Biomethane grid injection & CHP | 0.25 | 36,500 | 500 | NNFCC |
| Keithick Farm | Keithick Biogas | Operational | Biomethane grid injection & CHP | 0.249 | 36,000 | 605 | NNFCC |
| Lockerbie Creamery | Lockerbie Biogas Ltd | Operational | Biomethane grid injection | 0.5 | 98,250 | 768 | NNFCC |
| Morayhill AD | Qila Energy | Operational | Biomethane grid injection & CHP | 0.25 | 40,000 | 495 | NNFCC |
| Peacehill Farm | TD Forster & Son | Operational | Biomethane grid injection & CHP | 0.237 | 30,450 | 550 | NNFCC |
| Rosskeen Farm | Qila Energy | Operational | Biomethane grid injection & CHP | 0.25 | 36,000 | 450 | NNFCC |
| Savock Farm | Qila Energy | Operational | Biomethane grid injection & CHP | 0.25 | 40,000 | 600 | NNFCC |
| Tambowie Farm | Tambowie Biogas | Operational | Biomethane grid injection & CHP | 0.973 | 24,000 | 220 | NNFCC |
| TECA AD | Aberdeen City Council | Operational | Biomethane grid injection & CHP | 0.35 | 81,012 | 425 | NNFCC |
| Portgordon Maltings – Anaerobic Digestion Facility | Grissan Engineering Services Limited | Permission Granted | Biomethane | 0 | 0 | 2,000** | REPD |
| Lockerbie Creamery – Anaerobic Digester | Lockerbie Biogas Limited | Permission Granted | Biomethane | 0 | 0 | 916*** | REPD |
| Mains Of Boquhan - Anaerobic Digester Facility | Grahams Family Dairy | Permission Granted | Biomethane | 0 | 21,500 | 274**** | REPD |
| Millerhill AD | Biogen | Operational | BECCS Biomethane (grid injection & CHP) | 1.5 | 35,000 | 445.6 | NNFCC |
* Regarding the Glenfiddich Distillery site, it is split into two installations. The first consists of two 11.5m high by 30m diameter reactors with a 3.5 MW biogas-fuelled CHP[152], and the second installation includes two 14.7m high by 28m diameter reactors[153]. Assuming a standard medium-sized anaerobic digestor tank produces around 500m3/hr of biomethane, the estimated biomethane production potential is approximately 2000 m3/hr.
** The information provided in the REPD Database regarding the operational capacity of the Portgordon Maltings site was insufficient. To obtain more comprehensive details, we conducted a thorough examination of the planning application submitted to the council.[154] Our investigation revealed that the project had been divided into two phases, which were represented separately in the REPD. The complete project consists of four primary digester plant tanks, each measuring 28m in diameter and 16.9m in height, along with three smaller feedstock tanks measuring 22.5m in diameter and 10m in height. The primary source of feedstock for the project will be waste from the malting plant and nearby distilleries. Considering that both project phases are located on the same site, we have chosen to merge them. Based on the assumption that an average biomethane tanker has a capacity of 500 m3/hr, we have determined a total site capacity of 2,000 m3/year.
*** The information provided in the REPD Database regarding the operational capacity of the Lockerbie Creamery site was insufficient. To obtain more comprehensive details, we conducted a thorough examination of the planning application submitted to the council.[155] The application for the project exhibited several variations, and according to the SEPA permit, the installation will comprise of two 1.5MWth input natural gas CHP units and inject around 54,965 MWh of biomethane into the grid. This injection rate is equivalent to ~5,496,500 m3/year, which we have utilised in our analysis.

**** The information provided in the REPD Database regarding the operational capacity of the Mains of Boquhan site was insufficient. To obtain more comprehensive details, we conducted a thorough examination of the planning application submitted to the council.[156] According to the application, the site is designated as an AD Upgrading facility utilizing the water scrubbing method. The proposed feedstock inputs for the facility include whey (20,000t), sludge from milk pasteurization (500t), manure (500t), and grass silage (500t), totalling 21,500 tonnes per year. Since the provided data only pertains to feedstock inputs, it was necessary to employ calculations specific to BECCS AD Upgrading to determine the biomethane production capacity and associated costs. This approach differs from the methodology used for other BECCS Biomethane sites.
BECCS Power
The following sites considered were identified using the REPD.
| Plant | Owner | Operational Status | Type of Technology | Gross Electrical Capacity (MWe) | Data source |
|---|---|---|---|---|---|
| Markinch Biomass CHP Plant | RWE | Operational | BECCS Power (CHP) | 65 | REPD |
| Stevens Croft | E.ON | Operational | BECCS Power | 50.4 | REPD |
| Westfield Biomass Power Station | EPR Scotland | Operational | BECCS Power | 12.5 | REPD |
| Speyside Biomass CHP Plant | Speyside Renewable Energy Partnership | Operational | BECCS Power (CHP) | 12.5 | REPD |
| Rothes Bio-Plant | Scottish Bio-Power | Operational | BECCS Power (CHP) | 8.3 | REPD |
| Sustainable Power and Research Campus | University of St Andrews | Operational | BECCS Power (CHP) | 6.5 | REPD |
| Acharn Forest Killin Biomass Plant | Northern Energy Developments | Operational | BECCS Power (CHP) | 5.6 | REPD |
| Diageo Biomass Energy Project | Diageo | Operational | BECCS Power | 5.5 | REPD |
| Harbour Road | Glennon Brothers Troon | Operational | BECCS Power (CHP) | 2.6 | REPD |
| Gleneagles Hotel Biomass Boiler Plant Room | AMP Energy Services Limited | Operational | BECCS Power | 1.2 | REPD |
| Macphie of Glenbervie | Macphie Ltd. | Operational | BECCS Power | 1.2 | REPD |
| Co-Op, Polwarth Street - Biomass boilers | Gold Energy Limited | Permission Granted | BECCS Power | 0.44 | REPD |
| Hillhead Of Coldwells, Longhaven - Biomass Boilers | Private Developer | Permission Granted | BECCS Power | 0.26 | REPD |
| Little Broomfield - Biomass boiler | Private Developer | Permission Granted | BECCS Power | 0.21 | REPD |
BECCS Industry
The sites considered were identified using the REPD, HNPD, SPRI, and CHPQA databases. The Morayhill Mill site was identified through the REPD, but site-specific data was obtained through stakeholder engagement.
| Plant | Owner | Operational Status | Type of Technology | Gross Electrical Capacity (MWe) | Data source |
|---|---|---|---|---|---|
| Caledonian Papermill | Caledonian Paper | Operational | BECCS Industry CHP (paper - coated magazine) | 26 | REPD and CHPQA |
| Cowie Biomass Facility | Norbord | Operational | BECCS Industry CHP (Particle & MDF) | 15 | REPD and CHPQA |
| Invergordon Pellet Mill | Balcas | Operational | BECCS Industry CHP (wood pellets) | 5 | REPD and CHPQA |
| Morayhill Mill | Norbord | Operational | BECCS Industry (Oriented Strand Board) | 100* | Stakeholder engagement |
| Barony Road, Auchinleck | Egger Barony LTD (particle) | Operational | BECCS Industry CHP (Chipboard and wood recycling) | 5.5 | HNPD |
| Dunbar Cement | Tarmac | Operational | BECCS Industry (Cement) | N/A | SPRI and websites[114], [108] |
Please note that the REPD mistakenly states that the following sites are not CHPs: Caledonian Papermill, Cowie Biomass Facility, Invergordon Pellet Mill, and Barony Road, Auchinleck. We understand that these sites are CHPs based off previous CHPQA submissions and additional information found in the literature.
No data on the heat and power usages of the Dunbar Cement site could be found in the literature; therefore, the carbon capture capacity of the site was determining using data submitted to SEPA under the SPRI Database. This in turn was used to determine the costs. The only data that was found was the production of 867 t,clinker per day[114] and that the site aims to use a fuel mixture that consists of 45% SRF[108].
Caledonian Paper Mill
This paper mill has been in production since April 1989 and has the capacity to produce 250,000 tonnes of lightweight coated paper (LWC) specifically designed for printing magazines, catalogues, and brochures[157]. The mill operates a 26 MWe CHP plant that exclusively uses 100% biomass as fuel, derived from both virgin and recycled sources, including solids sourced from a primary effluent treatment plant.
Cowie Biomass Facility
The site produces Caberfloor[158], a specially processed and compressed woodchip material. The site operates both a large biomass boiler that produces steam as well as two high-pressure natural-gas turbines to produce hot exhaust gas and to supply on-site power. The SPRI database indicates emissions with a biomass content of 72.4%, but it is unclear whether this includes sources outside of the CHP plant.
Invergordon Pellet Mill
This site produces wood pellets[159]. Again, there is limited data on site heat and power demands, with the planning application[160] and REPD mentioning that a biomass fired CHP is present onsite.
Morayhill Mill
This site manufactures Oriented Strand Board (OSB) using timber chips sourced from nearby sawmills. Any timber residue from the plant is used to fuel a biomass boiler. This includes bark stripped from the logs at the start of the manufacturing process, wood dust extracted from various production processes around the plant, along with any timber residue and non-specification timber flakes. The burner generates heat for use in the drying and curing stages in board production. The SPRI database confirmed that emissions from this site are 100% biogenic.
After some stakeholder engagement we learnt that there are two biomass burners present onsite, one 57 MWth and the other 43 MWth.
Egger Barony
This site manufactures approximately 400,000 m3 of raw chipboard per annum[161], which can then either be used in its raw form or be upgraded for use in the furniture and interior design markets or building market. In 2021 Egger stated that they wish the Barony plant to be powered 100% through a new biomass CHP (5.5 MWe output) and generate hot gas to be used in drying wood material[162]. This CHP has now been completed and features in the Heat Networks Planning Database[163], where heat is sold to an industrial customer nearby consisting of three buildings. The SPRI database confirmed that emissions from this site are 100% biogenic.
Dunbar Cement
The site produces 867 t/d of clinker with a heat consumption of 3.26 MJ/kg[114].
Dunbar cement plant by agreeing a contract with leading Scottish resource management company, Hamilton Waste and Recycling, to begin using Solid Recovered Fuel (SRF) at the plant[164]. Combined with other waste-derived fuels, this new supply of SRF at Dunbar will support our aim to replace up to 45% of its traditional fossil-based fuels with alternatives which are fully or partially classed as carbon neutral.
Disregarded sites
Sapphire Mill was initially considered, since it manufactures paper towels. However, upon further investigation, we found that the site sources heat and power demands via natural gas. This was reflected in the SPRI database which shows no mention of biogenic emissions.
The sites Pulp Mill House and Robert Cullen Ltd were all considered due their work in manufacturing moulded pulp. However, since no information was available on their site operations then they were removed from the analysis.
BECCS AD
The sites considered were identified using the NNFCC database and REPD.
| Plant | Owner | Operational Status | Type of Technology | Gross Electrical Capacity (MWe) | Feedstock Capacity (t/year) | Data source |
|---|---|---|---|---|---|---|
| Rainton Farm | D Finlay & Son | Operational | BECCS AD (CHP) | 0.025 | 2,500 | NNFCC |
| Loanhead Farm | N Poett | Operational | BECCS AD (CHP) | 0.05 | 2,000 | NNFCC |
| Carterhaugh Farm | BQ Farming Partnership | Operational | BECCS AD (CHP) | 0.195 | 2,000 | NNFCC |
| Genoch Mains Farm | Mr J McIntosh | Operational | BECCS AD (CHP) | 0.225 | 17,500 | NNFCC |
| Genoch Mains Farm (Extension) | Mr J McIntosh | Operational | BECCS AD (CHP) | 0.237 | 17,500 | NNFCC |
| Kirkton Farm | Kirkton Farm | Operational | BECCS AD (CHP) | 0.475 | 2,000 | NNFCC |
| Wester Clockeasy Farm | AGTEC | Operational | BECCS AD (CHP) | 0.125 | 5,000 | NNFCC |
| Dronley Farm AD | Dronley Farming Ltd | Operational | BECCS AD (CHP) | 0.0623 | 3,000 | NNFCC |
| East Reston Farm AD | RH & DH Allan | Operational | BECCS AD (CHP) | 0.076 | 3,500 | NNFCC |
| Mains of Fortrie AD | D Bartlet & Son | Operational | BECCS AD (CHP) | 0.076 | 3,500 | NNFCC |
| Old Ballikinrain House AD | M Percy Ltd | Operational | BECCS AD (CHP) | 0.076 | 3,500 | NNFCC |
| Forthar Farm AD | J&C Wilson | Operational | BECCS AD (CHP) | 0.1275 | 5,000 | NNFCC |
| Meinside AD | Mein Farming Ltd | Operational | BECCS AD (CHP) | 0.088 | 4,500 | NNFCC |
| Baltier Farm | Baltier Farm | Operational | BECCS AD (CHP) | 0.5 | 10,000 | NNFCC |
| Girvan Road AD | AGTEC | Operational | BECCS AD (CHP) | 0.098 | 7,000 | NNFCC |
| Lemington Farm AD | Greenshields Agri Ltd | Operational | BECCS AD (CHP) | 0.18 | 8,000 | NNFCC |
| Mayfield Farm | PALL | Operational | BECCS AD (CHP) | 0.2 | 7,000 | NNFCC |
| Balmangan Farm | Mathers Dairy Utensils | Operational | BECCS AD (CHP) | 0.124 | 5,500 | NNFCC |
| Crofthead farm | W Callander | Operational | BECCS AD (CHP) | 0.124 | 3,000 | NNFCC |
| Slacks Farm | D Kincaid | Operational | BECCS AD (CHP) | 0.124 | 3,000 | NNFCC |
| Standingstone Farm | Mathers Dairy Utensils | Operational | BECCS AD (CHP) | 0.124 | 5,500 | NNFCC |
| East Denside Farm | M Forbes | Operational | BECCS AD (CHP) | 0.243 | 5000 | NNFCC |
| Knockrivoch Farm | Knockrivoch Farm | Operational | BECCS AD (Heat only) | 0.15* | 480 | NNFCC |
| East Knockbrex AD | Iain Service & Co Ltd | Operational | BECCS AD (CHP) | 0.154 | 12,800 | NNFCC |
| Littleton Farm (2) | Mathers Dairy Utensils | Operational | BECCS AD (CHP) | 0.19 | 5,500 | NNFCC |
| Harpers Transport AD | Harpers Transport | Operational | BECCS AD (CHP) | 0.197 | 10,000 | NNFCC |
| Ignis Wick AD | Ignis Wick Ltd | Operational | BECCS AD (CHP) | 0.197 | 6,000 | NNFCC |
| Balmachie Farm AD | JF Lascelles | Operational | BECCS AD (CHP) | 0.086 | 4,000 | NNFCC |
| Slains Park Farm | J Forbes | Operational | BECCS AD (CHP) | 0.399 | 8,000 | NNFCC |
| Standhill Farm | JG Shanks & Son | Operational | BECCS AD (CHP) | 0.185 | 11,000 | NNFCC |
| Woodside Farm | AGTEC | Operational | BECCS AD (CHP) | 0.1792 | 5,228 | NNFCC |
| Balmenach Distillery | Inver House Distillers | Operational | BECCS AD (CHP) | 0.25 | 5,000 | NNFCC |
| Auchencheyne AD | Auchencheyne Ltd | Operational | BECCS AD (CHP) | 0.1275 | 5,000 | NNFCC |
| Girvan Mains Farm | AB Young | Operational | BECCS AD (CHP) | 0.238 | 8,000 | NNFCC |
| Allerbeck Farm | Wyseby Hill Ltd | Operational | BECCS AD (CHP) | 0.093 | 5,770 | NNFCC |
| Camieston Farm AD | Camieston Renewables Ltd | Operational | BECCS AD (CHP) | 0.485 | 18,000 | NNFCC |
| Kinknockie Farm | Yorston & Sinclair | Operational | BECCS AD (CHP) | 0.457 | 9,500 | NNFCC |
| Gask Farm | J Rennie & Son | Operational | BECCS AD (CHP) | 0.46 | 15,000 | NNFCC |
| Broadwigg Farm | N Forsyth & Son | Operational | BECCS AD (CHP) | 0.465 | 28,000 | NNFCC |
| North British Distillery AD | North British Distillery | Operational | BECCS AD (CHP) | 0.479 | 9,855 | NNFCC |
| Bendochy Farm | ET Bioenergy | Operational | BECCS AD (CHP) | 0.44 | 9,500 | NNFCC |
| Claylands Farm | Strathendrick Biogas | Operational | BECCS AD (CHP) | 0.499 | 30,000 | NNFCC |
| Dailuaine Distillery | Diageo | Operational | BECCS AD (CHP) | 0.5 | 15,000 | NNFCC |
| Edge Farm Composting | GP Green Recycling | Operational | BECCS AD (CHP) | 0.5 | 12,000 | NNFCC |
| Glendullan Distillery | Diageo | Operational | BECCS AD (CHP) | 0.5 | 15,000 | NNFCC |
| Levenseat Recycling facility | Levenseat | Operational | BECCS AD (CHP) | 0.5 | 25,000 | NNFCC |
| Pure Malt Products | Pure Malt Products | Operational | BECCS AD (CHP) | 0.5 | 25,000 | NNFCC |
| Roseisle Speyside Whisky Distillery | Diageo | Operational | BECCS AD (CHP) | 0.5 | 47,450 | NNFCC |
| Charlesfield Farm | Hoddom & Kinmount Estates | Operational | BECCS AD (CHP) | 0.475 | 11,200 | NNFCC |
| Glenmorangie Distillery | Glenmorangie | Operational | BECCS AD (Heat only) | 940 | 0 | NNFCC |
| Wester Alves Farm | Wester Alves Biogas | Operational | BECCS AD (CHP) | 0.8 | 25,000 | NNFCC |
| Wester Kerrowgair Farm | Qila Energy | Operational | BECCS AD (CHP) | 0.45 | 20,650 | NNFCC |
| GSK Irvine | GlaxoSmithKline | Operational | BECCS AD (CHP) | 0.98 | 10,000 | NNFCC |
| Deerdykes Composting and Organics Recycling Facility | Scottish Water Horizons | Operational | BECCS AD (CHP) | 1 | 30,000 | NNFCC |
| Auchentoshan Distillery | Morrison Bowmore Distillers | Operational | BECCS AD (CHP) | 0.5 | 20,000 | NNFCC |
| West Roucan Farm | J Cunnigham-Jardine | Operational | BECCS AD (CHP) | 0.95 | 20,000 | NNFCC |
| Lochhead Landfill (Dry-AD) | Fife Council | Operational | BECCS AD (CHP) | 1.14 | 45,000 | NNFCC |
| Binn Farm AD | TEG Biogas | Operational | BECCS AD (CHP) | 1.4 | 30,000 | NNFCC |
| Barkip AD | SSE | Operational | BECCS AD (CHP) | 2.2 | 75,000 | NNFCC |
| Charlesfield Industrial Estate (2) | Iona Capital | Operational | BECCS AD (CHP) | 3 | 36,000 | NNFCC |
| Glenfiddich Distillery AD (Extension) | William Grant and Sons Distillers | Permission Granted | BECCS AD (CHP) | 2 | 0 | REPD |
| Skeddoway Farm | RM Brown & Son | Operational | BECCS AD (CHP) | 2 | 0 | NNFCC |
| Energen biogas Cumbernauld | Bio Capital Limited | Operational | BECCS AD (CHP) | 2.4 | 0 | REPD |
| Balmcassie Commercial Park - Anaerobic digestion plant | Brewdog Limited | Under Construction | BECCS AD (CHP) | 3.5 | 0 | REPD |
| Academy Road - Energy Centre & Anaerobic Digestion Facility | Grissan Engineering Services Limited | Permission Granted | BECCS AD (CHP) | 4 | 0 | REPD |
| Glasgow Renewable Energy and Recycling Centre | Viridor | Operational | BECCS AD (CHP) | 4 | 100,000 | NNFCC |
| Cameron Bridge Distillery | Diageo | Operational | BECCS AD (CHP) | 5.5 | 90,000 | NNFCC |
*Heat only site so units are kWth
BECCS Fermentation
This data from whisky distilleries was taken from Whisky Invest Direct[165], [166] and for beer producing sites from the Scottish Carbon Capture Storage (SCCS)[92].
| Plant | Owner | Operational Status | Type of Technology | Alcohol production Capacity (MLPA) | Data source |
|---|---|---|---|---|---|
| Cameronbridge | Diageo | Operational | Grain whisky | 110 | Whisky Invest Direct |
| Girvan | William Grant & Sons | Operational | Grain whisky | 110 | Whisky Invest Direct |
| Invergordon | Whyte & MacKay | Operational | Grain whisky | 36 | Whisky Invest Direct |
| Strathclyde | Chivas Brothers | Operational | Grain whisky | 39 | Whisky Invest Direct |
| Starlaw/Glen Turner Distillery | La Martiniquaise | Operational | Grain whisky | 25 | Whisky Invest Direct |
| Loch Lomond (Grain) | Loch Lomond Group | Operational | Grain whisky | 18 | Whisky Invest Direct |
| Reivers | Mossburn Distillery Co. | Operational | Grain whisky | 0.1 | Whisky Invest Direct |
| Glenlivet | Chivas Brothers Ltd. (Pernod Ricard) | Operational | Malt whisky | 21 | Whisky Invest Direct |
| Glenfiddich | William Grant & Sons | Operational | Malt whisky | 21 | Whisky Invest Direct |
| Macallan | The Edrington Group | Operational | Malt whisky | 15 | Whisky Invest Direct |
| Ailsa Bay | William Grant & Sons | Operational | Malt whisky | 12 | Whisky Invest Direct |
| Glen Ord | Diageo | Operational | Malt whisky | 11.5 | Whisky Invest Direct |
| Roseisle | Diageo | Operational | Malt whisky | 10.8 | Whisky Invest Direct |
| Dalmunach | Chivas Brothers Ltd. (Pernod Ricard) | Operational | Malt whisky | 10.5 | Whisky Invest Direct |
| Teaninich | Diageo | Operational | Malt whisky | 10.2 | Whisky Invest Direct |
| Glenmorangie | The Glenmorangie Co. (LVMH) | Operational | Malt whisky | 6.5 | Whisky Invest Direct |
| Glen Grant | Campari Group | Operational | Malt whisky | 6.1 | Whisky Invest Direct |
| Glen Moray | Glen Turner (La Martiniquaise) | Operational | Malt whisky | 6 | Whisky Invest Direct |
| Dufftown | Diageo | Operational | Malt whisky | 5.9 | Whisky Invest Direct |
| Miltonduff | Chivas Brothers Ltd. (Pernod Ricard) | Operational | Malt whisky | 5.8 | Whisky Invest Direct |
| Glen Keith | Chivas Brothers Ltd. (Pernod Ricard) | Operational | Malt whisky | 5.7 | Whisky Invest Direct |
| Auchroisk | Diageo | Operational | Malt whisky | 5.7 | Whisky Invest Direct |
| Balvenie | William Grant & Sons | Operational | Malt whisky | 5.6 | Whisky Invest Direct |
| Glenrothes | The Edrington Group | Operational | Malt whisky | 5.5 | Whisky Invest Direct |
| Tomatin | Tomatin Distillery Co. | Operational | Malt whisky | 5 | Whisky Invest Direct |
| Ardmore | Beam Suntory | Operational | Malt whisky | 4.9 | Whisky Invest Direct |
| Tormore | Elixir Distillers | Operational | Malt whisky | 4.9 | Whisky Invest Direct |
| Dailuaine | Diageo | Operational | Malt whisky | 4.9 | Whisky Invest Direct |
| Loch Lomond (Malt) | Loch Lomond Group | Operational | Malt whisky | 4.75 | Whisky Invest Direct |
| Longmorn | Chivas Brothers Ltd. (Pernod Ricard) | Operational | Malt whisky | 4.7 | Whisky Invest Direct |
| Clynelish | Diageo | Operational | Malt whisky | 4.7 | Whisky Invest Direct |
| Allt-a-Bhainne | Chivas Brothers Ltd. (Pernod Ricard) | Operational | Malt whisky | 4.5 | Whisky Invest Direct |
| Braeval | Chivas Brothers Ltd. (Pernod Ricard) | Operational | Malt whisky | 4.5 | Whisky Invest Direct |
| Kininvie | William Grant & Sons | Operational | Malt whisky | 4.4 | Whisky Invest Direct |
| Glenburgie | Chivas Brothers Ltd. (Pernod Ricard) | Operational | Malt whisky | 4.3 | Whisky Invest Direct |
| Dalmore | Whyte & Mackay (Emperador) | Operational | Malt whisky | 4.3 | Whisky Invest Direct |
| Speyburn | Inver House Distillers (Thai Beverages plc) | Operational | Malt whisky | 4.2 | Whisky Invest Direct |
| Craigellachie | John Dewar & Sons (Bacardi) | Operational | Malt whisky | 4.2 | Whisky Invest Direct |
| Tamnavulin | Whyte & Mackay (Emperador) | Operational | Malt whisky | 4.2 | Whisky Invest Direct |
| Glentauchers | Chivas Brothers Ltd. (Pernod Ricard) | Operational | Malt whisky | 4.1 | Whisky Invest Direct |
| Royal Brackla | John Dewar & Sons (Bacardi) | Operational | Malt whisky | 4.1 | Whisky Invest Direct |
| Tamdhu | Ian Macleod Distillers | Operational | Malt whisky | 4 | Whisky Invest Direct |
| Glenfarclas | J. & G. Grant | Operational | Malt whisky | 4 | Whisky Invest Direct |
| Glenallachie | The Glenallachie Distillers Co. | Operational | Malt whisky | 4 | Whisky Invest Direct |
| Aberlour | Chivas Brothers Ltd. (Pernod Ricard) | Operational | Malt whisky | 3.8 | Whisky Invest Direct |
| Mortlach | Diageo | Operational | Malt whisky | 3.8 | Whisky Invest Direct |
| Linkwood | Diageo | Operational | Malt whisky | 3.7 | Whisky Invest Direct |
| Benrinnes | Diageo | Operational | Malt whisky | 3.6 | Whisky Invest Direct |
| Glendullan | Diageo | Operational | Malt whisky | 3.6 | Whisky Invest Direct |
| Macduff [Glen Deveron] | John Dewar & Sons (Bacardi) | Operational | Malt whisky | 3.4 | Whisky Invest Direct |
| Tomintoul | Angus Dundee Distillers | Operational | Malt whisky | 3.3 | Whisky Invest Direct |
| Cardhu | Diageo | Operational | Malt whisky | 3.3 | Whisky Invest Direct |
| Aberfeldy | John Dewar & Sons (Bacardi) | Operational | Malt whisky | 3.3 | Whisky Invest Direct |
| Laphroaig | Beam Suntory | Operational | Malt whisky | 3.275 | Whisky Invest Direct |
| Inchgower | Diageo | Operational | Malt whisky | 3.2 | Whisky Invest Direct |
| Aultmore | John Dewar & Sons (Bacardi) | Operational | Malt whisky | 3.2 | Whisky Invest Direct |
| Talisker | Diageo | Operational | Malt whisky | 3 | Whisky Invest Direct |
| Tullibardine | Picard Vins & Spiriteaux | Operational | Malt whisky | 2.9 | Whisky Invest Direct |
| BenRiach | Benriach Distillery Co. (Brown Forman) | Operational | Malt whisky | 2.8 | Whisky Invest Direct |
| Glenlossie | Diageo | Operational | Malt whisky | 2.8 | Whisky Invest Direct |
| Balmenach | Inver House Distillers (Thai Beverages plc) | Operational | Malt whisky | 2.8 | Whisky Invest Direct |
| Deanston | Burn Stewart Distillers (Distell International) | Operational | Malt whisky | 2.7 | Whisky Invest Direct |
| Glen Elgin | Diageo | Operational | Malt whisky | 2.6 | Whisky Invest Direct |
| Mannochmore | Diageo | Operational | Malt whisky | 2.6 | Whisky Invest Direct |
| Strathisla | Chivas Brothers Ltd. (Pernod Ricard) | Operational | Malt whisky | 2.5 | Whisky Invest Direct |
| Blair Athol | Diageo | Operational | Malt whisky | 2.5 | Whisky Invest Direct |
| Glenkinchie | Diageo | Operational | Malt whisky | 2.5 | Whisky Invest Direct |
| Fettercairn | Whyte & Mackay (Emperador) | Operational | Malt whisky | 2.3 | Whisky Invest Direct |
| Cragganmore | Diageo | Operational | Malt whisky | 2.2 | Whisky Invest Direct |
| Dalwhinnie | Diageo | Operational | Malt whisky | 2.2 | Whisky Invest Direct |
| Auchentoshan | Beam Suntory | Operational | Malt whisky | 2.15 | Whisky Invest Direct |
| Ben Nevis | Ben Nevis Distillery Ltd (Nikka, Asahi Breweries) | Operational | Malt whisky | 2 | Whisky Invest Direct |
| Strathmill | Diageo | Operational | Malt whisky | 2 | Whisky Invest Direct |
| Inchdairnie | Inchdairnie Distillery Ltd | Operational | Malt whisky | 2 | Whisky Invest Direct |
| Glendronach | Benriach Distillery Co. (Brown Forman) | Operational | Malt whisky | 1.8 | Whisky Invest Direct |
| Balblair | Inver House Distillers (Thai Beverages plc) | Operational | Malt whisky | 1.8 | Whisky Invest Direct |
| Knockdhu [AnCnoc] | Inver House Distillers (Thai Beverages plc) | Operational | Malt whisky | 1.8 | Whisky Invest Direct |
| Borders | The Three Stills Co. Ltd | Operational | Malt whisky | 1.8 | Whisky Invest Direct |
| Glen Spey | Diageo | Operational | Malt whisky | 1.6 | Whisky Invest Direct |
| Bladnoch | Bladnoch Distillery Ltd | Operational | Malt whisky | 1.5 | Whisky Invest Direct |
| Glencadam | Angus Dundee Distillers | Operational | Malt whisky | 1.4 | Whisky Invest Direct |
| Knockando | Diageo | Operational | Malt whisky | 1.4 | Whisky Invest Direct |
| Pulteney | Inver House Distillers (Thai Beverages plc) | Operational | Malt whisky | 1.4 | Whisky Invest Direct |
| Glen Garioch | Beam Suntory | Operational | Malt whisky | 1.3 | Whisky Invest Direct |
| Glengoyne | Ian Macleod Distillers | Operational | Malt whisky | 1.1 | Whisky Invest Direct |
| Glenglassaugh | Benriach Distillery Co. (Brown Forman) | Operational | Malt whisky | 1 | Whisky Invest Direct |
| Ardross | Greenwood Distillers | Operational | Malt whisky | 1 | Whisky Invest Direct |
| Oban | Diageo | Operational | Malt whisky | 0.8 | Whisky Invest Direct |
| Brora/Clynelish Distillery | Diageo | Operational | Malt whisky | 0.8 | Whisky Invest Direct |
| Falkirk | Falkirk Distilling Co. | Operational | Malt whisky | 0.75 | Whisky Invest Direct |
| Glengyle | J & A Mitchell | Operational | Malt whisky | 0.75 | Whisky Invest Direct |
| Springbank | J & A Mitchell | Operational | Malt whisky | 0.75 | Whisky Invest Direct |
| Glen Scotia | Loch Lomond Group | Operational | Malt whisky | 0.75 | Whisky Invest Direct |
| Aberargie | The Perth Distilling Co. | Operational | Malt whisky | 0.75 | Whisky Invest Direct |
| Burn o'Bennie | Mike Bain & Liam Pennycook | Operational | Malt whisky | 0.69 | Whisky Invest Direct |
| Speyside | Speyside Distillers Co. | Operational | Malt whisky | 0.6 | Whisky Invest Direct |
| Royal Lochnagar | Diageo | Operational | Malt whisky | 0.5 | Whisky Invest Direct |
| Benromach | Gordon & MacPhail | Operational | Malt whisky | 0.5 | Whisky Invest Direct |
| Bonnington | John Crabbie & Co. | Operational | Malt whisky | 0.5 | Whisky Invest Direct |
| Glenturret | Lalique Group | Operational | Malt whisky | 0.5 | Whisky Invest Direct |
| Clydeside | Morrison Glasgow Distillers | Operational | Malt whisky | 0.5 | Whisky Invest Direct |
| Torabhaig | Mossburn Distillers | Operational | Malt whisky | 0.5 | Whisky Invest Direct |
| Ardnamurchan | Adelphi Distillery Ltd | Operational | Malt whisky | 0.45 | Whisky Invest Direct |
| Glasgow | The Glasgow Distillery Co. | Operational | Malt whisky | 0.44 | Whisky Invest Direct |
| Eden Mill | Paul Miller | Operational | Malt whisky | 0.3 | Whisky Invest Direct |
| Edradour No.2 | Signatory Vintage Scotch Whisky Co. Ltd | Operational | Malt whisky | 0.27 | Whisky Invest Direct |
| Annandale | Annandale Distillery Co. | Operational | Malt whisky | 0.26 | Whisky Invest Direct |
| Arbikie | Arbikie Distilling Ltd | Operational | Malt whisky | 0.25 | Whisky Invest Direct |
| Holyrood | Holyrood Distillery Ltd. | Operational | Malt whisky | 0.25 | Whisky Invest Direct |
| Lindores Abbey | The Lindores Distilling Co. | Operational | Malt whisky | 0.25 | Whisky Invest Direct |
| Kingsbarns | Wemyss Vintage Malts | Operational | Malt whisky | 0.205 | Whisky Invest Direct |
| Lone Wolf | Brewdog plc. | Operational | Malt whisky | 0.2 | Whisky Invest Direct |
| Lochlea | Lochlea Distilling Co. | Operational | Malt whisky | 0.18 | Whisky Invest Direct |
| Wolfburn | Aurora Brewing Ltd | Operational | Malt whisky | 0.175 | Whisky Invest Direct |
| GlenWyvis | GlenWyvis Distillery Ltd | Operational | Malt whisky | 0.15 | Whisky Invest Direct |
| Strathearn | Douglas Laing | Operational | Malt whisky | 0.14 | Whisky Invest Direct |
| Edradour | Signatory Vintage Scotch Whisky Co. Ltd | Operational | Malt whisky | 0.135 | Whisky Invest Direct |
| Nc'nean | Drimnin Distillery Co. | Operational | Malt whisky | 0.1 | Whisky Invest Direct |
| Ballindalloch | MacPherson-Grant | Operational | Malt whisky | 0.1 | Whisky Invest Direct |
| Daftmill | Francis Cuthbert | Operational | Malt whisky | 0.065 | Whisky Invest Direct |
| Dornoch | Phil & Simon Thompson | Operational | Malt whisky | 0.025 | Whisky Invest Direct |
| Tennent Caledonian | Wellpark Brewery | Operational | Beer production | 8.36 | SCCS |
| Belhaven | Belhaven | Operational | Beer production | 0.51 | SCCS |
BECCS EfW/ACT
The sites considered were identified using the REPD and relevant websites/blog posts.
| Plant | Owner | Operational Status | Type of Technology | Gross Electrical Capacity (MWe) | Fuel source | Data source |
|---|---|---|---|---|---|---|
| Thainstone Energy Park Project ERF | Agile Energy Recovery | Application Submitted | BECCS EfW | 35 | MSW | REPD |
| Dunbar EfW (previously Oxwellmains EfW) | Viridor | Operational | BECCS EfW | 25.6 | MSW | REPD |
| Westfield (former Opencast Coal Mine) | Brockwell Energy | Under Construction | BECCS EfW | 23.7 | MSW | Website[167] Blog post[168] |
| CalaChem Fine Chemicals (Grangemouth) - Earlsgate Energy Centre | Brockwell Energy, Covanta and Green Investment Group | Under Construction | BECCS EfW (CHP) | 21.5 | MSW | REPD |
| South Clyde Energy Centre | Fortum (formerly Peel Environmental) | Under Construction | BECCS EfW | 20 | MSW | REPD |
| Oldhall Industrial Estate | Dover Yard | Permission Granted | BECCS EfW | 15 | MSW | REPD |
| Millerhill EfW | FCC Environment | Operational | BECCS EfW | 12.5 | MSW | REPD |
| Barr Killoch Energy Recovery Park | Barr Environmental Limited | Application Submitted | BECCS EfW | 12 | RDF | REPD |
| Ness Energy Project | Aberdeen / Aberdeenshire / Moray Councils | Under Construction | BECCS EfW (CHP) | 11.1 | MSW | REPD |
| Baldovie Industrial Estate (Forties Road) | MVV Environment | Under Construction | BECCS EfW (CHP) | 10 | MSW | REPD |
| Baldovie | Dundee Energy Recycling | Operational | BECCS EfW | 8.3 | MSW | REPD |
| Binn Farm EfW | Binn Group | Permission Granted | BECCS EfW | 7.3 | MSW | REPD |
| Polmont landfill site EfW | NPL Group | Planning application submitted | BECCS EfW | 7.4 | MSW | News paper[169] |
| Drumgray Energy Recovery Centre (DERC) | FCC | Planning granted | BECCS EfW (CHP) | 25.5 | MSW | Blog post[170] |
| Charlesfield Biomass CHP Plant | Charlesfield First LLP & Biogas Power | Operational | BECCS EfW ACT (CHP) | 10 | MSW | REPD |
| Coatbridge Material Recovery and Renewable Energy Facility | Golder Associates (UK) Ltd/ Shore Energy | Under Construction | BECCS EfW ACT (CHP) | 25 | MSW | REPD |
| Levenseat Waste Management Facility | Levenseat | Permission Granted | BECCS EfW ACT (CHP) | 17 | RDF | REPD |
| Levenseat EfW | Levenseat | Operational | BECCS EfW ACT | 12.5 | RDF | REPD |
| Glasgow Renewable Energy and Recycling Centre (ACT) | Viridor | Operational | BECCS EfW ACT (CHP) | 10 | MSW | REPD |
| Achnabreck | Northern Energy Developments | Permission Granted | BECCS Power ACT (CHP) | 5.5 | Wood pellets | REPD |
| Binn Eco Park | SITA UK/Binn Group | Permission Granted | BECCS EfW ACT | 4.6 | RDF | REPD |
| Avondale Quarry (Pilot) | Grangemouth Generation Ltd | Operational | BECCS EfW ACT | 2 | MSW | REPD |
Carbon Capture Calculations
The following section provides an overview of the modelling parameters and methodology used to estimate the CO2 capture potential of each NET.
BECCS Biomethane
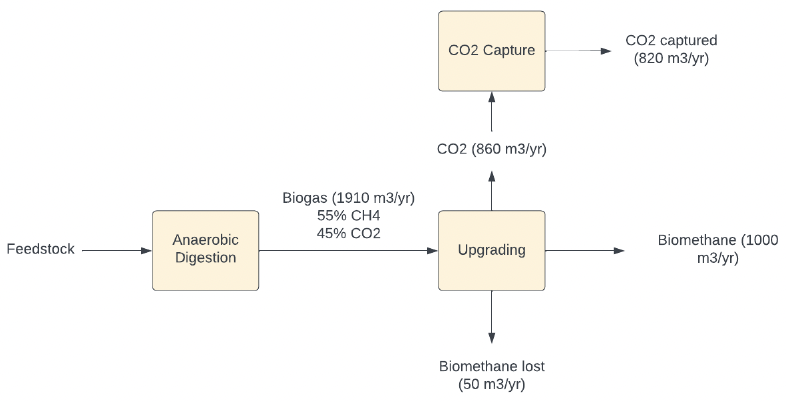
We utilised a simple mass balance to determine the CO2 capture potential of a biomethane facility (see Figure 19 below). The methodology used was as follows:
1.) Since we know the amount of biomethane produced hourly, taken from the NNFCC or estimated using the REPD, then we can estimate the annual biomethane production rate by assuming standard operating hours of 6,000 hr/year (this is equivalent to a utilisation factor of 68%).
2.) The amount of methane directed to the upgrading facility, from the anaerobic digestor, can be determined by assuming that 4.7% of the methane entering the upgrader is lost to the surroundings[171].
3.) The amount of biogas and CO2 directed towards the upgrading facility can be determined by assuming a biogas composition of 55:45 methane to CO2 (on a volumetric basis)[171].
4.) By assuming that the biogas exiting the anaerobic digestor is under normal conditions (i.e., at 25 degC and 1 atm) then the mass of CO2 entering the CO2 capture unit can be determined using a density of 1.795 kg/m3.
5.) The CO2 production potentials determining using this mass balance method were compared to mass balance benchmarks found in a LCA paper (0.00161 tCO2/m3,biomethane)[132]. The values were found to be very close to one another and hence confirms our assumptions and calculations are valid.
6.) The capture potential was finally determined by applying a CO2 capture efficiency of 95%.
The comparison of CO2 production potentials through our mass balance method and that of the LCA mass balance benchmarks are shown below in Table 47. The values are very close, deviating by +- 0.002 MtCO2/year, validating our assumptions and calculations.
| Site | CO2 generated from upgrading (Mt/year) | |
|---|---|---|
| General Mass Balance | LCA Mass Balance | |
| Portgordon Maltings Beyside | 0.007 | 0.008 |
| Brae of Pert Farm | 0.005 | 0.005 |
| Charlesfield Industrial Estate | 0.005 | 0.005 |
| Cumbernauld AD | 0.005 | 0.005 |
| Downiehills Farm | 0.005 | 0.005 |
| Girvan Distillery | 0.025 | 0.027 |
| Glenfiddich Distillery | 0.018 | 0.019 |
| Hatton Farm AD | 0.004 | 0.004 |
| Inchdairnie Farm | 0.005 | 0.005 |
| Invergordon Distillery | 0.005 | 0.005 |
| Keithick Farm | 0.006 | 0.006 |
| Lockerbie Creamery | 0.007 | 0.007 |
| Morayhill AD | 0.005 | 0.005 |
| Peacehill Farm | 0.005 | 0.005 |
| Rosskeen Farm | 0.004 | 0.004 |
| Savock Farm | 0.006 | 0.006 |
| Tambowie Farm | 0.002 | 0.002 |
| TECA AD | 0.004 | 0.004 |
| Portgordon Maltings - Anaerobic Digestion Facility, Phase 2 | 0.018 | 0.019 |
| Lockerbie Creamery - Anaerobic Digester | 0.008 | 0.009 |
BECCS Power and Industry (Wood)
As described in the Data Sources section, all the BECCS Industry (Wood) sites considered in our study employ biomass boilers or CHPs on-site. These units are the focus for potential CCS implementation, enabling negative emissions similar to BECCS Power sites. Consequently, our carbon and cost calculations will adopt the same methodology and utilise identical parameters for BECCS Power and Industry (Wood).
To determine the CO2 capture potential of a power only, CHP or heat only site, we carried out the following:
1.) The fuel input rate going into the CHP or power plant was determined by back-calculating from the gross electrical capacity, quoted in the REPD, using an assumed electrical efficiency of 38.7% for power only sites and 25% for CHPs[46]. If the site is heat only then a heat efficiency of 80% is used.
2.) The CO2 production rate was then determined by applying a conversion factor of 0.35 kgCO2/kWh,fuel using the BEIS greenhouse gas reporting conversion factors[93], taken from the ‘Outside of Scopes’ tab.
3.) The CO2 capture potential of the site was then determined using an assumed capture efficiency of 90%.
An example calculation for Caledonian Papermill is provided in Box 1 below.
Box 1: CO2 capture potential, BECCS Power calculation
Caledonian Papermill (26 MWe CHP).


To ensure the validity of our assumptions and data sources, the CO2 production potential of the BECCS Power and Industry (Wood) sites were compared to values from the SPRI Database[172]. The comparison revealed a general alignment between the values, as demonstrated in below. It is worth noting that data for most BECCS Power sites was unavailable in the SPRI Database due to their low gross capacities. This further supports the reasonableness of our assumptions and data sources.
| Site | NET | REPD (MtCO2/year) | SPRI (MtCO2/year) |
|---|---|---|---|
| Markinch Biomass CHP Plant | BECCS Power (CHP) | 0.717444 | 0.371911 |
| Stevens Croft | BECCS Power | 0.359363721 | 0.388518964 |
| Westfield Biomass Power Station | BECCS Power | 0.089127907 | 0.108348 |
| Caledonian Papermill | BECCS Industry CHP (paper - coated magazine) | 0.2869776 | 0.3012053 |
| Cowie Biomass Facility | BECCS Industry CHP (Particle & MDF) | 0.165564 | 0.264579705 |
| Invergordon Pellet Mill | BECCS Industry CHP (wood pellets) | 0.055188 | N/A |
| Morayhill Mill | BECCS Industry (Oriented Strand Board) | 0.344925 | 0.19257725 |
| Barony Road, Auchinleck | BECCS Industry CHP (Chipboard and wood recycling) | 0.0607068 | 0.020513208 |
BECCS Cement
Due to limited data availability for calculating the CO2 capture potential, we relied on the CO2 emissions rate provided by the SPRI database to estimate our own CO2 capture potential. To determine the portion of emissions considered biogenic, we assumed that approximately 40% of cement emissions result from the combustion of fossil fuels[173]. Additionally, considering that Dunbar Cement intends to utilise a fuel mix composed of 45% RDF/SRF waste, with a biogenic content of 17%[174], we determined the quantity of emissions classified as biogenic.
BECCS AD
For the AD sites, we assume that all generated biogas is converted into biomethane, with a small portion being utilised by an onsite CHP to meet onsite requirements. With these assumptions, we can determine the maximum CO2 capture potential for each site.
To determine the CO2 capture potential, we carried out the following:
1.) The feedstock input data, provided via the NNFCC Database, was utilised to determine the biogas production rate using a feedstock to biogas mass balance benchmark taken from an LCA paper (0.17 kg,biogas/kg,feedstock).
2.) The volume of biogas produced is then determined using an assumed biogas density of 1.2 kgm-3.
3.) The CO2 and biomethane production rate are calculated using the assumed biogas composition of 55:45 methane to CO2 on a volumetric basis. The mass of CO2 produced can then be determined using the density of CO2 under standard conditions (1.795 kgm-3).
4.) Finally, the CO2 capture potential is determined using a CO2 capture efficiency of 95%.
Six of the sites listed in Table 44 lacked data on feedstock input rates, making it difficult to calculate their carbon capture potential. Consequently, additional research was required. Among them, five sites had gross power capacities available in either the REPD or NNFCC databases. For these sites, a similar methodology to that used for BECCS Power/Industry (Wood) could be applied, although with different efficiencies, utilisation factors, and emission conversion factors. As for the remaining heat-only site (‘Glenmorangie Distillery’), its planning application documents indicated a biogas production rate of 8000 m3/day, enabling the determination of its CO2 capture potential using the same methodology as BECCS Biomethane.
An example calculation for the ‘Glenfiddich Distillery AD (Extension)’ site is shown below.
Box 2: AD CO2 capture potential example
The annual electricity production potential is calculated using our utilisation factor of 68%, derived from the assumption that a standard AD site operates at 6000hr/year.

Determine biogas fuel input rate going into the CHP by assuming an CHP electrical efficiency of 25%. The volumetric rate of this input can then be determined by assuming a biogas energy density of 26 MJ/m3.

To determine biomethane production and CO2 capture potential, we assume that all biogas is now upgraded. Using a typical biogas composition of 55:45 methane and CO2 (volume basis), that we exhibit a 5% biomethane losses during upgrading, and a CO2 capture potential of 95%.

BECCS Fermentation
For the brewery sites, we have estimated CO2 capture potentials as well as costs by assuming that the sites operate like industrial bioethanol plants.
To determine the CO2 capture potential, we carried out the following:
1.) The litres of pure alcohol (LPA) produced by each site is provided[92]. We can utilise a CO2 conversion factor of 754.7 tonnes per Ml of alcohol to determine the quantity of CO2 produced.
2.) The CO2 capture potential can then be determined using a capture efficiency of 90%
BECCS EfW/ACT
For EfW/ACT sites, we can apply the same methodology as BECCS Power and Industry (Wood), but with variations in efficiencies, utilisation factors, and emission conversion factors. Another possible approach is to directly calculate CO2 capture potentials by gathering waste input rates from literature. However, we chose not to use this method in order to maintain consistency in our methodology, as well as to reduce errors and discrepancies in assumptions and data sources, enabling a more accurate and meaningful comparison of different NETs on a like-for-like basis.
To determine the CO2 capture potential, we carried out the following:
1.) Firstly, we calculate the waste input rate. For this purpose, we employed a back-calculation approach utilising the electrical gross capacities provided in the REPD data and assuming a plant utilisation factor of 85%[175]. The power-only sites utilised an electrical capacity of 22%, calculated based off data sourced from AECOM and a MSW energy capacity of 10 MJ/kg[77], while an assumed value of 15% was used for CHP sites and 80% heat efficiency for heat only sites.
2.) Based on the waste input rate we can determine the CO2 production potential using conversion factors. Depending on the choice of waste used, which can be either MSW or RDF/SFR, then the CO2 capture potential will change. This is due to three factors: 1.) SRF/RDF is a more energy dense fuel, 2.) MSW is a more carbon intense fuel, and 3.) SRF/RDF has a higher biogenic carbon content (on a mass basis).
3.) A standard 90% capture rate is then employed to determine CO2 capture potential.
An example below for the ‘Thainstone Energy Park Project ERF’ site is provided in Box 3.
Box 3: BECCS EfW example CO2 capture calculation
Determine EfW power efficiency based off AECOM data:
- Waste input = 350,000 t/year
- MSW LHV = 10 MJ/kg (taken from IEAGHG)
- Net power output (pre-CCS) = 25MWe
- Convert net to gross efficiency using a standard industrial scaler of 1.11

Determine waste input using electrical efficiency

Convert waste input into units of mass using the waste energy densities (10 MJ/kg for MSW and 13 MJ/kg for SFR/RDF)
Determine CO2 captured

To double check our calculations, we compared our determined values for waste input against that quoted in the literature (see Table 49 below).
| Site | REPD feedstock input (t/year) | Literature feedstock input (t/year) | Reference |
|---|---|---|---|
| Thainstone Energy Park Project ERF | 422,414 | 200,000 | [176]l |
| Dunbar EfW (previously Oxwellmains EfW) | 308,966 | 300,000 | [177] |
| Westfield (former Opencast Coal Mine) | 286,034 | 200,000 | [178] |
| CalaChem Fine Chemicals (Grangemouth) - Earlsgate Energy Centre | 384,214 | 162,000 | [179] |
| South Clyde Energy Centre | 241,379 | 350,000 | [180] |
| Oldhall Industrial Estate | 181,034 | 180,000 | [181] |
| Millerhill EfW | 150,862 | 152,500 | [182] |
| Barr Killoch Energy Recovery Park | 111,406 | 166,000 | [183] |
| Ness Energy Project | 198,361 | 150,000 | [184] |
| Baldovie Industrial Estate (Forties Road) | 178,704 | 110,000 | [185] |
| Baldovie | 100,172 | 90,000 | [185] |
| Binn Farm EfW | 88,103 | 85,000 | [186] |
| Lerwick Energy Recovery Plant | 19,549 | 26,000 | [187] |
| Polmont landfill site EfW | 89,310 | 150,000 | [188] |
| Drumgray Energy Recovery Centre (DERC) | 455,695 | 300,000 | [189] |
| Charlesfield Biomass CHP Plant | 178704 | 70,000 | [190] |
| Coatbridge Material Recovery and Renewable Energy Facility | 446760 | 160,000 | [191] |
| Levenseat Waste Management Facility | 233689.8462 | 315,000 | [192] |
| Levenseat EfW | 116047.7454 | 215,000 | [192] |
| Glasgow Renewable Energy and Recycling Centre (ACT) | 178704 | 222,000 | [193] |
| Achnabreck | 38413.95275 | N/A | N/A |
| Binn Eco Park | 42705.57029 | 60,000 | [194] |
| Avondale Quarry (Pilot) | 24137.93103 | N/A | N/A |
Please note that for the ‘Achnabreck’ site, we could not utilise the above calculations, since this site plans on gasifying wood. Again, we used the REPD method to determine CO2 production potential, using the same CO2 conversion factor as BECCS Power/Industry (Wood). The feedstock input rate was then calculated using a wood pellet energy density of 4.8 kWh/kg, using that the fuel has a moisture content of 10%[195].
We compared our CO2 production values to the benchmark values provided by Tolvik[196], using a waste to CO2 benchmark of 0.992 kg CO2/kg waste. Our calculations using the REPD method closely aligned with the Tolvik benchmark (refer to Table 50), reinforcing our confidence in our assumptions and methodology. The only site which had significant deviation were: Barr Killoch Energy Recovery Park, Levenseat Waste Management Facility, Levenseat EfW, and Binn Eco Park. and which is planning to burn RDF/SFR fuel instead of MSW. Please note that the Achnabreck site gasifies wood pellets - not waste, and hence cannot be compared against the Tolvik benchmark.
| Site | NET | CO2 production (Mt/year) | Difference (%) | |
|---|---|---|---|---|
| REPD Method | Tolvik benchmark | |||
| Thainstone Energy Park Project ERF | BECCS EfW | 0.423 | 0.419 | 1% |
| Dunbar EfW (previously Oxwellmains EfW) | BECCS EfW | 0.309 | 0.306 | 1% |
| Westfield (former Opencast Coal Mine) | BECCS EfW | 0.286 | 0.284 | 1% |
| CalaChem Fine Chemicals (Grangemouth) - Earlsgate Energy Centre | BECCS EfW (CHP) | 0.384 | 0.381 | 1% |
| South Clyde Energy Centre | BECCS EfW | 0.242 | 0.239 | 1% |
| Oldhall Industrial Estate | BECCS EfW | 0.181 | 0.180 | 1% |
| Millerhill EfW | BECCS EfW | 0.151 | 0.150 | 1% |
| Barr Killoch Energy Recovery Park | BECCS EfW | 0.124 | 0.111 | 11% |
| Ness Energy Project | BECCS EfW (CHP) | 0.198 | 0.197 | 1% |
| Baldovie Industrial Estate (Forties Road) | BECCS EfW (CHP) | 0.179 | 0.177 | 1% |
| Baldovie | BECCS EfW | 0.100 | 0.099 | 1% |
| Binn Farm EfW | BECCS EfW | 0.088 | 0.087 | 1% |
| Lerwick Energy Recovery Plant | BECCS EfW (Heat only) | 0.020 | 0.019 | 1% |
| Polmont landfill site EfW | BECCS EfW | 0.089 | 0.089 | 1% |
| Charlesfield Biomass CHP Plant | BECCS EfW ACT (CHP) | 0.179 | 0.177 | 1% |
| Coatbridge Material Recovery and Renewable Energy Facility | BECCS EfW ACT (CHP) | 0.447 | 0.443 | 1% |
| Levenseat Waste Management Facility | BECCS EfW ACT (CHP) | 0.261 | 0.232 | 11% |
| Levenseat EfW | BECCS EfW ACT | 0.130 | 0.115 | 11% |
| Glasgow Renewable Energy and Recycling Centre (ACT) | BECCS EfW ACT (CHP) | 0.179 | 0.177 | 1% |
| Achnabreck | BECCS Power ACT (CHP) | 0.098 | N/A | N/A |
| Binn Eco Park | BECCS EfW ACT | 0.048 | 0.042 | 11% |
| Avondale Quarry (Pilot) | BECCS EfW ACT | 0.024 | 0.024 | 1% |
Table 51 on the subsequent pages provides summary of the NETs parameters used in the analysis.
Summary of NETs parameters
| NET | Gross Power Efficiency (power only) | Net Power Efficiency (CHP) | Net Heat Efficiency (CHP) | Gross Heat efficiency (heat only) | Utilisation Factor | Conversion Factor (kg/kWh) | Lifespan (years) | CO2 Capture efficiency | Biogenic content of carbon (%mass) | Reference |
|---|---|---|---|---|---|---|---|---|---|---|
| BECCS Biomethane | N/A | N/A | N/A | N/A | Not used | |||||
| 68% | Assumed | |||||||||
| N/A* | Not used | |||||||||
| 20 | [197] | |||||||||
| 95% | Assumed | |||||||||
| 100% | Assumed | |||||||||
| BECCS Power & Industry (Wood) | 38.7% | BEIS, Wood (2018)[45] | ||||||||
| 25% | Assumed | |||||||||
| 37.5% | ||||||||||
| 80% | Assumed | |||||||||
| 90% | Assumed | |||||||||
| 0.35 | BEIS, GHG Reporting[93]** | |||||||||
| 25 | BEIS, Wood (2018)[45] | |||||||||
| 90% | BEIS, Wood (2018)[45] | |||||||||
| 100% | Assumed | |||||||||
| BECCS Cement | N/A | N/A | N/A | N/A | N/A | N/A | Not used | |||
| 30 | IEA | |||||||||
| 90% | BEIS, Wood (2018)[45] | |||||||||
| 3%*** | ||||||||||
| BECCS Fermentation | N/A | N/A | N/A | N/A | N/A | Not used | ||||
| 754.7***** | SCCS Paper[92] | |||||||||
| 30 | l | |||||||||
| 90% | Assumed | |||||||||
| 100% | Assumed | |||||||||
| BECCS EfW/ACT | 22%****** | AECOM[175] | ||||||||
| 15% | Assumed | |||||||||
| 31% | ||||||||||
| 80% | Assumed | |||||||||
| 85% | AECOM[175] | |||||||||
| 0.36 (MSW) 0.31 (RDF/SFR) | IEAGHG[77] | |||||||||
| 20 | AECOM[175] | |||||||||
| 90% | BEIS, Wood (2018)[45] | |||||||||
| 50% (MSW) 17% (RDF/SFR) | IEAGHG[77]and IEA |
*Mass balance used instead
**The greenhouse gas reporting conversion factors used were taken from the ‘Outside of Scopes’ tab.
***We understand that 40% of cement emissions are from combustion, with Dunbar Cement aiming to utilise 45% SFR in their fuel mix which has a biogenic content of 17%.
****This corresponds to the amount of biogas output per tonne of feedstock anaerobically digested. The units are t/t.
*****Units of tonnes of CO2 produced per mega litre of alcohol produced (MLA)
******See calculations above in EfW section to see how this efficiency is derived.
LCOC Methodology
The Levelised Cost of Carbon (LCOC) will serve as a filtering mechanism for potential NETs sites. It supports the determination of whether these sites should be included in subsequent pathway analysis or not; the higher the LCOC the less economically attractive the site.
Sites located on islands were excluded from further analysis due to the complexities involved in transporting the CO2 to a suitable storage location.
| Variable | Meaning | Units |
|---|---|---|
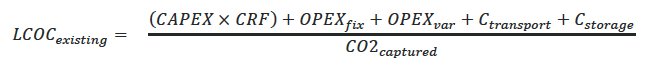
| LCOCexisting | This figure serves as a summary of the economic viability of a particular Negative Emission Technology (NET), acting as an indicator to aid in the selection process among different NETs options. | £/tCO2,captured |
| CAPEX | This figure accounts for the investment cost associated with purchasing, installing, and commissioning plant equipment. | M£ |
| Capital Recovery Factor (CRF) | This figure represents the fraction of the initial capital investment that needs to be recovered each year to cover the cost of the investment. It is used to annualise the investment cost. | N/A, this is a dimensionless quantity |
| OPEXfix | This figure accounts for expenses that remain relatively constant regardless of the level of production. This figure is typically in proportion with the capital expenditure. | £M/year |
| OPEXvar | This figure accounts for expenses that vary in proportion to the level of production. For industrial sites this cost is typically heavily linked to energy costs. | £M/year |
| Ctransport | This figure represents the cost associated with transporting the CO2 to the designated storage site(s). In this report, we have made the assumption that the CO2 can be transported either entirely by truck to St Peterhead, or partially by truck to an injection point, where it is then injected into a pipeline. | £M/year |
| Cstorage | This figure represents the cost of storing the CO2 in the North Sea. In this report, our assumption is based on the utilisation of depleted oil and gas wells, which aligns with the proposed approach of the Acorn project. | £M/year |
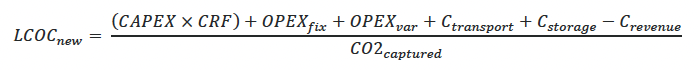
| Crevenue | This figure represents the gain in revenue associated with selling heat and power from BECCS Power, BECCS Industry and BECCS EfW sites. It's important to note that the analysis does not include revenues derived from the sale of biomethane for future BECCS Biomethane and AD Upgrading sites. | £M/year |
| CO2,captured | This figure depicts the quantity of CO2 captured by the NETs site. Please note that this is not the same as the negative emission potential, which does not account for emissions from fossil sources. | MtCO2/year |
Cost Analysis
Capital Expenditure (CAPEX)
In estimating the CAPEX, we employed the widely used sixth-tenths rule, which is a method for approximating costs. According to this rule, the cost of a project can be estimated by taking the cost of a comparable completed project and scaling it by the exponent 0.6, based on the capacity of the reference plant. This scaling can be done by considering various factors such as CO2 capture potential, heat or power production, biomethane production, or any other relevant parameter. An example calculation is provided below.
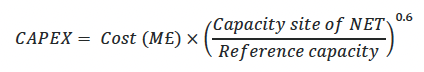
It's important to note that this method provides a quick and rough estimate of costs. However, it should be used with caution, as it may not encompass all the unique aspects and complexities of each specific project. It's worth mentioning that we do not intend to conduct a detailed cost analysis for each NETs site in our current scope, making this method sufficient for our purposes.
Operational Expenditure (OPEX)
The OPEX is divided into two categories: Fixed costs and Variable costs. Fixed OPEX encompasses ongoing expenses that tend to remain consistent regardless of the production or operational level. Examples include salaries, benefits, equipment maintenance, repairs, and insurance. On the other hand, Variable OPEX includes costs that fluctuate based on the level of production or operation. These costs can include raw materials, fuel, maintenance supplies, and energy consumption.
For existing sites, we assumed that the fixed OPEX would amount to 5% of the CAPEX (a typical industrial benchmark), while the variable OPEX would account for increases in fuel/electricity usage alone as this is typically the main source of variable OPEX cost. We could account for additional variable costs; however, this would to a complex cost analysis for each site which is outside of the scope of this project. Although cost benchmarks for Variable and Fixed OPEX were available in the literature, we chose not to utilise them due to significant discrepancies in assumptions and parameters included in the costs, depending on the specific NETs being discussed. As a result, the costs for existing NETs would not be comparable on a like-for-like basis. The exception was the ‘Dunbar Cement’ plant, where site-specific data on heat and power demands was unavailable in the literature, and so we had to rely on benchmarks to determine Variable OPEX.
When evaluating future sites, it was necessary to consider the overall costs associated with both installing and operating a NETs site. To accomplish this, cost benchmarks were employed in their entirety and then scaled up using the sixth-tenths rule. This approach ensured that the complete range of costs were considered for accurate cost estimation. Although this approach may lead to potential cost overestimation, it is not a concern since our objective does not necessitate comparing future sites on a like-for-like basis.
We tested our assumption of fixed OPEX being equivalent to 5% CAPEX, for existing sites, by comparing the respective costs to industrial benchmarks. The overall estimation was reasonably close, as shown below in Table 53. Please note that all cost benchmarks have been scaled to 2023 costs via inflation and converted to pounds sterling.
| NET | 5% assumption (£/tCO2) | Cost benchmark |
|---|---|---|
| BECCS EfW (combustion and ACT) | 16.1 | 15.7[175] |
| BECCS Biomethane | 11.4 | 7[197] |
| BECCS AD Upgrading | 263.3* | N/A, not broken down into fixed and variable OPEX[171] |
| BECCS Fermentation | 2.3 | 3.1[198] |
| BECCS Power and BECCS Industry (Wood) | 4.1 | 3.3[45] |
| BECCS Industry (Cement) | 0.0041** | 0.0037[175]** |
*Please note that AD Upgrading is in units of £/m3/year
**Please note that BECCS Industry (Cement) is in units of £/tclinker/day
BECCS Biomethane
For existing sites, the costs associated with CCS installation encompassed CO2 liquefaction only. This is because biomethane sites already separate out CO2 into a pure stream during the biogas upgrading process, and hence the CO2 capture is more efficient, less energy intensive, and cheaper. The resulting liquefication process takes the capture carbon and removes water and impurities, where the clean CO2 stream is then compressed to high pressures in preparation for transport.
CO2 Liquefication
The initial step of liquefication is to compress the gas to the desired pressure (circa 130 bar) and help it reach its critical temperature. Water is then removed by condensation to prevent hydration and the gas is subsequently cooled (e.g., using a set of heat exchangers or expansion cooling) to transition the gas into a liquid. An impurity removal unit is used to remove impurities when the delivered CO2 needs to meet a high purity requirement.
CAPEX
To determine the CAPEX of liquefication a benchmark was taken from a 2022 techno-economic analysis paper investigating the costs associated with CO2 capture for AD Upgrading sites. The paper considers a reference case of an AD Upgrading facility producing 4400 tCO2 at a CAPEX of 1MEUR.
To determine the CAPEX for future sites, we also have to account for the costs associated with constructing the AD Upgrading and AD plant. These costs were taken from a techno-economic analysis paper that investigates biomethane upgrading via the water scrubbing method, which accounts for investment costs in constructing the biogas plant, silage pit, AD upgrading plant, gas grid connection, and CNG service station. For simplicity, we have assumed the water scrubbing technique is used in all biogas AD Upgrading sites in Scotland, so that this paper can be applied to all biomethane sites. This assumption is reasonable, given the fact that around one third of AD Upgrading sites in the UK use water scrubbing technology, according to the EBA Statistical Report of 2020. However, an improvement opportunity of the analysis is to consider membrane separation costs in the analysis instead.
OPEX
As previously mentioned, the Fixed OPEX for existing sites was taken to be 5%. This assumption was also applied to future sites since the CCS OPEX benchmarks from the 2022 AD Upgrading paper was not clearly broken down.
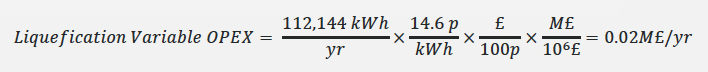
The Variable OPEX for existing sites was calculated by determining the power demands of CO2 liquefication (i.e., powering the compressors and chiller). This method was also used for new sites, again due to an unclear breakdown in CCS OPEX from the 2022 Upgrading paper. The liquefication power demands were taken from a 2019 paper which details a thorough breakdown in cooling and compression power requirements, with compression requiring 12.5 MW and cooling 40.48 MW in order to capture 1 MtCO2/year. We are assuming to compress CO2 to 130 MPa in preparation for transport, which is a standard industrial benchmark.
An example calculation is shown in Box 4 below for the ‘Portgordon Maltings Beyside’ site.
Box 4: Example Variable OPEX calculation process
We use the liquefication power demand of 52.98 MW, in order to capture 1 MtCO2/year, and convert to MJ/kg. We assume standard operating hours of 6000 hr/year for an AD Upgrading site.

To convert to MJ/year, we multiply the energy demand by the CO2 capture potential and scale up using the sixth tenths rule.

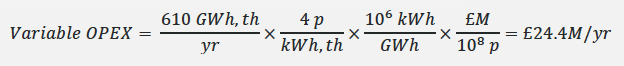
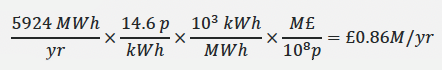
To determine the cost of this power demand, an electricity price of 14.6 p/kWh was used based off Ofgem’s wholesale electricity price. This final cost is taken as the Variable OPEX.
When considering future sites, the Variable OPEX associated with the AD and Upgrading plants was taken from a 2018 paper. The total OPEX was quoted as a single figure, including both fixed and variable OPEX, which accounts for maintenance and overheads, electricity demands, thermal demands, feedstock and disposal costs, plant OPEX, depreciation, and gate fee(s).
Revenue
We did not include revenue sources from biomethane in our analysis because they fall outside the mass/energy balance boundary that we established.
BECCS Power and Industry Wood
The costs for BECCS Power and BECCS Industry (Wood) were taken from the same source. This is because BECCS Industry (Wood) sites either have biomass boilers or biomass powered CHPs onsite that meet onsite demands (as described earlier in Data Sources). The reference is a 2018 BEIS paper (BEIS Wood 2018). This paper examines the costs associated with installing CCS on a 498 MWe bioenergy power station capturing circa 4.2 MtCO2/year.
CAPEX
The sixth tenths rule is applied, where the costs associated with constructing the bioenergy plant and installing the CCS equipment are £813.7M and £322M respectively.
OPEX
Fixed OPEX was taken to be 5% of CAPEX.
To determine Variable OPEX of existing sites, we had to determine the impact installing CCS would have on the NETs power export of a site. In particular, installing CCS requires heat demands of circa 3.4 MJ/kg,CO2, which are sourced by extracting low-pressure steam from the turbine at circa 3 bar. As a result, the overall efficiency of the site decreases by approximately 5%. In our analysis, we have used these drops in NETs efficiency to determine losses in revenue, which is equivalent to an increase in Variable OPEX.
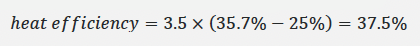
If a site is in fact a CHP, then we have to account for the impacts on both power and heat export. To make this analysis simpler, and avoid the need to undertake multivariable optimisation, we assumed that the power export of a site will remain the same, but the heat export potential is impacted by the CCS heat requirements. This results in NETs power efficiencies remaining constant and heat efficiencies dropping. An electrical efficiency of 25% was assumed for CHP sites, based off CHPQA knowledge, and the resulting heat efficiency (pre-CCS) was determined using a z ratio of 3.5. The price of heat was taken to be 4 p/kWh.
The assumed low price of heat is justified by the fact that we are considering the heat price at the export point rather than the price at which heat is sold directly to the customer, such as 12p/kWh through a third party. In this scenario, the generator sells heat to a third party at 4p/kWh. The third party is responsible for constructing and operating the heat network, which incurs significant costs. Subsequently, the third-party charges the customer for the heat supplied.
Box 5 below is a summary of how Variable OPEX was calculated for “Markinch Biomass CHP Plant”
Box 5: Further example of variable OPEX calculation process
Using the assumed NETs power efficiency of 25%, we can calculate the heat efficiency using the CHP zed ratio of 3.5. This results in a NETs heat efficiency of ~37.5%.
Taking the feedstock input rate, we can determine the heat export potential pre-CCS.

Using a standard CCS heat demand of 3.4 MJ/kg, CO2, we can determine the resulting heat demand of CCS using the annual CO2 capture potential. This enables us to check whether the site can meet CCS demands without the need for the installation of an additional boiler.


Using a heat price of 4p/kWh, we can determine the variable OPEX.
For the Morayhill Mill industrial site, which is a heat only site, we have assumed that the gross boiler efficiency is 80%. The same methodology to CHP sites is then applied, where a heat efficiency post-CCS was found to be 50%.
For future sites, we directly applied the bioenergy and CCS benchmarks quoted in the 2018 BEIS paper to determine fixed and variable OPEX. One key thing to note is that the benchmarks used do not account for fuel usage within the Variable OPEX benchmark. Therefore, a wood pellet price of £24/MWh was applied and scaled up according to the feedstock demands of the site.
Revenue
For future sites, the same methodology described above was applied to determine the revenue stream potential of each site, using the expected heat and/or power export potential post-CCS and multiplying it by the respective energy costs (14.6 p/kWh and 4 p/kWh for power and heat respectively).
BECCS Cement
The only site associated with BECCS Cement is Dunbar Cement, which is already operational. As there are no other cement sites expected to be constructed in Scotland, that we have only considered the costs associated with installing and operating CCS.
CAPEX
The investment cost of CCS was taken from the reference site used as the cost benchmark assumed a clinker production rate of 1 Mt/year and a carbon capture potential of 0.8 MtCO2/year, as well as utilising some waste as a fuel feedstock. This last point is ideal for our calculations of Dunbar cement, which plans to implement a 45% blend of SRF/RDF into their fuel feedstock.
The investment cost of CCS, obtained from the AECOM Next Generation Carbon Capture Technology techno economic analysis paper, for a reference site producing 1 Mt/year of clinker and capturing 0.8 MtCO2/year is £192.5M. This reference site also utilises waste as a fuel feedstock, which aligns with our calculations for Dunbar cement due to the site aiming to incorporate a 45% blend of SRF/RDF into their fuel feedstock. The capital expenditure covers EPC and Project Development costs.
OPEX
The Fixed OPEX was taken to be 5% of the CCS Capex.
As there was no data available on the heat and power usages of the Dunbar Cement site in the literature, then the Variable OPEX was determined by applying cost benchmarks directly, despite the site being operational. This does go against the methodology applied to all other existing NETs sites; however, no other options were available to us. This will lead to the LCOC of the Dunbar Cement site being overestimated compared to other existing industrial sites. An improvement point for this work is that the Variable OPEX of the Dunbar Cement site is recalculated based on potential increases in heat and power demands for the site, as well as the impact CCS has on potential losses in revenue sales from clinker, heat and power. The variable OPEX was taken to be £72.7M/year for the reference site.
Due to the lack of available data on the heat and power usages of the Dunbar Cement site, the Variable OPEX was determined by directly applying cost benchmarks, despite the site being operational. This deviates from the methodology used for other existing sites, but no other options were available. The Variable OPEX for the reference site was £72.7M/year. An improvement for this study is to recalculate the Variable OPEX of the Dunbar Cement site considering the impacts CCS will have on heat and power demands, as well as potential revenue losses from clinker, heat, and power sales.
BECCS AD
For existing sites, the costs associated with BECCS AD were taken to be that associated with constructing and operating an AD Upgrading and liquefication plant. As for future sites, the costs associated with constructing and operating an AD facility also had to be accounted for. The calculations, as well as the cost benchmarks used, are discussion previously in the BECCS Biomethane cost section.
BECCS Fermentation
For existing sites, the costs associated with BECCS Fermentation were taken to be that associated with constructing and operating the CCS plant. As potential future sites were not listed in the literature, please see the Data Sources section, then costs associated with future sites (e.g., cost of building a whisky distillery or brewery) were not investigated into. Similar to BECCS Biomethane sites, the mechanism for capturing carbon will be similar to the CO2 liquefication process, since the stream of CO2 exiting the distillery is pure. In our case, we used a 2014 paper published by the US Department of Energy which investigated the cost of capturing carbon from a bioethanol plant, which is a reasonable approximation to a whisky distillery and/or brewery. The paper in question considers a reference bioethanol plant that produces 50 Mgal/year of ethanol and 0.145045 MtCO2/year.
CAPEX
The investment cost associated with capturing 0.145045 MtCO2/year is £7.846M. This cost was then scaled up accordingly using sixth tenths rule and the alcohol production rate.
OPEX
The fixed OPEX was again taken to be 5% of CCS Capex.
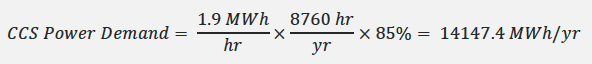
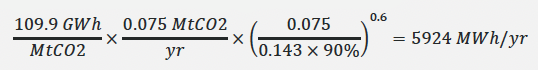
Similar to BECCS Biomethane, the electricity requirements associated with processing this pure CO2 are similar to that of CO2 liquefication. Regarding this 2014 bioethanol paper, a power demand of 1.9 MWh/hr is needed to capture the carbon, which is equivalent to 14147.4 MWh/year based off the fact that the reference bioethanol plant operates at a utilisation factor of 85%. Now assuming a standard carbon capture efficiency of 90%, we can achieve a power demand of 109.9 GWh/MtCO2.
Please see Box 6 below for a breakdown in this calculation.
Box 6: Example of fixed OPEX calculation for BECCS fermentation, power demand
A power demand of 1.9 MWh/hr is needed to capture the carbon, which is equivalent to 14147.4 MWh/year based off the fact that the reference bioethanol plant operates at a utilisation factor of 85%.
Assuming a standard carbon capture efficiency of 90%, we can achieve a power demand of 109.9 GWh/MtCO2

Using the sixth tenths rule, we can then scale up the power demand depending on the alcohol production rate. The final cost associated with power usage can then be calculated using an electricity price of 14.6 p/kWh.
Please see the calculations in Box 7 relating to ‘Cameronbridge’ grain whisky distillery
Box 7: Example of fixed OPEX calculation, cost implication
The CCS power requirement is scaled using the sixth-tenths rule
The power requirement is costed
BECCS EfW/ACT
The paper used to source our CCS cost benchmarks is from the AECOM Next Generation Carbon Capture Technology paper, which quotes a reference site that processes 350,000 t/year of waste, has a gross power output 29 MWe and captures 0.3 MtCO2/year. Costs associated with constructing and operating a EfW facility were taken from a Catapult Energy Systems paper that focussed on UK deployment of EfW facilities, considering a ‘Core EfW Plant’ where 350,000 t/year of waste is burnt under a gross capacity of 32MWe.
CAPEX
The investment cost of capturing 0.3 MtCO2/year from a EfW site is quoted to be £96.8M, which is then scaled accordingly using sixth tenths and the CO2 capture potential of each site. When considering future sites, the investment cost associated with constructing an EfW facility is taken to be £224M, when not scaled for inflation.
OPEX
For existing sites, the fixed OPEX is again taken to be 5% of CAPEX.
The methodology behind calculating Variable OPEX for existing EfW/ACT sites is similar to that of BECCS Power and Industry (Wood). The key difference is the choice around the electrical and heat efficiencies used, which are calculated below using parameters described in the AECOM paper.
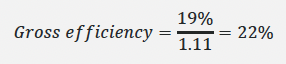
The NETs power efficiency pre and post CCS is 19% and 11% for power only sites
Given the fact that the reference case consumed 350,000 t/year of MSW and that the site operates 7446 hr/year, then we can determine the fuel energy input rate based on the fact that MSW has an energy density of 10 MJ/kg.

We know that the gross power is 29 MWe, NETs power output (pre-CCS) is 25 MWe, and NETs power output (post-CCS) is 14 MWe. Furthermore, we know that the Therefore, we can determine the power efficiencies.
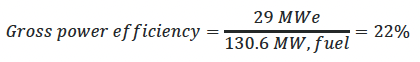
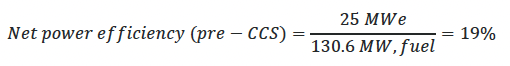
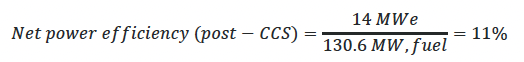
The choice of NETs power and heat efficiencies (pre-CCS) of a EfW CHP was determined based off CHPQA data. The power and heat efficiencies were taken to be 15% and 31% respectively.
The NETs heat efficiency of a EfW CHP was determined to be 0.4% once CCS was installed (i.e., all heat output from the CHP is utilised onsite to meet CCS demands). An example calculation for the “Charlesfield Biomass CHP Plant” site is shown in Box 8.
Box 8: BECCS EfW OPEX calculation example
Taking the feedstock input rate, we can determine the heat export potential pre-CCS.
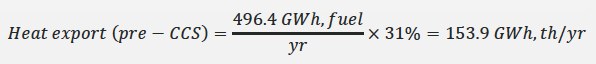
Using a standard CCS heat demand of 3.4 MJ/kg,CO2, we can determine the resulting heat demand of CCS using the annual CO2 capture potential. This enables us to check whether the site can meet CCS demands without the need for the installation of an additional boiler.


Using a heat price of 4p/kWh, we can determine the variable OPEX.
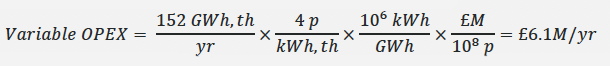
For the only heat only site, Lerwick Energy Recovery Plant, the heat efficiency pre-CCS was taken to be 76.7%. This is based off calculations using data from the Tolvik 2022 EfW statistics paper, where the site is labelled as Gremista. The total heat export from this site was 49 GWth in 2022, the waste input rate 23,000 t/year, and the energy density of the fuel was assumed to be 10 MJ/kg (MSW equivalent). This calculated heat efficiency is reasonable compared to industrial benchmarks of a typical boiler efficiency being ~80%.
For future sites, we directly applied the EfW plant and CCS benchmarks quoted in the AECOM and Catapult Energy Systems papers. This includes the proposed Achnabreck site, which plans on gasifying wood pellets in a CHP. The reasoning behind why we used these benchmarks is because the technology is the same and hence costs are unlikely to differ significantly if we switch the biomass source. However, it is still worth noting that an improvement point to this work is to update the Achnabreak cost calculations so that they are more closely aligned to woody biomass gasification, since the fuel density and gasification efficiencies will differ compared to waste, which in turn will impact the variable OPEX costs slightly.
CO2 Transport
The costs associated with carbon transport were determined in a separate Excel tool compared to the LCOC Tool.
In this case, the X and Y coordinates identified during the literature review of each site were taken and mapped against potential CO2 injection points across Scotland using GIS Mapping.
The key CO2 injection points considered were all along the St Fergus gas pipeline, which is proposed to be upgraded to enable CO2 transport cross country as part of the Acorn project. The injection points were Bathgate, Kirriemuir, Garlogie, and Peterhead. The distance between all four injection points and the proposed NETs site were calculated in km using GIS Mapping by assuming that all sites will initially transport CO2 by truck to an injection point unless they are physically located next to one of the four proposed injection points. The shortest possible road distance was then selected.
The onshore pipeline distances from each of the four injection points to the St Peterhead gas terminal was then calculated using GIS mapping and are shown in Table 13 of the main report.
The final offshore pipeline distance from the Peterhead to the Acorn site is 80km for all sites.
The resulting costs associated with each mode of travel: road, onshore pipeline, and offshore pipeline, are then calculated using the benchmarks outlined in Table 20, page 36 following benchmarks taken from the IEAGHG EfW-CCS paper. The benchmarks can then be used to scale linearly scale up transport costs based on CO2 production capacity and transport distance.
CO2 Storage
Storage costs were taken directly from the IEAGHG EfW CCS paper, where the high-end costs were utilised in order to ensure that costs are conservative. As these costs are quoted in a £/tCO2 basis, with no reference to plant size, then costs are linearly scaled up based on CO2 capture capacity.
Inflation
To ensure all cost benchmarks are within the correct format, they are adjusted for inflation and converted to pounds sterling using indexes from the World Bank and exchange rates from the OECD. Please note that inflation indexes were only available up to 2021. An improvement point of this analysis is to utilise updated inflationary figures, when they are available, to determine the difference in costs based on the fact that the British economy is going through a period of very high inflation.
| Parameter | 2010 | 2011 | 2012 | 2013 | 2014 | 2015 | 2016 | 2017 | 2018 | 2019 | 2020 | 2021 |
|---|---|---|---|---|---|---|---|---|---|---|---|---|
| GDP deflator index (2010 =100) to 2021 for US | 91.86 | 93.77 | 95.52 | 97.19 | 99.01 | 100.00 | 101.00 | 102.92 | 105.40 | 107.29 | 108.69 | 113.57 |
| GDP deflator index (2021 =100) to 2021 for US | 0.81 | 0.83 | 0.84 | 0.86 | 0.87 | 0.88 | 0.89 | 0.91 | 0.93 | 0.94 | 0.96 | 1.00 |
| Exchange rate USD to GBP | 0.65 | 0.62 | 0.63 | 0.64 | 0.61 | 0.65 | 0.74 | 0.78 | 0.75 | 0.78 | 0.78 | 0.73 |
| Exchange rate USD to Euro | 0.75 | 0.72 | 0.78 | 0.75 | 0.75 | 0.90 | 0.90 | 0.89 | 0.85 | 0.89 | 0.88 | 0.85 |
| Exchange rate Euros to GBP | 0.86 | 0.87 | 0.81 | 0.85 | 0.81 | 0.73 | 0.82 | 0.88 | 0.89 | 0.88 | 0.89 | 0.86 |
Contact
Email: NETs@gov.scot