Negative Emissions Technologies (NETS): Feasibility Study - Technical Appendices
Technical annex for study that estimates the maximum Negative Emissions Technologies (NETs) potential achievable in Scotland, 2030 - 2050.
2. Detailed sector specific technologies
This section provides a detailed description of each of the NETs technologies, considering the final applications. These consist of BECCS power, BECCS energy from waste, BECCS hydrogen, BECCS biofuels, BECCS biomethane, BECCS industry, biochar and DACCS. These technological solutions are all outlined in the follow sub-sections. Common limitations and barriers to implementation are outlined in section 2.1.
2.1 Common limitations and barriers
Although the deployment of NETs is accelerating, there are still a number of challenges and barriers that need to be faced. These can be broadly categorised into economic, technical, infrastructure, supply chain, environmental, social and regulatory barriers. There are several that are specific to NETs as a whole, which are detailed in this section, as well as technology-specific barriers that are discussed within the technology sub-sections.
CCUS has an important role to play in achieving negative emissions and ultimately Net Zero targets and is part of a globally accepted suite of technological solutions to combatting rising carbon dioxide emissions. Experts do not see CCUS as the approach that will solve the climate crisis alone, but as part of a portfolio of technologies that are needed to get to net-zero. CO2 capture, transport, and storage are well-established and have been used for decades worldwide. However, the full CCS chain for purposes of achieving carbon reduction targets have only been fully demonstrated on large scale in a few places worldwide. This is because there are still a wide range of challenges and barriers which still need to be overcome as discussed below.
Several pilot programmes and projects for CCUS have emerged over the past ~20-25 years – with varying levels of success. Appendix 4 outlines existing CCUS projects (including pilot projects) in the UK. It does not however outline the various success (or lack-thereof) rates for these and other pilot projects or the barriers that have led many of these schemes to fail to capture the volumes of carbon that had been originally aimed for. A key criticism of CCUS is the fact that many of the projects proposed and planned over the years have been focused in storing the carbon dioxide in oil and gas fields for enhanced oil and enhanced gas recovery (EOR and EGR) thus leading to increased use of fossil fuels. In the last decade, however, many proposals for CO2 utilisation have emerged including for sustainable aviation fuels (to replace fossil fuels) and in green cement, concrete curing and mineral carbonation where the carbon can remain permanently trapped. In EOR applications, it is essential that life cycle impacts including CO2 leakage and additional consumption of oil and gas are taken into account in evaluating carbon savings. Many CCS projects propose to store the CO2 in saline aquifers rather than in oil and gas fields (e.g., the Sleipner project in Norway which has been storing 1 Mt CO2/year in saline aquifers in the North Sea since 1996)
A study by the Institute for Energy Economics and Financial Analysis (IEEFA)[78] in 2022 highlighted that the current global CCS industry is around 39 Mt CO2/year (with no major NETs projects contributing to this at the time). A sample of 13 sites was analysed to learn lessons about the emerging CCS sector. The study showed that many of these CCS demonstrations failed or underperformed with successful CCUS projects existing mainly in the natural gas processing sector where CO2 removal has been deployment for natural gas sweetening for many decades.
In the US, many planned CCS demonstrations failed due to factors affecting their economic viability such as market competition, uncertainty in the carbon market/tax incentives or high expected project costs. Many of the failed projects were based on integrated gasification combined cycle (IGCC) technology which was found to be very capital-intensive. A report by the United States Government Accountability Office[79] report calculated that the US Department of Energy had invested ~$1.1 Bn in eleven CCS demonstration projects (8 coal-CCS and 3 industrial CCS). Of the three industrial projects, two were completed and remain in operation.
In a paper by Wang et al[80], their model of 263 CCUS projects undertaken between 1995-2018 showed that the key cause for concern was that existing support mechanisms were not sufficient in mitigating the risks associated with CCUS project upscaling. One of the key findings was that larger plant sizes increase the risk of CCUS projects being terminated or put on hold, with increasing a plant capacity by 1 Mt CO2/year leading to a 45.5% increase in project hazard rate.
Despite these failures, the evidence is clear that CCUS and NETs are needed if Net Zero targets are to be achieved. If CCUS and NETs are to become a reality in the future, lessons learned from the planning and operation of many CCUS projects should be considered. The following sections discuss challenges and barriers associated with CCUS deployment.
A 2022 Public policy project report[81] recommended that immediate plans for CCS especially including infrastructure must be delivered to support CO2 pipeline transport and offshore geological storage infrastructure development for the Track 1 CCS clusters. It was stated that “unless a reasonable return can be expected on investments, industry cannot be expected to commit to the construction and long-term operation of these facilities.”
2.1.1 Technical
The most cited barrier for NETs is the need to develop CO2 transport and storage infrastructure; once developed there will be competition for storage. Storage capacity must be prioritised if NETs are to be successfully deployed at large scale in the short timeframes necessary. The high energy requirements of NETs are another common limitation, with oxy-combustion capture and DACCS being particularly energy intensive; oxy-combustion requires an Air Separation Unit (ASU) whilst DACCS must process dilute concentrations of CO2 from the atmosphere. Pre-combustion capture has an advantage over post-combustion capture in that physical absorption instead of chemical absorption can be used for the capture process due to the higher pressures involved. As a result, pre-combustion capture is associated with lower energy penalties due to the lower energy needed for physical solvent regeneration. Similar to post-combustion capture, the cleaning of syngas from biomass gasification (e.g., SOx and NOx removal) is necessary to ensure optimal performance of the CO2 capture process.
The timing of future BECCS and DACCS operation is limited to when CCS networks are deployed[3], [35]. This is a genuine concern for Scotland, since the Acorn CCS site has not been awarded Phase 1 or 2 cluster funding[18], [82], and there remains some uncertainty over its future. This uncertainty remains in place, whilst £20Bn of funding for CCUS was announced in the 2023 spring budget, there was no explicit reference to progressing with the Scottish Cluster[83].Competing uses of geological storage for CO2 between various NETs technologies could limit technology scale up[84]. The timescales of innovating, developing, and deploying NETs are also lengthy, taking between 10 to 15 years[35]. This limits the deployment of NETs within this decade, meaning the negative emissions targets set out by the CCPu and CCC are realistically likely going to be missed. Finally, guaranteeing public acceptance for engineered NETs is an unexpected barrier, with an approval rating of 42% only being achieved for BECCS and DACCS, due to the perception that higher CO2 leakage risks are exhibited compared to nature-based solutions[66].
2.1.2 Economic
Economic barriers to NETs exist due to the high capital cost associated with upfront investment. Additionally, several NETs technologies possess high operating costs. This is most prevalent for DACCS, which requires the construction of large capture units to process and extract the dilute concentrations of CO2 in the air (~400 ppm) and consumes significant heat and power. The large energy penalty associated with solvent regeneration in post combustion capture is another example of high Variable OPEX costs.
According to stakeholders, a key barrier to GGR deployment is financial[59]. They see a clear lack of an established market or customer demand for engineered removals, a lack of policy incentives to make the high capital and operational costs of GGRs attractive, and a lack of a stable revenue streams for the provision of negative emissions.
2.1.3 Policy and Regulatory
Currently the costs of NETs are prohibitively high, resulting in economic barriers to their widescale deployment. The UK Government are proactively considering the most appropriate support to limit such barriers; however, support has been limited to date. Therefore, further financial incentives are necessary in order to provide stakeholders with greater long-term clarity and revenue certainty.
Additionally, the requirement to have effective monitoring, reporting and verification (MRV) standards in place is another key challenge. Most notably, to be classed as negative emissions, the total quantity of CO2 permanently removed and stored must be greater than the total quantity of CO2 emitted to the atmosphere. These rules and methodologies will be different depending on the choice of NET. The implementation of robust procedures to account for permanence of storage of CO2 is also necessary.
Analysis undertaken by the UK Climate Assembly shows the public to be highly in favour of nature-based GGRs (only 4% disagree or strongly disagree with implementing nature-based solutions), whilst engineered NETs are much less favourable (42% approval rate). This is due to a perceived CO2 leakage risk compared to nature-based solutions. This lack of public acceptance will be a barrier for engineered NETs, which can be combated if the Government introduces NETs at a small scale and sequentially builds up capacity over time[66].
The high resource requirements, lack of CO2 T&S infrastructure, and lack of policy incentives for GGRs are some of the main constraints towards deployment[59], [62]. Most notably, without a price or reward for negative emissions, GGR deployment may not be financially viable for the private sector[59].
Our pathway analysis aims to provide some site-based calculations to support potential negative emission credit calculations. This will work from an economic payback point of view and using the estimated CAPEX and OPEX for the NETs solutions to determine what economic value on the captured carbon could have at a site in order to achieve a specific payback period. This analysis is meant as a guide and will be based only on the available literature on CAPEX and OPEX (specific to a given sector where CCS is applied) to determine a levelised cost (£/tCO2). The costs for transport and storage of the CO2 will also be included in the levelised cost calculation. Further details of this methodology will be described in the Final Report. The high project costs[79]of some CCUS projects in the past has been a key reason for their failure, meaning that there is a risk that this analysis uses CAPEX costs that are lower than potential real-life project costs (providing low carbon prices (or low paybacks if the analysis was done in reverse)
2.1.4 Environmental
A major environmental challenge relates to the changes in land use to accommodate the large amounts of feedstock required for BECCS and biochar, which may result in species loss and reduced biodiversity. Furthermore, land use changes may affect the price of agricultural commodities, such as food, which will negatively impact the poorest households. The high-water requirements of BECCS, related to the production and processing of the biomass fuel, may also negatively impact wildlife and raise water prices.
Our pathway analysis will evaluate the overall costs associated with a given pathway as well as the carbon savings and NETs potential. As part of the discussion, potential life cycle impacts arising from the full CCS chain (capture, transport and storage), associated externalities and risks will also be discussed qualitatively for the various pathways.
2.1.5 Social
Public perception is an important aspect to ensure the successful wide-scale deployment of NETs; however, the unfamiliar nature of novel technologies may pose as a risk to gaining public support. To date, prior studies have shown that public acceptance varies across different NETs, with nature-based solutions having higher acceptance rates and engineering NETs being seen as a risk.
A study on the perception of BECCS was recently undertaken in the UK, where a large majority (79%) of participants stated that prior to the experiment they knew little to nothing about BECCS. It was also concluded that after learning about BECCS, there were no participants who were strongly opposed to it, with more overall support shown. The unfamiliar nature of GGRs may cause apprehension to its wide scale deployment[85].
Bioenergy feedstock is typically of lignocellulosic nature, for example wood and agricultural residues, which are unlikely to compete with food supply; however, they may cause issues relating to land-use change. Energy crops on the other hand, have already caused serious socio-economic problems in several countries, in particular over land tenure and loss of ecosystem services. There are also societal concerns relating to land-use change, especially in cases where energy crops are grown on agricultural land or existing woodland is used for biomass supply. A study released by Traverse stated that participants felt uncomfortable about the burning of trees for use in BECCS, essentially finding BECCS complex and difficult to assess. However, participants found the concept of DACCS easier to evaluate, despite expressing concerns regarding its proven effectiveness at scale[86].
2.1.6 Supply chain
The increased demand for negative emissions will result in an increase in the demand for carbon capture equipment. It can therefore be expected that the number of suppliers will need to increase to meet this demand in order to avoid significant supply chain barriers. In recent years, the number of companies offering carbon capture solutions is rapidly increasing, with major companies including Aker Carbon Capture, Climeworks, Carbon Engineering, Carbix, Carbon Clean, amongst others.
America and Canada appear to be leading the way with number of companies providing carbon capture equipment, as illustrated by Carbon Engineering, LanzaTech and Svante. Whilst in Europe, countries such as Norway, Denmark, Switzerland, and the Netherlands are dominating, with companies including Aker Carbon capture, Climeworks, and CO2 Capsol[87].
At present, there is lack of a carbon capture equipment supply chain within the UK, as there are a limited number of companies locally manufacturing such equipment. Carbon Clean Solutions is a notable company headquartered in the UK providing modular DAC systems, however, it is unclear whether their equipment is manufactured in the UK. Other noteworthy companies in the UK include Carbogenics and Carbon Infinity, both start-ups that have developed biochar and DAC technologies, respectively[88].
Another significant supply chain limitation is the lack of skills within this industry, resulting in an inability to develop the market in line with the demand. Typical industry skill-sets will be similar to those found in the oil & gas industries, where direct and indirect employment in the industry has dropped from 260,000 in 2019 to 213,000 in 2022[89]. This compounded with the lack of suppliers, creates consequential barriers for deployment.
Finally, there are also issues around the supply chain for CO2 storage, including lack of suitable fabrication yards in Scotland/ the UK, and competition for skilled workers with other major projects that are likely to happen at the same time as CCS deployment, such as offshore wind, oil and gas decommissioning and hydrogen transport and storage.
2.2 BECCS power
2.2.1 Overview of technology
2.2.1.1 TRL
The TRL of BECCS power varies depending on the specific pathway, where biomass combustion with post-combustion CO2 capture has the highest TRL, at TRL 8-9. Oxyfuel capture via the steam-based Rankine cycle has a TRL of 7, as this has been developed at pilot scale however is not yet commercially available[46]. Pre-combustion capture with gasification is at TRL 3[90].
2.2.1.2 Costs
The costs of BECCS power will vary depending on the specific technologies used. Table 24 provides an overview of costs, estimated in a 2020 study[46], as well as providing key assumptions on the operational parameters of the plants related to the final costs.
| Technology type | Gross plant capacity, MWe | NETs plant capacity, MWe | Capital cost, £/kW | Operating cost (fixed), £/kW | LCOE, £/MWh | CO2 avoided, £/tCO2 | |
|---|---|---|---|---|---|---|---|
| Plant and CCS | CCS | ||||||
| Post-combustion | 498 | 396 | 2,793 | 698* | 146 | 181 | 410 - 720 |
| Oxy-fuel combustion | 598 | 402 | 3,209 | N/A | 164 | 189 | 420 - 730 |
| Pre-combustion IGCC | 493 | 356 | 3,664 | N/A | 198 | 204 | 440 - 805 |
*A CCS investment cost of 25% was taken from the IEAGHG report[91]
2.2.1.3 Inputs / outputs
A wide range of feedstocks can be used for BECCS power applications. The most common feedstocks include sugar/starch crops, forestry products, by-products and residues and energy crops. Energy crops include woody crops such as short rotation coppice, and grassy energy crops such as miscanthus. These feedstocks can all be converted via combustion or gasification, the two conversion processes utilised in BECCS power applications. The outputs consist of electricity and sometimes heat, as well as the CO2 that is captured.
2.2.1.4 Schematics
Data for all three schematics below was taken from the Wood BECCS report[45]. The schematic for the post-combustion capture typology is shown in Figure 3, Oxyfuel combustion and pre-combustion capture are shown in Appendix 11.
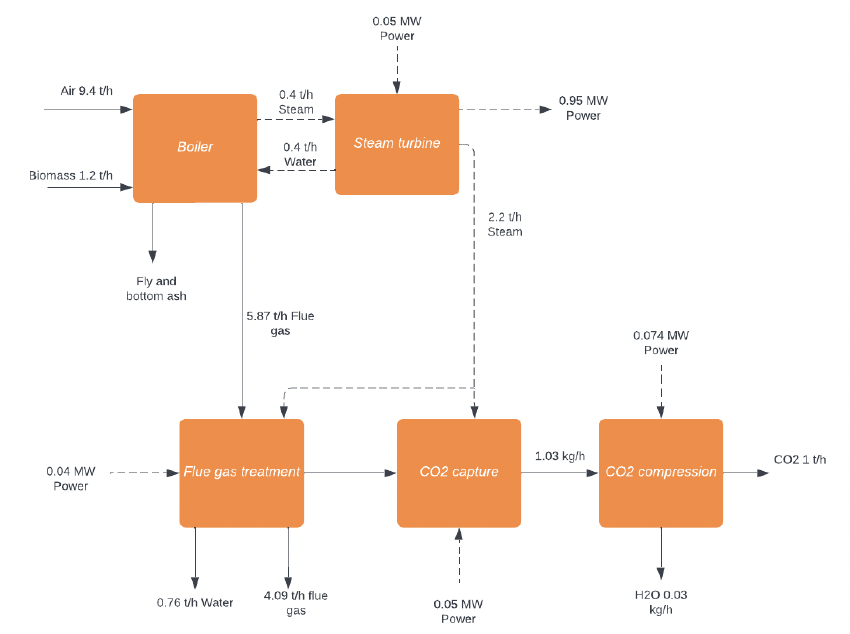
The above schematic shows that to capture and store one tonne of CO2 using BECCS post-combustion capture, 1.2t of woody biomass is needed to be fed to the boiler(s) alongside a power input of 0.214 MW. These power demands can be met through a steam turbine located onsite, which converts 0.4t steam exiting the boiler(s) to 0.95MW of power.
2.2.2 Potential Carbon impact
As shown in the above schematic, and schematics shown in Appendix 8, the carbon capture potential of BECCS Power varies between 0.83-1.59 tCO2/t biomass. This does not account for lifecycle emissions associated with upstream processing and transportation of biomass, which are discussed in more depth below.
For the pathways modelling, performance data for a reference BECCS Power plant is needed to calculate the CO2 capture potential in Scotland. For the electrical efficiency, a value of 34.9% has been assumed based on performance data from Steven’s Croft biomass power station[92], with an assumed CO2 capture rate of 90% (see Section 1.2.1 for further detail). The utilisation factor of the power plant is taken to be 90%, based on work by SCCS[92] and Pour et al[70], and the biogenic content of the captured CO2 is assumed to be 100%. Finally, the CO2 emission factor for the biomass fuel is taken to be 0.35 kgCO2/kWh or 1433.89 kgCO2/t, based on an average for wood logs, chip, pellets, and grass/straw taken from the BEIS conversion factors database[93].
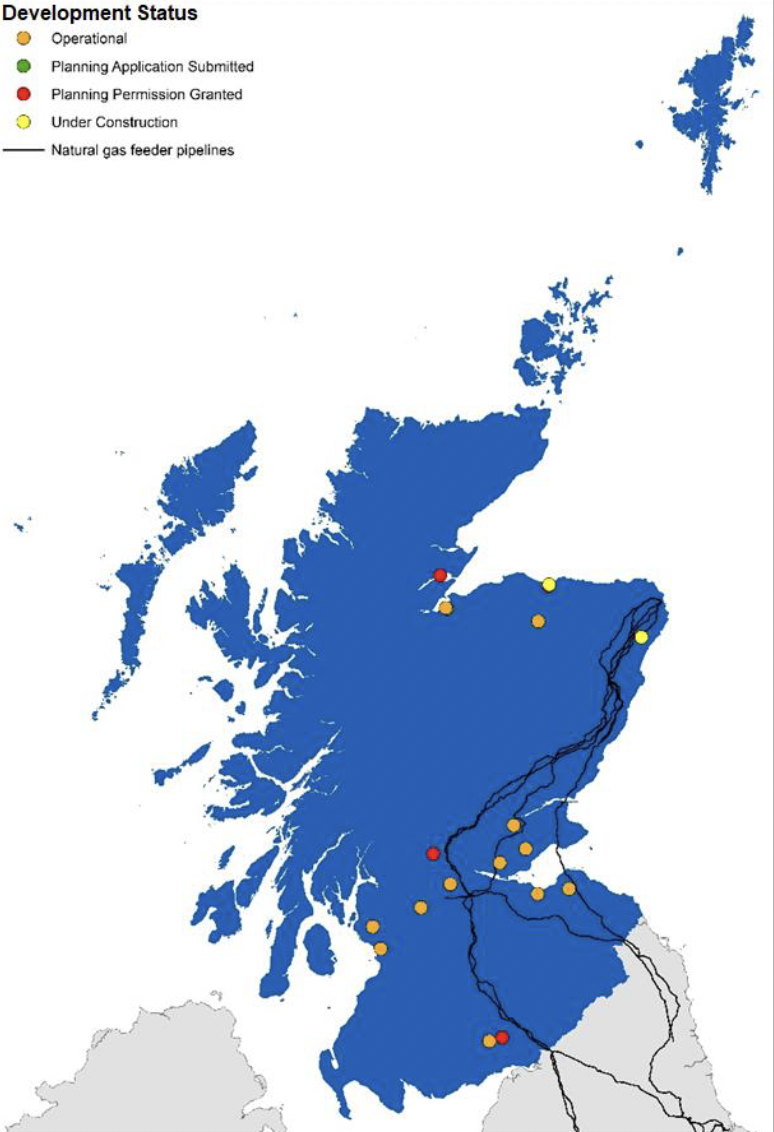
2.2.3 Potential locations in Scotland (map)
Data from the October 2022 Renewable Energy Planning Database (REPD) was filtered through, and relevant projects categorised into different NETs applications. A GIS map was then constructed. The development status was also taken note of, which fell under already operational, awaiting construction, planning permission granted, and planning permission submitted. In this instance, biomass power and biomass used in industry (section 2.4) are included in Figure 4.
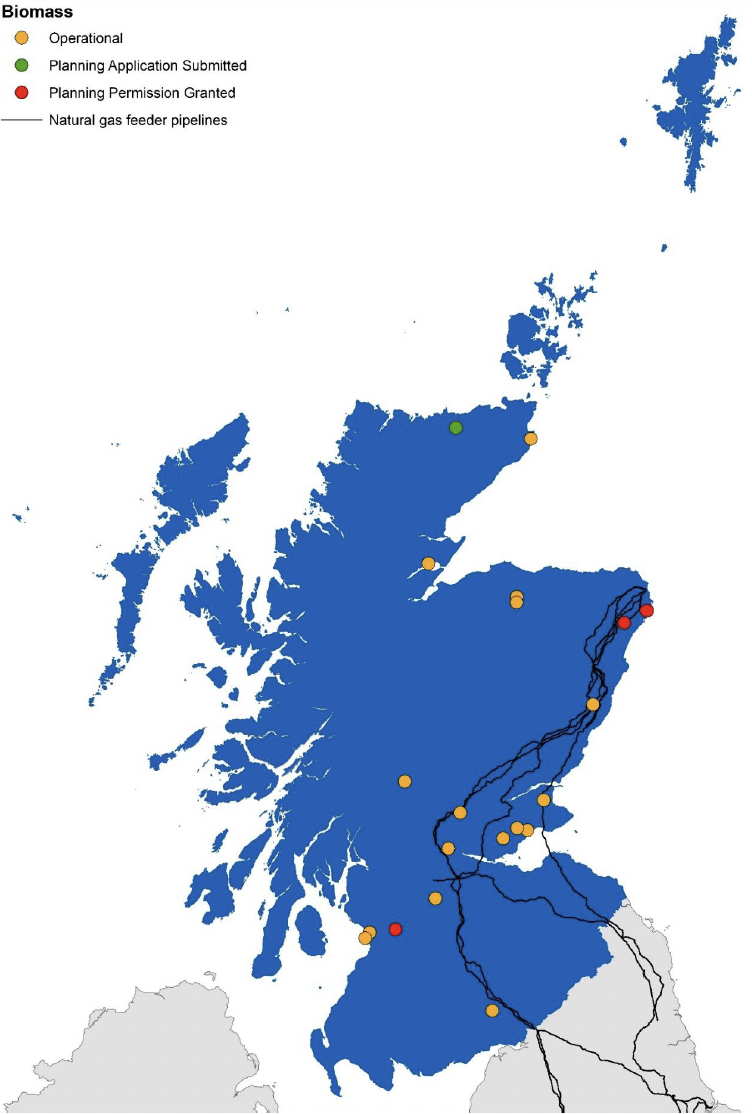
With regards to biomass sites that could be future candidates for a BECCS Power site there are 16 projects in total. The majority are located around Grangemouth, Fife, Angus and Aberdeenshire which could in theory utilise existing gas pipeline infrastructure to transport captured CO2 to Peterhead if they were to be upgraded accordingly. The remaining projects are in the south, near Dumfries and Ayr (3 projects), and the north (4 projects), which would have to rely on truck and rail transportation to CCS hubs to store captured CO2, if not utilised.
For the existing sites which can be retrofitted with CCS, a capture potential of 1.24 MtCO2/year is possible at an investment and operational cost of £30M and £6M/year respectively. Once the proposed new-built sites are also considered, the total capture potential reaches 3.1 MtCO2/year at a CAPEX and OPEX of £593.8M and £35.7M/year. Compared to Element Energy’s analysis (0.944 MtCO2/year)[22], our estimates appear to be more optimistic.
Further analysis by Haszeldine et al[35] estimates that BECCS potential within Scotland could reach 5.7 - 23 Mt CO2/year. Any potential future BECCS plant would require dedicated bioresource supplies, particularly those that are spatially dense, high yield, and observe a high biomass tonnage ratio. The location of any potential future large-scale BECCS sites will need to consider and the proximity of the site to the available bioresources due to the high demand this would place on the resource, and the proximity to transport switching locations such as the rail terminals and ports. Ideal locations for future BECCS sites would be either adjacent to the feeder 10 pipeline for transportation to permanent storage, or adjacency to the Acorn facility in Peterhead.
2.2.4 Technology specific limitations & barriers
2.2.4.1 Technical
Several technological barriers exist across each of the different BECCS power generation options, however efforts are underway to further develop the technologies, hence increasing scale and reducing costs. For solvent-based post-combustion capture systems, which are the most advanced post-combustion capture technologies, the largest challenge relates to the high energy penalty associated with solvent regeneration. The approach usually consists of diverting steam from the power generation process to be utilised for solvent regeneration, hence the addition of the carbon capture unit will reduce the total electricity generated on site that can be exported. Capture of CO2 through post-combustion capture from flue gases poses additional challenges due to the low concentration of CO2 in the flue gas stream, at around 3-4%.
For oxy-combustion capture, the largest challenge arises from the high-power requirement of operating an Air Separation Unit (ASU), which is utilised to produce a pure stream of oxygen utilised for combustion. However, the energy penalty for oxy-combustion capture systems is much less than for post-combustion capture, as the CO2 in the flue gas stream is at a significantly higher concentration, due to the absence of nitrogen during biomass combustion.
There are also significant challenges with pre-combustion capture systems associated with BECCS power. The predominant challenge relates to the required cleaning of syngas from biomass gasification on a large scale, as most gas cleaning methods are not substantially efficient on a large scale.
2.2.4.2 Economic
As previously outlined, the large energy penalty of solvent-based post-combustion capture systems reduces the total electricity that can be exported. Operation of the carbon capture unit therefore has high operating costs and reduced the revenue that can be obtained through sales of electricity. The capital costs of CO2 systems are also high, hence reducing the attractiveness of the technology.
2.2.4.3 Infrastructure
As with all BECCS applications, the successful storage of the captured CO2 is intrinsically linked to the availability of CO2 transport and storage infrastructure. Analysis by Pour et al[70] highlights that locating a BECCS plant near a Biomass Hub over a CO2 Storage Hub will lead to cheaper costs but at the price of higher carbon emissions.
2.2.4.4 Environmental
A major environmental challenge relates to the possibility of changes in land use to accommodate the large amounts of feedstock required as input to a BECCS plant. As well as increasing the potential for species loss and reduced biodiversity, land use change may directly affect the price of agricultural commodities, including food, due to increased demand for land.
Operation of a BECCS plant also results in adverse effects due to increased freshwater consumption, related to producing and processing the biomass fuel[94]. Increased water demand also has the potential to increase the price of water.
2.3 BECCS energy from waste
2.3.1 Overview of technology
2.3.1.1 TRL
Post-combustion carbon capture technology is the most conducive for effective CO2 capture from EfW facilities, and as such has a TRL of 7, according to Element Energy[22]. A TRL of 7 indicates that there are operational prototypes or planned operational systems, requiring demonstration in an actual operational environment. This technology is mature and has been successfully deployed for many years, however, it has yet to be integrated within a commercial scale EfW facility in the UK.
2.3.1.2 Inputs / outputs
Inputs
Municipal solid waste (MSW) as well as commercial or industrial waste is typically utilised at EfW plants. Waste can be classified as either biogenic or non-biogenic material; biogenic being biological in nature, such as wood, food, or paper. Non-biogenic materials are those which have fossil fuel origins, for example plastics and synthetics. Exact composition of MSW is unknown as there is yet to be a detailed study undertaken in the UK, furthermore, the composition and proportions of biogenic/non-biogenic material vary over time and with location. This variation is due to consumption habits, waste management practices, and waste policies[95]. However, it can be stated that in developed countries biogenic materials make up approximately 40-60% of waste utilised in EfW facilities[96]. This relatively significant proportion of biogenic materials means that CCS implemented on EfW sites can be classified as BECCS, as negative emissions can be achieved.
Outputs
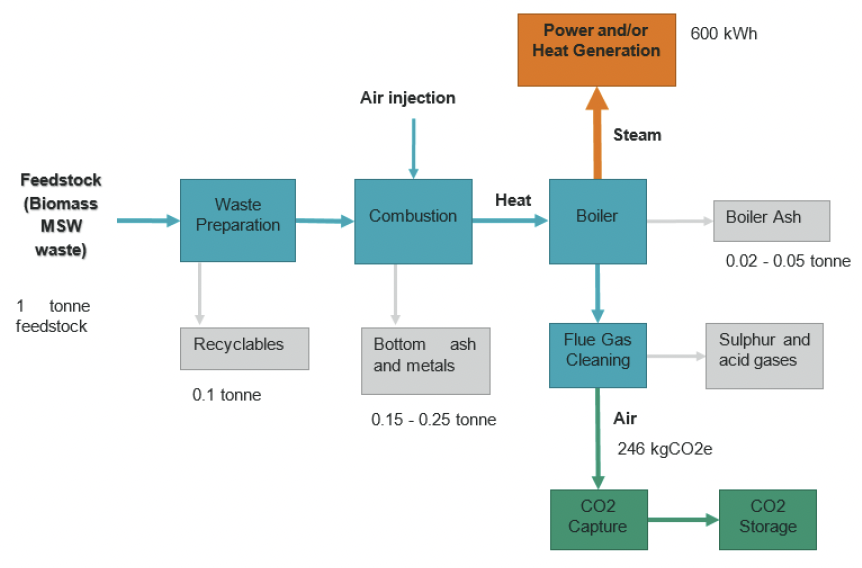
The outputs produced varies depending on the configuration of the EfW facility. For thermal treatment facilities where the waste is incinerated, along with heat, bottom ash and combustion gases are produced. The bottom ash is a heterogeneous material comprised of concrete, glass, ceramics, brick etc., and has long been regarded as a waste product. However, incinerator bottom ash can be used as aggregate once processed to remove any contaminants. The aggregate is predominately used in construction, namely as a sub-base for roads or car parks, or it can be bound with cement[97]. This practice is widely accepted and frequently carried out in the UK and Europe. By utilising incinerator bottom ash in construction, it has the potential to displace the use of raw materials, thus contributing to a more circular economy.
Heat produced from the combustion of waste is used to generate electricity, however, the remaining heat, i.e., steam, is rejected to the atmosphere, which not only significantly reduces the efficiency of the plant but also wastes useful heat. For combined heat and power (CHP) EfW facilities, this low-grade steam is extracted from the steam turbine to produce hot water that is subsequently distributed via insulated pipework to provide heat to buildings. By employing CHP at EfW plants instead of recovering only electricity, the overall efficiency increases to over 70%.
The main products of pyrolysis include biochar, pyrolysis oil, and syngas; syngas being the desired product as it can be further converted into a range of energy products, including electricity as well as gaseous or liquid high-quality fuels, which can be used as transport fuels. Pyrolysis oil has the potential to be utilised for combustion in CHP systems or further refined into diesel oil, although this is not common practice[98].
Both pyrolysis and gasification processes create biochar, which is a solid residue rich in carbon that is the direct product of thermal decomposition of biomass. Further information about biochar can be found in section 2.8.
2.3.1.3 Costs
A breakdown in CAPEX for two operating EfW plants with CCS installed is detailed in Table 25 below. These plants are based in the Netherlands, utilise post-combustion capture via MEA solvent, and provide considerable heat and power to local residents and businesses[77]. Further analysis by Element Energy indicates that EfW-CCS levelised costs range between £60-£140/tCO2[22].
| Plant | Total waste (t/year) | Power (MWhe) | CO2 captured (tCO2/year) | Investment costs*(M£) | CAPEX | ||
|---|---|---|---|---|---|---|---|
| EfW plant | CCS installation | EfW plant (£/t,waste) | CCS installation (£/tCO2) | ||||
| AEB Amsterdam | 1,284,164 | 888,000 | 450000 | 403.19 | 107.52 | 314 | 240 |
| AVR-Duiven | 360,635 | 147,000 | 50000-60000 | N/A | 17.92 | N/A | 299.7-360 |
* Using a conversion factor of euros to 0.9 pounds sterling[99]
2.3.1.4 Schematics
2.3.2 Potential Carbon impact
The EfW industry are a significant component of industrial emissions in the UK, emitting approximately 11 Mt CO2/year CO2; this value is almost 3% of total UK emissions[95]. In Scotland, the average carbon intensity of EfW plants operating in 2018 was 509 gCO2/kWh, which was notably higher than the carbon intensity of the marginal electricity grid in the UK during the same year (270 gCO2/kWh). Incinerator facilities that export electricity only have the highest carbon intensity due to their inefficiency, whilst CHP and heat only EfW facilities have particularly lower values[95]. By upgrading electricity-only EfW facilities (which are the majority in Scotland) to CHP, this not only reduces their carbon intensity by approximately 200 gCO2/kWh, but it also allows for a more effective deployment of retrofit carbon capture technologies.
The potential carbon impact is dependent on the future capacity and hence number of EfW facilities that are suitable for retrofitting CCS. Furthermore, the composition, particularly the fossil content, of the MSW plays a significant role. Nevertheless, the installation of carbon capture technology reduces the emissions intensity of the electricity exported to Net Zero. Additionally, approximately 1.06-1.14 tCO2 are avoided per tCO2 gross removed; however this is very dependent on the biogenic fraction of waste[101].
For the pathways modelling, performance data for a reference EfW-CCS plant is needed to calculate the CO2 capture potential in Scotland. For the electrical efficiency, a value of 23.8% has been assumed based on benchmark data provided by the IEAGHG[77], with an assumed CO2 capture rate of 90% (see Section 1.2.1 for further detail). The utilisation factor of the power plant is taken to be 92%, based on performance data from Runcorn EfW and Riverside Resource Recovery Facility, and the biogenic content of the captured CO2 is assumed to be 50.3%[77]. Finally, the CO2 emission factor for the waste is taken to be 0.10005 kgCO2/MJ or 0.36018 kgCO2/kWh[77].
Global Warming Potential (GWP) Emissions
Analysis by Pour et al[70]indicates that EfW via MSW-CCS exhibits a negative emission potential -0.89 tCO2/MWh and a GWP of -1.48 kgCO2/kWh[70].
2.3.3 Potential locations in Scotland (map)
Similar to BECCS Power, the GIS Mapping for energy from waste in Scotland was taken from the REPD (see Section 2.2.3 for more detail). At present the mapping is split into two separate categories: EfW and Advanced Conversion Technologies (ACT). The EfW map considers incineration facilities only, whilst ACT considers waste gasification sites.

With regards to EfW there are 13 projects in total. Similar to BECCS Power, the majority are located around the central belt and eastern Scotland; sites on the east side of the country could in theory utilise existing gas pipeline infrastructure to transport captured CO2 to Peterhead if they are upgraded accordingly. The remaining projects are in the south-west (2 projects), which will have to rely on truck and rail transportation to CCS hubs to store captured CO2.
For the existing sites which can be retrofitted with CCS, and provide 374 GWh/year of electricity, a capture potential of 0.51 MtCO2/year is possible at an investment cost of £63.9M. Once the proposed new-built sites are also considered, the total electricity generation reaches 1628 GWh/year at a capture potential of 2 MtCO2/year, costing £408.8M in CAPEX. These values are similar to the literature, with Element Energy estimating present day EfW-CCS potential of circa 1 MtCO2/year[22].
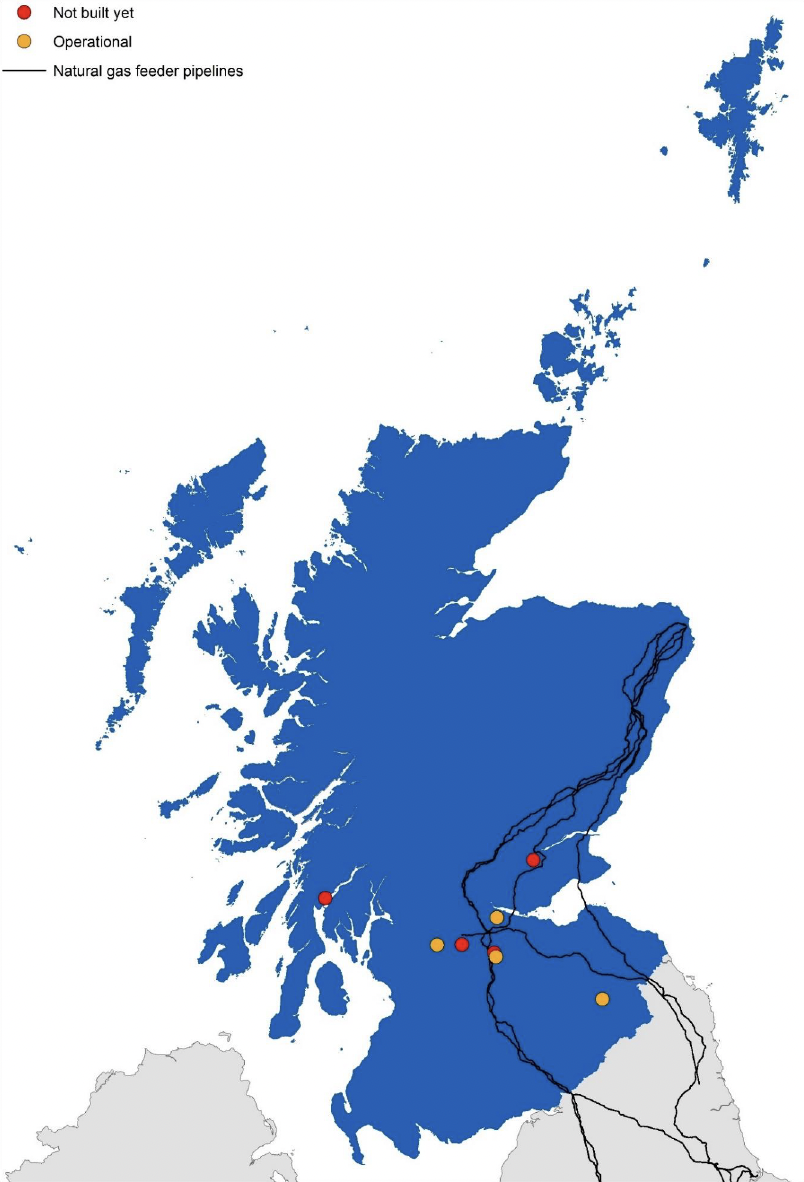
With regards to ACT there are 8 projects in total. They are predominantly located around the central belt and Fife which could in theory utilise existing gas pipeline infrastructure to transport captured CO2 to Peterhead if they are upgraded accordingly. Of the remaining projects, one is located on the west coast, and is likely to be unpractical to transport any stored CO2 from this site by road; the other is in the Scottish Borders. BECCS EfW plants require a sustained supply of waste, hence they are best located near both population centres and CO2 T&S infrastructures, which may not always be an option.
For the existing sites which can be retrofitted with CCS and capture 0.65 MtCO2/year at an investment cost of £173.6M. Once the proposed new-built sites are also considered, the total capture potential reaches 1.68 Mt CO2/year, costing £1.8B in CAPEX.
2.3.4 Technology specific limitations & barriers
A barrier to the deployment of CCS to EfW facilities in Scotland is the Scottish biodegradable municipal waste ban that is due to come into effect in 2025, including the effective ban on new incinerators. Both bans were implemented as part of Scotland’s Zero Waste Strategy, meaning that a larger proportion of waste will be diverted away from incineration facilities in favour of recycling or alternate pathways, directly affecting the quantity of feedstock available for EfW plants. Moreover, policies to divert biogenic waste to other routes such as biomass combustion or anaerobic digestion may significantly reduce the percentage of feedstock of biogenic origin, thus reducing the negative emissions potential of BECCS EfW. However, these alternative waste treatment plants can still be operated with CCS to help mitigate against fossil emissions.
Although post combustion carbon capture technologies are mature, for BECCS EfW specifically it is not yet known how impurities in the flue gas resulting from contaminants in the waste feed, affect the CCUS solvent over long periods of time. The solvent is susceptible to degradation from contaminants which may be present in the flue gas, negatively impacting the performance of the technology[102].
2.3.4.1 Economics
Economic factors pose a significant issue to the deployment of CCS at EfW facilities. The addition of CCS increases capital investment required, which could be seen as increasing investment risk, particularly due to the uncertainties surrounding current policy and lack of transport infrastructure. Moreover, CCS utilises energy produced from the EfW facility that would otherwise be sellable, consequently creating a financial barrier for sites that would rather invest in other opportunities that would increase their revenue[102].
Furthermore, EfW facilities are subject to particular economic exposure due to gate price fluctuations and plant throughput. There are uncertainties surrounding how these factors may evolve in coming years, and how adding CCS may increase exposure to both gate prices as well as other policy driven value streams[102].
2.4 BECCS industry
2.4.1 Technology overview
BECCS industry relates to the use of biomass as an energy source for industrial applications and the capture of CO2 from the process and subsequent CO2 storage. Typical industrial applications include wood-based products (paper & pulp industries), distillation & fermentation processes and steel production. As there are no steel manufacturing industries in Scotland, we have added detail on the typical BECCS applications for this industry to Appendix 10.
One-quarter of industrial emissions arise from the physical or chemical processes[103], which cannot be reduced through fuel switching. Additionally, approximately one third of industrial energy demand is for high-temperature heat, hence limiting the potential decarbonisation options available. BECCS therefore provides a key opportunity to reduce emissions for industrial processes, while still maintaining the high-temperature heat for the processes. Conversion technologies will mostly consist of biomass combustion; therefore, CO2 will be captured via oxyfuel combustion or post-combustion capture (as outlined in section 1.2.1)
2.4.1.1 TRL
Due to the differences in industrial processes, as described above, the TRL of applying CCS varies between industrial sectors.
| Industry | Technology type | TRL |
|---|---|---|
| Cement | Fuel firing in rotary kilns with CO2 capture | TRL 7[90] |
| Steel | Blast furnace with CO2 capture | TRL 5[90] |
| Torrefied biomass in steel furnace with CO2 capture | TRL 7[90] | |
| Wood-based products | Combustion of biomass fuel or process waste, to provide power and/or heat for production process | TRL in-line with readiness for post-combustion CCS for BECCS power or CHP. See section 2.2. |
| Fermentation (Brewing and whisky industries) | Membrane capture from fermentation process | TRL 9[104] |
2.4.1.2 Costs
| Industry | Technology type | CO2 Captured, MtCO2/year | Capital cost, £M | Operating cost (fixed), £/tCO2 | CO2 avoided, £/tCO2 |
|---|---|---|---|---|---|
| Cement | Amine post-combustion capture[253] | 0.293* | 87.6 | 8.2 | 102.49 (FOAK) 85.13 (NOAK) |
| Wood-based products | Amine post-combustion capture for onsite power and heat generation | CAPEX, OPEX and cost of carbon in-line with costs for post-combustion CCS for BECCS power or CHP. See section 2.2. | |||
| Fermentation (Brewing and whisky industries) | Membrane bio reactor plant | All vary with capacity of alcohol produced. Tennent’s Lager aims to capture 4.2kt/year at an investment of £2.6M[105]; North British Distilleries claim to capture ~ 4 t/day[104] | |||
*Units relate to CO2 captured and stored/utilised
Note that for sites which do not currently use biomass fuel sources, additional costs for fuel switching would need to be considered – these costs will vary considerably depending on the process and plant capacity required.
2.4.1.3 Inputs / outputs
Cement
The manufacturing of cement involves the calcination of sources of calcium, silica, and alumina, such as limestone, clay, and sand, which are typically sourced locally. These raw materials undergo several successive operations, including quarrying, homogenisation, preheating, calcination, clinkerisation, cooling, blending, storage, and dispatch.
The clinker is produced in high temperature kilns, requiring operating temperatures of 1400-1500degC. The necessary high temperatures are predominantly provided by the combustion of fuel, such as coal, petroleum coke and natural gas. However, the rotary kilns are able to make use of a wide range of fuel types, therefore efforts are already underway to shift to alternative, low-carbon sources of fuel.
2.4.1.4 Schematics
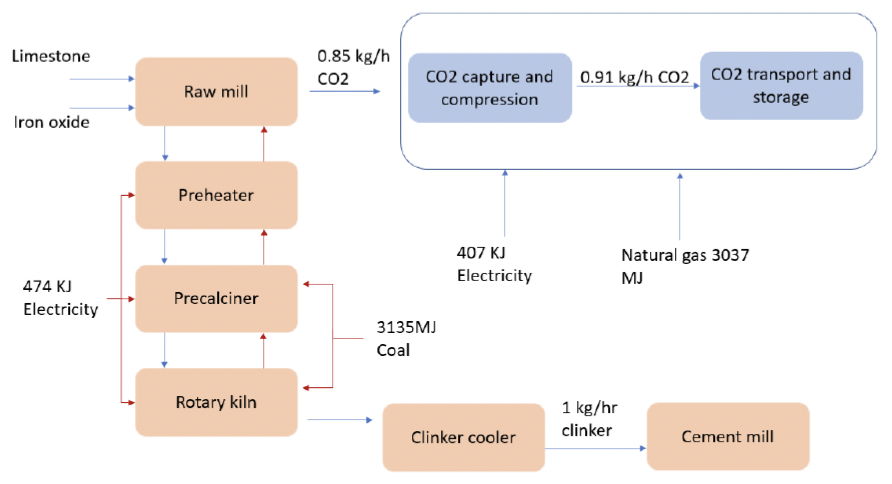
Mass and energy balances were taken from Voldsund et al[106], assuming that MEA post-combustion capture is retrofitted to a reference European clinker plant. This was deemed reasonable for the purposes of this report, since there is only one cement plant within Scotland (Dunbar) which will require CCS retrofit[22]. There appears to be no plans in the pipeline to build a new cement plant in Scotland, and so there is no further discussion on alternative clinker production routes (e.g., calcium looping, oxyfuel capture, etc).
Cement
Pulp and paper
The raw materials used in the production of pulp and paper consist of fibrous plant materials from trees and plants. Waste materials can also be utilised, such as waste-paper. The main form of fibrous plant materials used in the paper manufacturing process consists of wood from sawmills, which can be in the form of wood chips, logs or sawdust. Chemical or mechanical pulping is then used to breakdown lignin in the plant materials, producing a pulp. The pulp is then cleaned before going through the paper production process, involving stretching, pressing and drying.
The paper industry also utilises significant volumes of water throughout the manufacturing process. The production process also requires significant amounts of heat and electricity, with the vast majority arising from the pulping process.
Process wastes (considered by-products), in the form of biomass wastes which cannot be used in the pulp and paper production process, are often utilised on site to generate electricity and heat to power the paper mills. The chemical pulping process (known as the Kraft process) results in by-products of hog fuel (solid wastage from the raw material input), black liquor and crude tall oil. The arising black liquor from the Kraft pulping process provides the majority of the BECCS potential from the process[107]. However, the only pulping process in Scotland is mechanical pulping, using the Pressurised Groundwood (PGW) process[108]. Whilst some wastage is generated, in the form of bark or paper sludge, mechanical pulping is more efficient at converting wood to pulp, resulting in less potential for BECCS from by-products[109]. The greatest potential for CCS arises from providing the required process power and heat, only if this is provided by bioenergy CHP.
Wood-based products
Products such as paper, medium-density fibre board (MDF), particle board, oriented strand board (OSB) and wood pellets require wood-based raw material as the main input. Natural wastage from the process can be used to partially provide the required power and heat for the production processes. The wastage may also be supplemented by virgin wood fuel. According to Renewables Obligation annual sustainability reporting for 2019/2020, the only pulping plant in Scotland (UPM Caledonian) consumed 280 kt of fuel, sourced from virgin roundwood, aboricultural arisings, forestry and sawmill residues, bark, recycled wood and paper sludge[110]. Similarly, Balcas Invergordon (a wood pellet manufacturer) consumed 108 kt of bark and woodchip from roundwood and forestry residues.
Process heat and power at sites such as UPM Caledonian, Balcas Invergordon, and the West-Fraser (previously Norbord) Cowie and Morayhill is provided by biomass CHP. The potential, in relation to fuel input, and associated costs of CCS at these sites will be similar to those described for BECCS power in section 2.2.
Fermentation (brewing and whisky industries)
CCUS is also applicable to the brewing and whisky industries where process emissions from fermentation can be easily captured with technologies which are already available[111]. Around 0.5Mt/year of carbon dioxide is produced by Scottish breweries and distilleries. Usually, carbon dioxide is extracted from such operations but is not collected and is released into the atmosphere. The recovery of CO2 process emissions from such sites and storing it permanently provides a real and easy opportunity for achieving NETs in Scotland.
2.4.2 Potential Carbon impact
2.4.2.1 Cement
Cement is used as a key input to concrete, which is the most widely used construction material in the world[112]. The cement sector is a large contributor to global emissions; hence it is crucial to determine effective methods of reducing emissions from the sector. Emissions from the cement sector arise from combustion of fuels, the conversion of limestone to calcium oxide, as well as other downstream plant operations. It is estimated that approximately 60-70% of emissions arise from the conversion of limestone to calcium oxide, and about 30-40% from the use of fuel inputs to the industrial process[112].
2.4.2.2 Pulp and paper
The pulp and paper industry cogenerates heat and electricity, where biomass is a typical fuel source. It is estimated that biogenic emissions account for approximately 75% of on-site CO2 emissions[113], through the combustion of process wastes, hence there is great potential to result in negative emissions with the addition of a CO2 capture unit.
2.4.2.3 Brewing and whisky industries
Brewing and whisky sites are string candidates to deliver negative emissions in Scotland at an early stage and prior to 2030 with readily available technology. The negative emission potential arises from capturing and permanently storing process emissions as well as combustion emissions. On the combustion side, a strong competitor will be hydrogen which is being considered by many distilleries across Scotland.
2.4.3 Potential locations in Scotland (map)
2.4.3.1 Cement
There is only one cement plant in Scotland at Dunbar, which releases 570 ktCO2/year emissions (mostly fossil based)[22]. The site produces 867 t/d of clinker with a heat consumption of 0.91 kWh/kg[114].
2.4.3.2 Pulp and paper
Scotland has three paper or board mills in total: Caledonia paper mill (located in Ayr), Cowie MDF and particleboard facility (located near Stirling), and Invergordon Pellet Mill (north of Inverness). These are all existing sites, with the Cowie facility having the closest proximity to access to existing pipelines that could be used for CO2 transport (if upgraded accordingly). The remaining projects would require truck or rail transportation to CCS hubs. The only pulp production plant is the UPM Caledonian mill, with the remaining 2 facilities being panel board and pellet manufacturers. CCS from the pulp-to-paper production is not mentioned and is not considered as a decarbonisation option by the confederation of paper industries (CPI), due to the small size of most sites[115].
These existing sites which can be retrofitted with CCS can capture up to 0.363 MtCO2/year at an investment cost £248.3M and operational cost of £51.9M/year. If the West Fraser Morayhill Mill plant is also considered, then the total CO2 capture potential rises to 0.469 Mt/year, which closely matches the value of 0.676 Mt/year calculated by Element Energy[22].
2.4.4 Technology specific limitations & barriers
2.4.4.1 Technical
Several technical barriers from application of CO2 capture in the power sector are also applicable to the industrial sector. A key example is the low concentrations of CO2 which are likely to be present in the flue gas stream, as well as the high energy required for solvent regeneration in post-combustion capture plants. Additionally, the emissions at industrial plants are more likely to be dispersed and hence additional challenges arise from the need to capture emissions from multiple point sources located around the entire plant.
There are also additional technical barriers that relate to the specific industrial application in the production of cement, steel and pulp and paper. Currently, many cement production plants around the world are utilising a mixture of fossil fuels and low-carbon fuels, as there are currently some concerns associated with only burning alternative fuels in the kiln, due to variations in combustion temperatures. There are therefore current technical barriers to the potential for utilising biomass in the cement production process, where co-firing of biomass with fossil-based fuels occurs at up to 35-40% biomass. This leads to technical limitations with the amount of biogenic CO2 that can be captured to result in negative emissions.
The current dominant energy carrier in the cement industry is coal, constituting approximately 70% of the total energy consumption with biomass and other alternative fuels accounting for ~5%[116]. The introduction of biomass as a fuel source requires increased thermal and electrical energy input due to the inherent characteristics, which necessitate increased processing and pre-treatment requirements, such as high moisture content, particle size and a possible need for elevated oxygen levels. To meet the thermal energy demand in the calciner burners, which account for 60% of the total thermal load of a cement plant alternative fuels such as refuse-derived fuels and agricultural waste can be used to substitute up to 100% of its thermal demand. It has been demonstrated that up to 20% substitution rate is achievable, whilst minimising process modification and increased capital expenditure. In the UK, an estimated 17% total thermal input substitution is seen[117].
However, limitations to further adoption and substitution of biomass as a fuel source is attributable to the technical complexities associated with solid biomass co-firing in the kiln and calciner burners, which create operational complications in maintaining suitable temperature profiles and combustion velocities. Although the cement kilns exhibit a high degree of fuel flexibility, the minimum calorific value required for efficient kiln operation exceeds the energy content of a majority of alternative biomass fuels.
In selecting a suitable biomass fuel for cement production, it is important to consider its availability and the specific energy requirements of the kiln and calciner burners, which typically require a minimum calorific value of 3.89kWh/kg and 2.22kWh/kg, respectively[118]. Furthermore, accounting for the typical non-homogeneity of biomass fuel physical and chemical characteristics are of relevance, including moisture content, size distribution, volatile matter, and ash content.
2.4.4.2 Economic
As with CO2 capture applied to the power sector, the addition of CO2 capture to industrial processes results in a large increase in the energy demand and hence high associated costs. In sectors where the current fuel use is predominantly fossil fuel based, the costs of achieving negative emissions are also likely to be higher than in sectors which already make use of a large share of biomass, such as in the production of pulp and paper.
2.5 BECCS Hydrogen
2.5.1 Technology overview
2.5.1.1 TRL
The technological maturity of biohydrogen is broad, with BEIS[119] and Element Energy[66] estimating a TRL of 4-6 (meaning that the technology is within its innovation/prototype phase), whilst the University of Edinburgh estimates a larger TRL of 5-9 (meaning the technology is closer to full commercial application)[35]. Biohydrogen’s TRL has potential to improve if confidence in biomethane and gasification technologies continues to grow[57].
2.5.1.2 Costs
Analysis by Element Energy estimates future BECCS hydrogen costs to be £50-120/tCO2 (by 2030) and £30-100/tCO2 (by 2050)[119], whilst the CCC highlights gasification-CCS costs to be £106/MWh (by 2025) and £64-127/MWh (by 2040)[120]. Further work by BEIS provides a thorough breakdown in gasification-CCS costs, SMR-CCS and ATR-CCS, as detailed below in Table 28 and in Table 29[121], [122]. The cost of SMR-CCS and ATR-CCS cover the installation of new hydrogen plants and CCS, with CCS costs not being disaggregated from total costs.
| Technology type | Capacity (t/year) | CAPEX (M£) | OPEX (M£/year) | ||||
|---|---|---|---|---|---|---|---|
| Fuel input | CO2 output | Hydrogen | Plant | CCS | Plant | CCS | |
| Wood gasification | 330,000 | 303,400 | 12,600 | 304 | 63 | 60 | 6 |
| Pellet gasification | 1,000,000 | 1,712,500 | 72,600 | 982 | 191 | 327 | 30 |
| MSW gasification | 100,000 | 93,900 | 3,900 | 171 | 31 | 9 | 3 |
| 550,000 | 519,000 | 22,00 | 499 | 93 | 19 | 11 | |
| Technology type | Year | CAPEX (£/MWh, HHV*) | OPEX | CO2 T&S and carbon cost | |||
|---|---|---|---|---|---|---|---|
| 300MW | 1000MW | 300MW | 1000MW | 300MW | 1000MW | ||
| SMR-CCS | 2025 | 10 | 7 | 3 | 3 | 8 | 8 |
| 2030 | 9 | 7 | 3 | 3 | 10 | 10 | |
| 2035 | 9 | 7 | 3 | 3 | 11 | 11 | |
| 2040 | 8 | 6 | 3 | 3 | 12 | 12 | |
| 2045 | 8 | 6 | 3 | 3 | 13 | 13 | |
| ATR-CCS | 2025 | 12 | 8 | 3 | 3 | 7 | 7 |
| 2030 | 11 | 7 | 3 | 3 | 8 | 8 | |
| 2035 | 10 | 7 | 3 | 3 | 8 | 8 | |
| 2040 | 10 | 6 | 3 | 3 | 9 | 9 | |
| 2045 | 9 | 6 | 3 | 3 | 9 | 9 | |
*High Heating Value
2.5.1.3 Inputs/outputs
Inputs
Feedstocks and land requirements: Bioresources from the food and drink sector, and slurries and farmyard manure from the agricultural sector, are favoured in anaerobic digestion and gasification, due to their abundance and low environmental impact[57], [74]. The availability of these waste feedstocks will increase in the future, due to the proposed Scottish ban on biodegradable MSW going to landfill, as well as the utilisation of these feedstocks being incentivised through the green gas support scheme[57]. However, there is potential competition with other BECCS technologies and the fact that biohydrogen exhibits large land requirement (0.8-2.5 m2/kW H2 versus 0.07-0.14 m2/kW,H2for blue hydrogen)[120]. Furthermore, to ensure negative emissions, the source of biomass must maintain low supply chain and process emissions, meaning biomass imports should be limited and feedstocks that do not require intensive pre-processing steps should be favoured[123].
Water demands: The production of biohydrogen through SMR will require supplementary natural gas/biomethane firing in order to meet onsite energy demands. To provide this heat, high temperature steam must be produced using demineralised water, which is also utilised as feedstock within the reforming and RWGS reactions. This water demand is similar for both SMR and ATR (11.52 kgH2O/kWhH2)[127]. In terms of bio-gasification, the water demands are similar to conventional blue hydrogen production (0.2-0.6 l/kWh)[120]. Please note that these water demands will vary depending on the choice of feedstock, operating conditions, and CO2 capture method, as highlighted in the schematics below.
Energy demands: Please see Figure 9 and Appendix 12.
Outputs
Biohydrogen and negative emissions: The key benefit of BECCS hydrogen is its ability to simultaneously provide low-carbon H2and negative emissions[124]. The growth in biohydrogen is expected to be driven by the UK Government’s plan to prioritise biomass use for hydrogen production in heavy industry, with capacities ramping up from 1GW in 2025 to 7-20 GW by 2035. On this trajectory, 250-460TWh of hydrogen could be utilised by 2050, 20% of which would be sourced by biomass gasification[124]. This growth in biohydrogen production will be fuelled by the £240m Net Zero Hydrogen Fund[124], the BEIS NZIP Innovation Programme[124], and the Scottish Government’s £100M hydrogen investment programme[68].
Biohydrogen and negative emissions: Analysis by Element Energy estimates that between 2.3-3.5 MWh/tCO2 of biohydrogen is produced when utilising 3-3.1 MWh of biomass[119], where high purities of 99.8%[120]and 99.9%[127] are possible. The biohydrogen could be used to provide low-carbon heating, be used in industry to produce green fertilisers and high temperature heat, or in freight transport and aviation[125]. The captured CO2 can be stored to achieve negative emissions or be utilised in a range of sectors: such as fertiliser production, food and beverages, low carbon concrete, e-fuels, and aggregates[126].
Waste: The by-products of anaerobic digestion and gasification include ash removal, tar removal, particulate and heavy metal removals, and acid gas removal. All of which are treated and disposed of accordingly.
2.5.1.4 Schematic
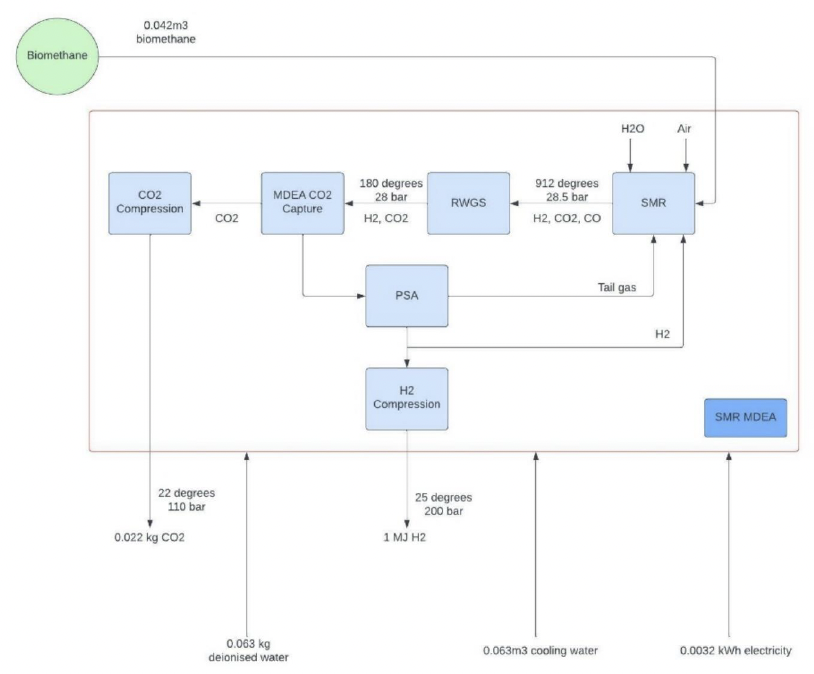
Figure 9 shows Hydrogen produced via SMR of biomethane with MDEA CO2 capture, potentially the most “common” form of biohydrogen production. For the biomethane reforming schematics (including those in Appendix 9), mass and energy balances were taken from Antonin et al[127].
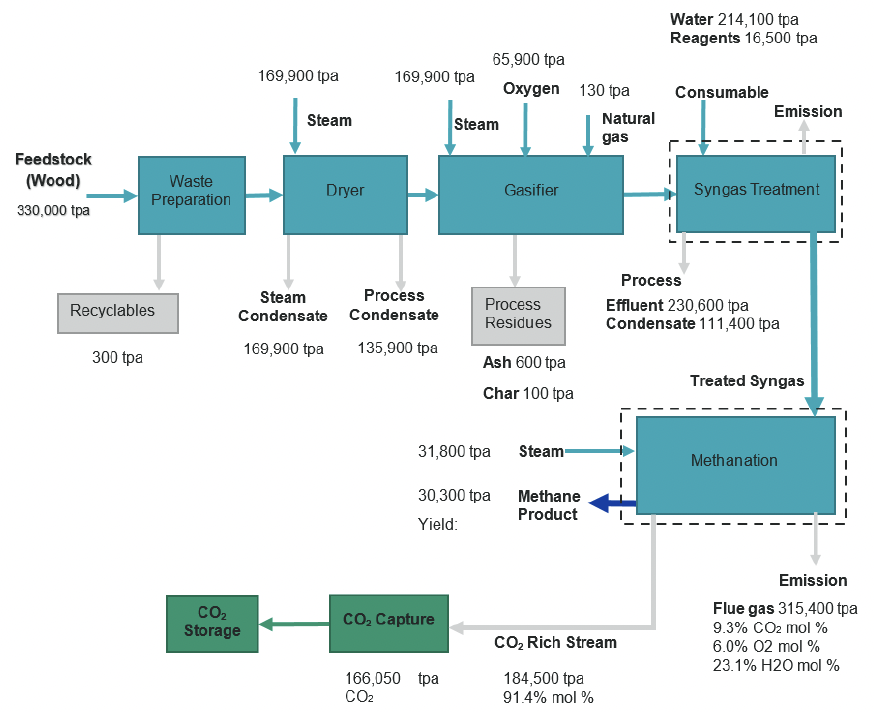
For the gasification schematic, energy/mass balances were taken from Materazzi et al[128], which is in turn taken from a 62MW hydrogen plant. This considers an initial bubbling fluidised bed gasifier operated at 700–800degC, in which steam and oxygen are used to partially oxidise the waste feedstock, and a plasma converter to refine the syngas. Please note that all heating demands are met onsite via a steam system and by imported power.
Additional schematics for BECCS Hydrogen are included in Appendix 12 and include:
- Hydrogen produced via SMR of biomethane with VSPA CO2 capture (Figure 22)
- Hydrogen produced via ATR of biomethane with MDEA CO2 capture (Figure 23)
- Hydrogen produced via ATR of biomethane with VSPA CO2 capture (Figure 24)
- Hydrogen production via gasification and subsequent reformation of the syngas (Figure 25)
2.5.2 Potential carbon impact
For the pathways modelling, performance data for a reference BECCS Hydrogen plant is needed to calculate the CO2 capture potential in Scotland. The carbon conversion factors were taken to be 0.0792kgCO2/kWh,H2 for biomethane SMR, 0.248 to 0.256kgCO2/kWh,H2 for biomethane ATR, 0.72 kgCO2/kWh,H2 for gasifying wood, and 1.764kgCO2/kWh,H2 for gasifying MSW. These factors are taken directly from the mass balances of the schematics (including those in appendix 9), since no BECCS Hydrogen plants were available in the literature to refer to. The CO2 capture rate was assumed to be 90% (see Section 1.2.1 for supplementary details) and the utilisation factor of the plant is taken to be 85%, based on modelling carried out by BEIS[121]. The biogenic content of the captured CO2 is assumed to be 100% if biomass feedstocks are utilised and 50.3% if MSW is used (see Section 2.3.2 for more information).
Carbon footprint
A key benefit of BECCS hydrogen is the provision of both hydrogen and negative emissions. The use of waste biomass appears to maximise negative emissions (-2.88kgCO2/kWh,H2to -0.45kgCO2/kWh,H2)[120], [127] compared to non-waste feedstocks[74]. In fact, negative emissions can be achieved without the use of CCS (-1.44kgCO2/kWh), if AD digestate is applied to the soil as a fertiliser[127]. It must also be noted that BECCSH2exhibits an inverse relationship between carbon negativity and process efficiency; meaning the inclusion of CCS reduces process efficiencies, which prompts greater biomass consumption, and hence increases capture of biogenic carbon[13]. Please note that negative emissions are only possible if supply chain emissions remain low, which can be achieved by focussing on decarbonising biomass transport (shipping and rail in particular)[58].
The blending of biohydrogen with fossil-derived natural gas can also lead to negative emissions; most notably, biomass integrated gasification combined cycle (BIGCC-CCS) and hydrogen thermal combined cycle (HTCC-CCS) achieve emissions of 220 to -650 kgCO2/MWh and 300 to -750 kgCO2/MWh respectively. Carbon neutrality is achieved at blending proportions of 15-40%[123].
Non-GWP emissions
However, despite the benefit of reduced carbon emissions, biohydrogen production leads to a 72-162% increase in non-GWP emissions. This is directly linked to the inclusion of CCS, which has an energy penalty that must be compensated for by greater biomass use and electricity imports, which increases electricity demand, eutrophication potential (EP), fossil depletion potential (FDP), ozone depletion potential (ODP), photochemical oxidant formation potential (POFP) and terrestrial acidification potential (TAP)[74].
2.5.3 Potential locations in Scotland
Future hydrogen clusters include Acorn H2 (located in St Fergus), where blue H2 will be produced to heat homes, power transport and be used in industry; Aberdeen City Council; and H100 Fife, where green H2 will be used to heat domestic households[120]. CO2 produced during H2 production can be captured, transported, and stored in the North Sea using existing oil and gas infrastructure, which the Acorn site plans to utilise. However, there are currently no BECCS H2 plants in operation, with only circa 20 existing biomethane sites in Scotland which could be used to produce H2 via steam reforming[66].
Spatial analysis undertaken by Freer et al[58] concluded that optimal biomass residue locations for hydrogen production are dependent on biomass, energy end-user and low carbon infrastructure. In particular, emissions are tethered to the location of the BECCS H2 facility, with the lowest emissions being exhibited in rural areas with strong access to biomass resources. This is highlighted by the fact that transport emissions can increase by 8.6% to 13.1% if the BECCS location is shifted 10km away from an optimal location.
2.5.4 Technology-specific limitations & barriers
As highlighted in the TRL section, there remains to be a lack of demonstration of advanced biomass gasification technologies, with further demonstration and commercialisation needed alongside pilot projects for CO2 capture[119]. The timescales required to develop a CCUS facility are 5-8 years, from commencing detailed engineering work to building and operating the facility[22], so works needs to begin now if BECCS H2 is to reach the capacities necessary.
To overcome these barriers, the UK Government aims to support both low carbon H2 and CCUS providers by incentivising the adoption of low carbon H2 production through the Government’s hydrogen business model, which will provide revenue via CfDs to overcome the operating cost gap between low carbon hydrogen and high carbon counterfactual fuels[22]. This business model does not explicitly value negative emissions; however, it will provide support to cover the costs of installing and operating CCS technology. The Government has also developed a Low Carbon Hydrogen Standard, which sets a maximum threshold for GHG emissions allowed in the production process for hydrogen to be considered ‘low carbon hydrogen’, and hence be eligible for certain government funding[22]. The rewarding of biohydrogen fuel certificates via the Renewable Transport Fuel Obligation (RTFO) could also provide a potential route[22].
With regards to biomethane production, which in turn could be utilised to produce biohydrogen, the key constraints are on low pressure gas networks, increased regulatory scrutiny on the management of digestate use, and limited availability of biogenic waste depending on future regulations[57], [127]. During AD and gasification, the additional demands of feedstock preparation and syngas cleaning, which are expensive to install and run, lead to uncertainties over the true scalability of BECCS H2[124].
2.6 BECCS biomethane
2.6.1 Technology overview
There are multiple pathways to produce biomethane, the first being thermochemical conversion routes which covers gasification and pyrolysis. Other methods include anaerobic digestion, whereby biogas (syngas) or biohydrogen are produced and then converted to biomethane. The two common practices of converting biogas to biomethane are upgrading, a process that removes any CO2 and other contaminants present in the biogas, and methanation which makes use of a catalyst to promote reaction between the hydrogen and CO or CO2 to produce methane.
2.6.1.1 TRL
Biomethane can be produced through multiple routes, namely anaerobic digestion followed by upgrading of biogas; the removal of CO2 is an inherent part of the process and consequently “upgrading” technologies are already well established as they have been refined over the last 20 years. The TRL ranges between 8 - 9 for anaerobic digestion and biomethane/CO2 separation, as the technology is commercially mature.
2.6.1.2 Economics
Costs associated with biomass and waste gasification to produce biomethane are detailed below based on analysis conducted by Element Energy[66].
| Technology type | Capacity | CAPEX* | OPEX* | ||||
|---|---|---|---|---|---|---|---|
| Fuel input (t/year) | CO2 output (t/year) | Biomethane (t/year) | Plant (£M) | CCS (£M/year) | Plant (£M) | CCS (£M/year) | |
| Wood gasification | 330,000 | 131,500 | 30,300 | 293 | 54 | 59 | 5 |
| Pellet gasification | 1,000,000 | 1,289,200 | 175,200 | 946 | 163 | 325 | 24 |
| MSW gasification | 100,000 | 71,100 | 9,800 | 164 | 26 | 9 | 2 |
| 550,000 | 385,700 | 55,100 | 481 | 76 | 18 | 9 | |
*All CAPEX and OPEX costs rounded to the nearest £M
Costs associated with biomethane production via AD upgrading were taken from a IEAGHG paper, which provides a breakdown in plant investment, operation and CCS costs for different feedstocks[129]. These costs are based off a plant utilisation factor of circa 91%.
| Feedstock | Year | Capacity (MW) | CAPEX (£/kW)* | OPEX (£/kW)* | ||
|---|---|---|---|---|---|---|
| Plant | CCS | Plant | CCS | |||
| Energy crops and agricultural residues | 2030 | 10 | 855 | 92.7 | 76.5 | 11.7 |
| 2050 | 15 | 855 | 83.7 | 76.5 | 10.8 | |
| MSW | 2030 | 10 | 1485 | 92.7 | 162 | 11.7 |
| 2050 | 15 | 1485 | 83.7 | 162 | 10.8 | |
| Sewage/manure | 2030 | 10 | 1035 | 121.5 | 76.5 | 16.2 |
| 2050 | 15 | 1035 | 109.5 | 76.5 | 16.2 | |
*Assumes a euro to pound conversion ratio 0.9
2.6.1.3 Inputs / outputs
Inputs
Biomethane is formed from the methanation or upgrading of biogas. To produce biogas, various feedstocks can be utilised depending on the pathway. Manure, sewage sludge, municipal solid waste, specifically food waste, and crop residues are frequently employed as feedstock for the production of biogas by anaerobic digestion. The gasification and pyrolysis routes to biomethane make use of MSW and energy crops, in addition to woody biomass which consists of residues from forest management and wood processing.
Outputs
Regardless of the biomethane production pathway (gasification, pyrolysis, or AD), a combustible gas, known as biogas, is produced with a varying composition depending on feedstock as well as technology. This biogas contains differing quantities of methane, carbon dioxide, water, hydrogen sulphide, nitrogen, oxygen, ammonia, tars, and particles[130]. The upgrading process serves two goals: to increase the concentration of methane from approximately 50% to >90% and remove CO2 along with other contaminants[131]. Oftentimes, the separated CO2 stream needs to be cleaned before it can be compressed, transported, and stored.
| Molecule | Biogas | Biomethane |
|---|---|---|
| Carbon Dioxide | 40 - 50 % | 2 - 6 % |
| Methane | 50 - 60 % | 93 - 97 % |
| Other (Hydrogen Sulphide, Nitrogen, etc.) | < 5 % | Trace |
The production of biogas results in the creation of several other waste products, such as biochar, pyrolysis oil and bottom ash. Further details on the waste products of pyrolysis and gasification of biomass can be found in 2.2 BECCS Energy from Waste.
2.6.1.4 Schematics
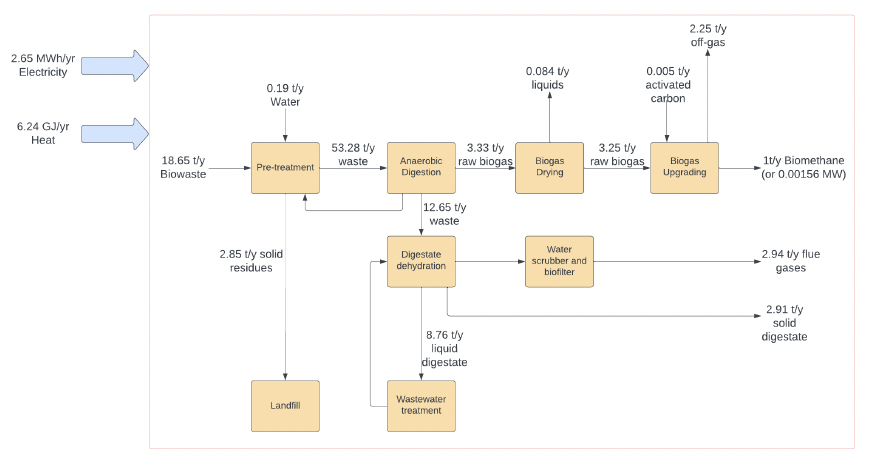
The mass and energy balance for waste anaerobic digestion and biogas upgrading was taken from a LCA paper conducted by Ardolino and Arena[132].
2.6.2 Potential Carbon impact
Biomethane is fully substitutive of both natural gas and biogas. The production and utilisation of biomethane results in over 80% less GHG emissions in comparison to conventional fossil fuels, and therefore can play an important role in the decarbonisation of the energy sector[133].
BECCS biomethane has the potential to produce negative emissions, although this is dependent on residual biogenic carbon being captured and stored, resulting in a final fuel largely free of CO2. Moreover, the quantity of CO2 captured must exceed that associated with the input power and lifecycle emissions of the feedstock, which varies depending on the source. Default GHG emissions for rye, grass silage, and maize are between 126 to 158.4gCO2e/kWh biomethane; values that are significantly higher than other bioenergy routes, and as such will consequently result in a notably lower amount of gross biogenic CO2 being captured regarding NETs negative emissions[22]. Post biomethane upgrading, there will still exist trace amounts of CO2 (2-6%), therefore, when the fuel is combusted CO2 will be released, but these emissions would be deemed carbon neutral[131].
According to the International Energy Agency, if natural gas is replaced by biomethane production with CCS, annual GHG emission savings could be approximately 8 Gt in 2050. Furthermore, BECCS biomethane has the technical potential to remove upwards of 3.5 Gt of GHG emissions in 2050[134].
For the pathways modelling, performance data for a reference BECCS Biomethane plant is needed to calculate the CO2 capture potential in Scotland. The carbon conversion factors were taken to be 4.34 tCO2/tCH4 for woody biomass and 7.26 tCO2/tCH4 for MSW gasification[121], and 199.02 tCO2/GWh from the BEIS conversion factors database[93]. If the biomethane is subsequently combusted, and the CO2 captured, then an additional conversion factor of 183.7 tCO2/GWh is used when assuming stoichiometric reaction. The CO2 capture rate was assumed to be 90% (see Section 1.2.1 for further detail) and the utilisation factor of the plant is taken to be 85% for gasification[121]and 80% for AD upgrading[92]. The biogenic content of the captured CO2 is assumed to be 100% if biomass feedstocks are utilised and 50.3% if MSW is used (see Section 2.3.2 for more information).
2.6.3 Potential locations in Scotland (map)
2.6.3.1 Biomethane
As the REPD Database only considers projects that operate at a capacity greater than 1MW, then the majority of small-scale AD plants will have not been included in the above mapping. In the above map only 3 biomethane projects are included, which have a potential of producing 98.1 GWh/year of electricity and capture 0.05 MtCO2/year. This will come at an investment cost of £0.81M.
Further analysis by Element Energy highlights that there are approximately 84 AD facilities in Scotland, most of which have been built in recent years. Though, it should be noted that of the 84 sites, only 20 are confirmed to be upgrading biogas into biomethane, with a production of 716 GWh/year of biomethane and 140ktCO2/year[22]. Upwards of 290 ktCO2/year could be captured if half of the AD plants in Scotland are retrofit with biomethane upgrading, however, this is dependent on the number of AD plants where this is feasible. Biomethane is already injected into the gas grid or trucked, depending on plant location, however, one of the factor’s affecting applicability is the remaining AD sites’ proximity to gas grid connections[22].
The Scottish biomethane sector is predicted to triple in size from 2019 to 2030, as presented by the CCC in the sixth carbon budget, suggesting that BECCS biomethane is plausible and has the potential of contributing significantly to Scottish NETs[22]. It should be noted that this contribution is highly reliant on the establishment of downstream CO2 distribution chains and integration of new facilities into a national CCS network.
2.6.4 Technology specific limitations & barriers
There are several barriers to the large-scale deployment of biomethane BECCS, mainly due to economic factors and existing CO2 distribution infrastructure. The economic potential for biomethane BECCS is limited by natural gas and CO2 prices, despite the fact that lower capture costs are observed due to the high concentration of CO2 present in the output stream[22]. Additional barriers include high biomass transport costs; this limits the plant size which consequently leads to higher costs (per tonne of biomethane produced) for connecting to CO2 and natural gas infrastructure[134].
Furthermore, there are uncertainties surrounding the sale of biogenic CCS credits, as these factors are all yet to be confirmed. Schemes such as the UK ETS do not currently award negative emissions, and other UK policies regarding negative emission support are still in development[22].
2.7 Direct air capture
2.7.1 Technology overview
2.7.1.1 TRL
The TRL ranges from 4-6, meaning the technology is at the bench scale research to large scale deployment phase[59], [22]. However, stakeholders are more optimistic, and estimate a TRL of 6-7 (indicating the technology is ready for inactive commissioning)[22].
2.7.1.2 Economics
| Company | Configuration | Capacity (Mt/year) | CAPEX (M£)* | OPEX (£/tCO2)* | Levelised cost (£/tCO2)* |
|---|---|---|---|---|---|
| Carbon Engineering[227] | 1st Plant | 0.98 | 951.4 | 35.5 | 142 – 196 |
| Nth plant | 0.98 | 658.2 | 25 | 106 – 143.5 | |
| Grid electricity – Nth plant | 0.98 | 574.3 | 22 | 95.4 – 137.6 | |
| No CO2 compression and free O2 | 0.98 | 503.9 | 19.4 | 79.4 – 109.8 | |
| Fully electrified | 0.98 | N/A | N/A | 66.7 – 68.4 | |
| Climeworks[51] | Solid sorbent | 0.0009 | 2.5 – 3.4 | N/A | 422 – 506.6 |
| Antecy[52] | Solid sorbent | 0.36 | 246.3* | N/A | 165.5 – 126.7** |
*Assumed that Antecy plant operates over a 25-year lifetime and using a Euro to Great British Pounds conversion rate of 0.89.
Liquid solvent DACCS
According to Carbon Engineering their levelised cost of capture is estimated to be 79.3 £/tCO2* - 196 £/tCO2[227], [52]*. This range in cost considers FOAK costs, Nth plant costs, and potential to replace the existing NGCC with lower carbon alternatives. This is similar to analysis by Element Energy[135], who indicates that a first of a kind (FOAK) plant hybrid liquid DACCS plant could cost 318 £/tCO2.
Analysis by Fasihi et al[52] shows that if learning rates are taken into consideration, then it is expected levelised costs of the fully electrified liquid DACCS system will reduce from 267.7 – 250.8 £/tCO2* to 68.4 – 66.7 £/tCO2*, which is somewhat aided by the reduction in electricity demand from 1535 to 1316 kWh/tCO2. The NIC concurs[3], with DACCS experiencing large cost reductions driven through learning by doing, economies of scale, and efficiency improvements.
Solid adsorbent DACCS
According to McQueen et al[51] the Climeworks Hinwil pilot plant exhibits a levelised cost of £422 – 506.6 £/tCO2*, with an estimated CAPEX of 2,814 – 3,752 £/tCO2*. Analysis by Element Energy[22] agrees, where a FOAK hybrid solid sorbent plant costing 453 £/tCO2. These costs are significantly higher than compared to Carbon Engineering’s liquid solvent DACCS plant; however, once Learning Rates are accounted for, then the levelised costs could drop to 127 – 169 £/tCO2[51]*. Furthermore, Fasihi et al[52] anticipates more optimistic projections of reducing costs to 75 – 24.5 £/tCO2* by 2050, depending on whether heat is sourced via waste heat or heat pumps, and is in line with Climeworks’ aim of achieving production costs of 70 £/tCO2* in the future.
The other major solid sorbent DACCS company, Global Thermostat, expect their costs to drop to as low as 10 – 35.5 £/tCO2[52]*, whilst a smaller scale company based in the Netherlands named Antecy exhibits a present day levelised cost of 165.5 – 126.7 £/tCO2[52]*.
Moisture Swing Adsorption DACCS
According to Fasihi et al[52], the CAPEX of MSA is estimated to be 394 £/tCO2* with a levelised cost of 135 £/tCO2*. This is based off rather old data from 2009, which hasn’t been updated since. However, it is expected that future levelised costs could reduce significantly to 22 £/tCO2* by 2050, and hence be able to compete directly with liquid solvent and solid sorbent DACCS. This is driven by higher sorbent capture surface areas, higher CO2 uptake capacity per kg of sorbent, economies of scale and decreases in the costs of other materials.
*Values converted from USD to GBP using conversion of 1 USD = 0.83 GBP.
2.7.1.3 Inputs/outputs
Inputs
Solvent/adsorbent: According to Carbon Engineering, their pellet reactor requires a CaCO3 makeup stream of 0.03 t/tCO2 to account for material lost during disposal. Furthermore, it is assumed that all of the KOH solvent is regenerated and recycled back to the pellet reactor. As for Climeworks, the solid adsorbent used has a lifetime of <1 year, which averages to an adsorbent depletion rate of 7.5 kg/tCO2[51].
Land requirement: At first the land requirements of DACCS appear to be very low, with the construction of a capture facility only requiring ~0.01m2/tCO2[52]. However, once lifecycle land requirements are considered, such as the provision of low carbon heat/power[84] and maintaining adequate spacing between capture units to reduce local CO2 depletion[35], [52], do we see land demands rise dramatically. For example, powering solid sorbent DACCS with solar PV requires 1.87 m2/tCO2[84], whilst maintaining adequate spacing between capture units for liquid solvent DACCS requires ~1.5 km2/MtCO2[52].
Heat and electricity: As highlighted in Section 1.2.2, the heat and electricity demand of DACCS is significant, ranging from 1.46 to 2.45 MWh/tCO2 and 0 to1,535 kWh/tCO2 (please see Table 14). The nature of solid sorbent DACCS only requires low temperature heat (between 80-120degC), and so can be sourced from a variety of low carbon options: waste industrial heat, Fresnel solar-thermal heat collectors, and heat pumps[84]. This flexibility in design is a key advantage of solid sorbent DACCS, with the optimal configuration being the use of waste heat and onsite solar PV, where waste heat is characterised as ‘burden-free’[84]. On the other hand, liquid solvent DACCS requires high temperatures (in excess of 900degC), which can only realistically be sourced from natural gas combustion[23]. The energy penalty of DACCS can be reduced by a fifth if a less pure stream of CO2 is captured; however, this compromises the carbon capture efficiency of the facility[84].
Water and CO2 absorption rates: For liquid solvent DACCS, the condition of the ambient air has a significant impact on CO2 absorption and water losses[48]. Under hot and dry conditions, there is a benefit of higher CO2 absorption rates, due to the exponential relationship between temperature and chemical reaction rate; but at the expense of rising water consumption (19.8 t/tCO2). Cooler conditions can help reduce this water consumption to 7.3t/tCO2; but with the CO2 capture rate halving. The impact of humidity is also key, with higher humidity reducing water consumption whilst reaction rates remain reasonable. Therefore, it is best to locate a liquid DACCS plant in a warm and humid climate, whilst avoiding arid conditions[48]. For Carbon Engineering, their plant consumes a moderate 4.7 t/tCO2 under mild conditions (20degC and 64% RH)[23]. During solid sorbent DACCS the moisture in the air is captured during adsorption, and hence acts as a NETs producer of water that is utilised onsite[52]. This is another key benefit of using solid sorbents.
Natural gas: For liquid solvent DACCS, the energy demands of the system are inversely proportional to the carbon capture efficiency. This is highlighted by An et al[48], where increasing the capture rate from 40% to 85% results in a reduction of natural gas demand from 1.39 MWh/tCO2 to 0.86 MWh/tCO2 (a 38% decrease). This is in accordance with onsite demands being solely met by a NGCC unit. If instead electricity demands are met through the grid, then carbon capture efficiency becomes tethered to the carbon intensity of the grid. In fact, grid carbon intensity must be below 62 gCO2e/kWh to compete with NGCC[48]. Upstream fuel emissions are also significant, with capture efficiencies significantly dropping to 32%-49% if natural gas leakage rates rise to 6%, resulting in an energy consumption of 3.08 MWh/tCO2[48]
Outputs
CO2: The key output of all DAC technologies is a pure stream of CO2, which can either be sequestered to achieve negative emissions (known as DACCS) or be utilised. Existing markets for utilisation include the fertiliser and food & beverage industries, whilst new markets expect to grow significantly in the near future for the production of e-fuels, low carbon concrete, and aggregates[126].
However, the act of reducing GWP through DACCS can come at the expense of increased non-GWP emissions (also known as burden shifting), depending on the source of electricity and heat. Namely acidification, eutrophication, ozone layer depletion and respiratory effects are the most heavily impacted[84].
Wastes: During liquid solvent DACCS, waste from CaCO3 fines exiting the pellet reactor must be disposed of within landfill[23]; whilst for solid sorbent DACCS, adsorbents at their end of life must be dealt with appropriately[59].
Water: It has already been established that solid sorbent DACCS is a NETs producer of water, with Climeworks producing 0.8–2 t/tCO2, which can be used to meet onsite demands or be utilised for electrolysis to produce e-fuels[52].
2.7.1.4 Schematic
Liquid solvent DACCS
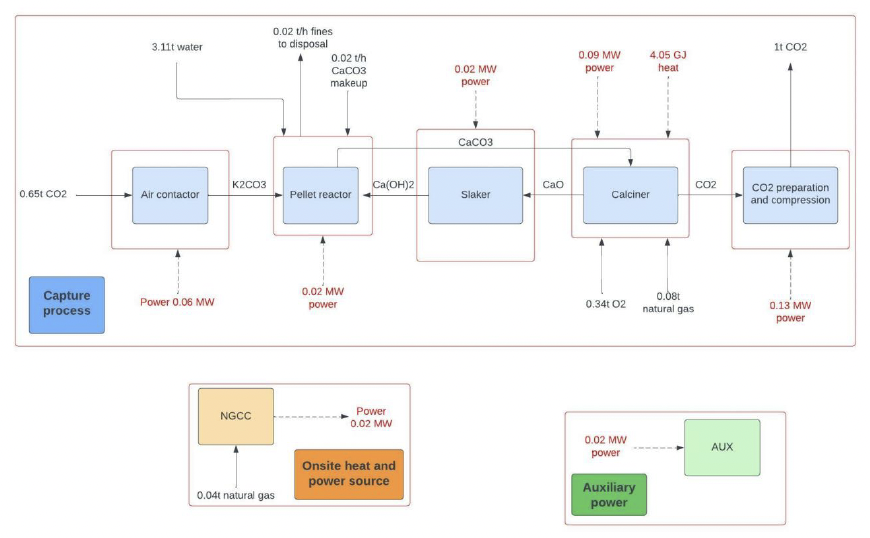
Solid sorbent DACCS
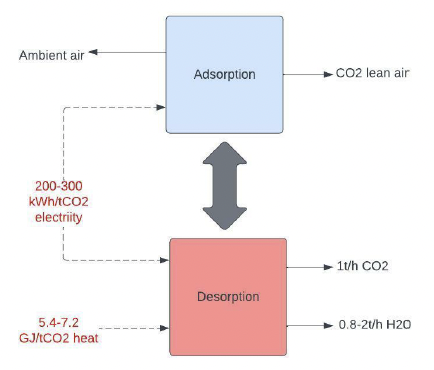
2.7.2 Potential carbon impact
In all instances, both liquid solvent and solid sorbent DACCS exhibit negative emissions, where the source of electricity and heat act as the key emissions hotspots. In the case of liquid solvent DACCS, carbon removal efficiency ranges from 10%-92%, depending on whether the system is powered with coal electricity or by renewables and heat recovery[49]. Similarly, solid sorbent DACCS exhibits removals of 9% - 97%; depending on whether a carbon-intensive grid supplies electricity and heat demands (via heat pumps), or if waste heat and low carbon electricity are used. Please note that to maintain negative emissions the carbon intensity of the grid must remain below 0.87 kg CO2-eq./kWh[84]. Once sourced with low carbon heat and power, the emissions associated with construction, sorbent consumption and CO2 T&S become hotpots[84]. These key findings are consistent with the remaining literature reviewed[48], [74].
2.7.3 Potential locations in Scotland
As discussed previously, the choice of location will greatly impact the operability of a liquid solvent DACCS facility[48]. For Scotland, the climate is typically mild and access to water is plentiful, so any risks associated with water loss are minimal; however, it is likely that CO2 absorptions rates will reduce during the winter months. This limitation is not exhibited for solid sorbent DACCS.
As DACCS is flexible in terms of its deployment, then it can be built close to cheap abundant energy and geological storage sites[74]. This is the reasoning behind why Carbon Engineering’s Storegga plant will be located close to the Acorn site, which aims to utilise existing oil and gas infrastructure to remove 0.5-1.0 MtCO2/year by 2026[22]. Scottish DACCS deployment could further expand if residual waste heat from industrial hubs, such as Grangemouth, is utilised for solid sorbent DACCS, or if low-grade heat is upgraded via heat pumps and used directly. One such DACCS project funded under the GGR Development Programme proposes utilise 400MWth of waste heat from the Sizewell C nuclear plant to capture 1.5 Mt/year[4]. There is also potential to pair Scotland’s offshore wind energy with DACCS facilities[22].
2.7.4 Technology specific limitations & barriers
As the economy continues to decarbonise, there will be competing uses of low carbon electricity which may gain priority over DACCS, such as heating and transport. This will in turn hamper the scalability of the technology. To get around this, DACCS could be powered by fossil fuels; however, this would compromise carbon removal efficiency and go against Net Zero pledges. This is in contrast to BECCS and biochar, which are NETs producers of heat and power[74].
The land demands of DACCS are significant, as sufficient space between the capture units needs to be guaranteed to limit the effects of local CO2 depletion, which impacts vegetation, wildlife, and capture efficiency[52], [135]. This calls into question the practicality of scaling up DACCS to the capacities suggested by the NIC, CCPu and CCC.
When compared to BECCS, DACCS is more energy and materially intensive, and so exhibits higher non-GWP environmental impacts and costs. This in turn leads to Jeswani et al[74] rating DACCS, alongside EW, as the least effective NET. However, electricity costs may be reduced if DACCS facilities are co-located or powered by constrained renewables. Low carbon energy sources, such as heat pumps, geothermal, and solar thermal, could potentially provide heat to solid adsorbent DACCS facilities, although, this is not possible for liquid solvent DACCS facilities due to the high temperature requirements[136].
Liquid solvent DACCS:
- The fabrication of the PVC packing materials and specialty process equipment, such as the contactor and fluidized bed calciner, may pose issues for rapid, large-scale implementation[51].
- The constraint of high-water requirements, depending on location, could limit the locational flexibility of DACCS plants, particularly in dry and remote desert regions where both water demand and its transportation cost could be high[52].
Solid sorbent DACCS:
- During initial plant iterations the adsorbent will likely be consumed at a rate of 7.5 g/kgCO2, which leads to a sorbent lifetime of <1 year. The supply chain for such adsorbents is still in development, indicating that supply chains will need to expand substantially to meet the needs of gigatonne-scale DACCS deployment. One way to get around this is to recycle spent adsorbents, which creates a circular sorbent production process and simultaneously reduces GHG emissions[51].
- Waste heat sources will reduce as economies decarbonise, due to reduced fossil fuel combustion, lack of waste heat in remote locations, and competing uses of waste heat[84].
2.8 Biochar
2.8.1 Technology overview
2.8.1.1 TRL
According to the Royal Society, biochar is within a TRL of 3-6, suggesting the technology is within the ‘proof of concept’ and ‘large [pilot plant] scale’ phase. It is expected that readiness for implementation at large scale is anticipated within a decade. Additional analysis by Vivid economics[59] and BEIS agree, with TRL ranging from 5 to 7. However, according to the CCC, there is uncertainty over biochar’s TRL, as it is not yet demonstrated at scale and there remains some scepticism over its deployment[59].
2.8.1.2 Economics
A breakdown in biochar costs for various plant sizes is provided below in Table 34, which is sourced from research conducted by Shackley et al[137]. OPEX includes the cost of feedstock, transport and storage; the use of natural gas in kick-starting the pyrolysis reaction; labour; plant operational costs; and the application of biochar to the soil. These costs can be used as benchmarks, where the sixth-tenth rule is used to extrapolate CAPEX and OPEX based off biochar production rates.
Further analysis by Ricardo estimated that the gross value added (GVA) of biochar within Scotland could be circa £24.3M, which is significant, and the levelised cost of capture is lower than DACCS and BECCS at 13 – 120 £/tCO2[67]. These costs are in line Vivid economics, who estimated a capture cost £14-130/tCO2[59], whilst Haszeldine et al determined a provisional abatement cost of £144-208/tCO2[35]. In all cases the choice of feedstock, pyrolysis technology, and scale are key.
| Scale tbiochar/year | Feedstock | Revenues (£/tbiochar) | CAPEX (£/tbiochar) | OPEX (£/tbiochar) | ||
|---|---|---|---|---|---|---|
| Sale of electricity | ROC | Avoided Gate fee | ||||
| 2,000-16,000 | Straw | -37 | -74 | 0 | 87 | 260 |
| SRC | -37 | -74 | 0 | 87 | 315 | |
| Arboriculture arisings | -37 | -74 | 0 | 87 | 167 | |
| 16,000-184,800 | Straw | -37 | -74 | 0 | 101 | 308 |
| SRC+FRs | -37 | -74 | 0 | 101 | 334 | |
| Miscanthus | -37 | -74 | 0 | 101 | 377 | |
| Sawmill Residues | -37 | -74 | 0 | 101 | 288 | |
| SFR | -37 | -74 | 0 | 101 | 354 | |
| Canadian FR | -37 | -74 | 0 | 101 | 399 | |
| Waste wood | -37 | -74 | -124 | 101 | 151 | |
| Green waste and sewage sludge | -37 | -74 | -89 | 101 | 151 | |
| C&I veg and animal waste | -37 | -74 | -96 | 101 | 151 | |
| >184,800 | Straw | -37 | -74 | 0 | 45 | 201 |
| SRC+FRs | -37 | -74 | 0 | 45 | 233 | |
| Miscanthus | -37 | -74 | 0 | 45 | 282 | |
| Sawmill Residues | -37 | -74 | 0 | 45 | 173 | |
| SFR | -37 | -74 | 0 | 45 | 254 | |
| Canadian FR | -37 | -74 | 0 | 45 | 296 | |
| Waste wood | -37 | -74 | -124 | 45 | 42 | |
| Green waste and sewage sludge | -37 | -74 | -89 | 45 | 42 | |
| C&I veg and animal waste | -37 | -74 | -96 | 45 | 42 | |
2.8.1.3 Inputs/outputs
Inputs
Feedstocks: The most promising feedstock source for biochar production is waste, as it eliminates the need for additional land, gives value to waste and exhibits the lowest life cycle emissions[138], [55]. These waste feedstocks can be sourced from a variety of suppliers, such as sewage companies and farmers. Energy crops and woody feedstocks can also be utilised; however, these will directly compete with other BECCS technologies and do not exhibit the same benefits as waste.
Land: In terms of land requirements, biochar requires circa 1 ha/tCO2, which is significantly higher than compared to BECCS (0.03-0.07 ha/tCO2), due to the lower efficiencies of biochar technology[67].
Outputs
Apart from providing negative emissions, biochar can also be utilised in the agricultural, horticultural, construction, water treatment and environmental remediation sectors[35]. Most notably, the application of biochar to soil can help improve soil health by absorbing heavy metals (e.g., arsenic and copper), increase water and nutrient retention, and stabilise pH and microbial populations, which in turn improve crop yields and help remove pollutants within the food chain[139]. The use of biochar as a form of activated carbon within waste treatment processes[139], act as a substitute for charcoal and coal for the provision of low-carbon heat[139]. The by-products of condensable gases and vapours (i.e. syngas and bio-oil) produced during pyrolysis can also be combusted to provide heat and electricity or be utilised within heavy industry[53], [56].
Biochar is a NETs energy producer, producing circa 1.39 to 3.89 MWh/tCO2[138].
2.8.1.4 Schematic
The schematic for biochar production via poplar woodchip is from Peters et al[139].
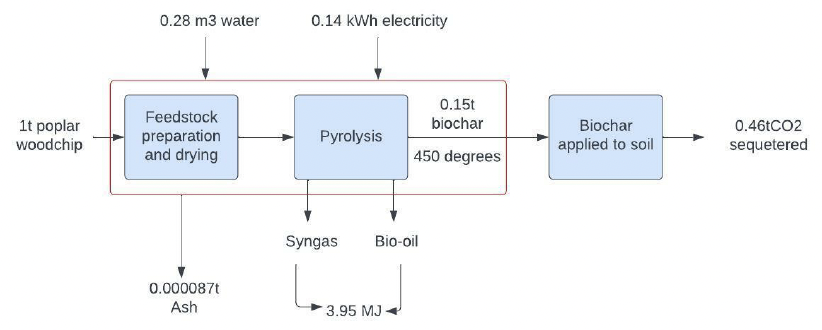
2.8.2 Potential carbon impact
For the pathways modelling, performance data for a reference biochar plant is needed to calculate the CO2 capture potential in Scotland. The carbon sequestration potential was taken to be 3 tCO2/tbiochar, based on the mass balance from the above schematic. The utilisation factor of the plant is taken to be 85%[121], assuming that the pyrolysis plant operates to a similar degree to a gasification plant, and the biogenic content of the captured CO2 is assumed to be 100% if woody biomass feedstocks are utilised and 50.3% if MSW is used (see Section 2.3.2 for more information).
A literature review by Jeswani et al[74] identified biochar as exhibiting the lowest GWP potential when used as a soil amendment, whilst Matusik et al[55] highlighted that biochar production reduces GHG emissions in all cases; with life cycle emissions ranging from -2561 kg CO2/t,biochar to 3.85 kgCO2/kg,rice. In instances where carbon emissions are positive, these emissions are still lower than compared to business as usual. This is reflected by the fact that biochar offsets agricultural emissions onsite, with 80-90% of this carbon remaining in a stable condition for hundreds of years[55].
Typically waste derived biochar exhibits the lowest lifecycle emissions, due to waste production and management emissions being discounted[138]; however, this is counteracted by waste derived biochar exhibiting the lowest carbon removal potential. In this case woody biomass and perennial grasses provide the optimal carbon removal potential.
Despite the benefits, biochar production does lead to an increase in non-GWP emissions (known as burden shifting). In particular, acidification, eutrophication and ecotoxicity all increase, due to higher demands for fertiliser and grid electricity[55]. The co-benefits of biochar for soil health are also uncertain, with potential irreversible impacts regarding heavy metals and organic contamination[22], [59].
2.8.3 Potential locations in Scotland
In the UK, 66% of land use is agricultural, which acts as a NETs CO2 source due to farming intensive practices that have disturbed the soil (emitting c. 16MtCO2/year in 2009). Soil pH levels have also increased because of this[140]. For Scotland, around 30% (2.3 Mha) of land use is agricultural, which emitted 7.7 Mt CO2/year in 2007, whilst 17% is forest (1.3 Mha). These forests are capable of sequestering 10MtCO2/year and have potential to sequester 11 MtCO2/year by 2050[140].
The biochar plant should be located close to supplies of suitable biomass and transport infrastructure (for virgin feedstocks). The most important factors for biochar location are proximity to woodlands, grasslands and on lower sloping land to reduce risk of erosion. Areas in the south, south-eastern and eastern regions of Scotland are most suitable for installing a biochar facility (e.g., Glasgow, Central Scotland, Lothian region and Fife). This is due to close proximity to roads, and hence are more likely to minimise transport costs between sources of feedstocks and sinks for biochar[140].
Analysis by Haszeldine et al[25] highlights potentials for emission abatement within Scotland of 0.6-3.9 Mt C/year when using domestic feedstocks at a land requirement of 5,200 km2.
2.8.4 Limitations/barriers
The application rate of biochar must be limited to 30-60 t/ha, to ensure soil surface reflectivity does not decrease significantly and damage crops. This limits the deployment of biochar. BECCS does not exhibit this constraint, and is also more energy efficient[138], has a higher negative emission potential, and is a more mature technology[67]. On this basis, it could be argued that BECCS be prioritised when allocating biomass resources and public funding. Furthermore, like other NETs, biochar may be denied public licence if scaled up, as it is viewed as “incineration in disguise”[138].
From a policy perspective, stronger regulation on waste[22] and the issuing of environmental permits[59] will be necessary if biochar capacity grows significantly within the next few decades. Furthermore, in order to verify that biochar has been applied to the soil, an appropriate MRV procedure will need to be outlined which accounts for uncertain storage permeances[59] and the varying decomposition rates of biochar depending on the choice of feedstock and temperature[138]. These will in turn require improvements in modelling biochar spread, which is complex[59].
2.9 Biofuel production with CCS
2.9.1 Technology overview
2.9.1.1 TRL
Biofuel production encompasses a large range of technologies. First generation biofuels, such as bioethanol from sugar or starch crops are commercially established, with an estimated UK capacity of 927 Mlt per year, producing 326 Mlt is 2020[141]. Production of biodiesel from crop-derived feedstocks (Rapeseed oil) has declined entirely within the UK in favour of waste feedstocks such as used cooking oil (UCO) and tallow, of which 421 Mlt was produced in the UK from an estimated capacity of 557 Mlt per year[141]. Of these established technologies, no bioethanol production takes place in Scotland, whilst biodiesel fatty acid methyl ethers (FAME) production consists of a 70 Mlt capacity plant in Motherwell. Although not present in the UK, there is a significant capacity of biodiesel HVO (Hydrotreated Vegetable Oil), classed as a 2nd generation biofuel, production facilities in the EU, with a total capacity of 5,280 Mlt per year[142]. Similarly, to FAME production in the UK, these are derived from feedstocks such as: UCO, animal fats and palm oil.
Second generation bioethanol, from feedstocks other than food crops, is less established than diesels. The USDA estimate that 50 Mlt of cellulosic ethanol, from a capacity of 200 Mlt per year, was produced in the EU in 2021[142]. Feedstocks include wheat and rice straw, saw dust and forest residues. These advanced bioethanol production processes include a fermentation stage, in common with 1st generation crop-based bioethanol[143], [144].
Drop-in biofuels may also be produced from forest residues and kraft pulp process by-products (including black liquor, black liquor lignin and crude tall oil) by hydrotreatment or gasification pathways. These may produce both drop-in gasoline and drop-in diesels. Capacity of these plants amounts to 341 Mlt per year, of which the vast majority (all production excluding 6 Mlt per year) is tall oil to drop-in diesel production, attached to pulp production facilities in Finland and Sweden[142].
2.9.1.2 Economics
Table 35 presents associated costs and GHG footprints for a selection of biomass to biofuel pathways, provided by Jafri et al[146]. The levelised cost of production (LCOP) with and without CCS fitted is given, showing the additional cost of capturing carbon on the final product. It should be noted that all CO2 streams are assumed to be captured. Therefore, fermentation processes (for example) are fitted with capture equipment for both concentrated and dilute streams, costs with only fermentation capture were not modelled. Capture costs are also inclusive of transport and storage. GHG footprints were calculated on a well-to-wheels basis, the table provides GHG emissions for CCS fitted plants, negative numbers represent a NETs removal of CO2. The cost of carbon presented in the final column is the additional LCOP for CCS equipped plant compared to without, per tonne of carbon captured.
| Main process | Pathway | LCOP £’[21]/MWh | LCOP with CCS £’[21]/MWh | GHG footprint kg CO2 /MWh | Cost of carbon £’[21]/t CO2 |
|---|---|---|---|---|---|
| Fermentation | Wheat grain to bioethanol | 60 | 91 | -88 | 349 |
| Sawdust to bioethanol | 128 | 162 | -200 | 173 | |
| Hydrotreatment | Tall oil to drop-in fuels | 55 | 58 | 6 | N/A |
| Tallow to drop-in fuels | 107 | 108 | 43 | N/A | |
| Forest residues to drop-in fuels | 113 | 179 | -351 | 189 | |
| Gasification | Bark to drop-in fuels | 115 | 130 | -420 | 35 |
Drop-in fuels from tall oil and tallow are two advanced biofuel processes currently at commercial scale. Adding carbon capture to these plants results in very little increase in production costs. However, even with carbon capture, the GHG footprint of these pathways remain positive. This is not because the upstream emissions of these pathways are particularly high, the GHG footprint without CCS for the six pathways in Table 35 range from 17 to 63 kgCO2/MWh, with tall oil and tallow at 28 and 51 kgCO2/MWh respectively. However, a larger amount of the carbon embodied in the feedstock is either converted into fuel or a valued by-product and is not considered capturable. For these two processes, around 84-89% of the process carbon input is realised in biofuel or tradeable by-products. In comparison, the gasification pathways result in only 29-36% of the carbon input is output as biofuel or by-product. The two hydrotreatment pathways, therefore, have reduced opportunity to capture CO2 by being more “carbon efficient”.
Wheat grain to ethanol and forest residues to drop-in fuels have similar uplifts in LCOP from fitting and operating CCS, by around 50-60%. However, a combination of high upstream emissions and relatively high conversion of feedstock carbon to fuel or tradeable by-products (63%) result in wheat grain to bioethanol having the highest cost of carbon. However, of the options providing negative emissions wheat grain to bioethanol has the lowest fuel production cost with or without CCS, making it the most commercially viable NETs option in the absence of negative emissions payments. Conversely, bark to drop-in gasoline has the lowest carbon capture cost due to a small uplift in production cost, relatively low upstream emissions and low conversion of feedstock carbon to fuel. However, production costs are higher than wheat grain to bioethanol making the process less commercially viable on revenue from fuel alone.
2.9.1.3 Inputs / outputs
First generation bioethanol production relies on a fermentation process. This produces a highly concentrated stream of CO2 that is easily captured. As discussed in 2.9.1, the primary inputs to 1st generation bioethanol production are food-based crops. In the UK these are predominantly wheat grain and sugar beet, however, corn, barley, rye and triticale are also commonly used in other countries[141], [142].
Taking sugar beet to ethanol as an archetypical biofuel plant for Scotland, per 1 kg of sugar beet input, 0.104 kg of carbon dioxide may be captured from the fermentation process[145]. Process heat is required throughout the plant, whether this can contribute to negative emissions or not is dependent on how the heat provision is fuelled. There is potential to provide this by anaerobic digestion of distillation waste (vinasse) to produce biogas. Capturing post-combustion CO2 could provide 0.05kg CO2 of negative emissions, and upgrading any residual biogas for biomethane injection a further 0.015kg CO2. An alternative feedstock common in Europe is wheat grain. In this case, per 1 kg of carbon input, 0.224 kg of capturable carbon could be expected from the fermentation process (approximately 0.41 kg CO2 per kg of wheat grain input)[146]. Heat input is required at the distilling stage, whether this can contribute to negative emissions or not is dependent on how the heat provision is fuelled. In an example where biomass CHP is used, an additional 0.38 kgCO2 could be captured via post-combustion capture technology.
As with 1st generation bioethanol production, many of the established production pathways for cellulosic ethanol involve a fermentation processes, resulting in easily captured concentrated CO2. An example sawdust to ethanol plant produces 0.28kg of concentrated CO2 during the fermentation stage, for each kg of sawdust input. An additional concentrated CO2 stream may be produced by anaerobic digestion of the liquid phase resulting from steam pre-treatment of the sawdust. Upgrading the resulting biogas could contribute a further 0.034 kgCO2 per kg of sawdust input. Additionally, combustion is required to generate the required heat for the process. Providing this, using lignin pellets resulting from the process, could contribute a further 0.27kgCO2 captured via post-combustion capture technology[146].
Drop-in diesel and gasoline by hydrolysis pathways do not generally result in any intrinsic production of capturable biogenic CO2. However, they require heat input to the process, and this may be provided by biomass combustion, either directly via an additional biofuel input or by combustion of off-gases from the process. Alternatively, the required heat could be provided by fossil fuel, in which case there would be no negative emissions potential. In all cases, a dilute CO2 stream is produced which must be captured using post-combustion capture technology. Per kg of feedstock, potential negative emissions ranges from 0.017kgCO2 per kg (for meat industry by-products to diesel using hydrodeoxygenation) to 0.47kgCO2 (for forest residues to gasoline via fast pyrolysis). One of the most common hydrolysis pathways, raw tall oil to drop-in diesel, results in a potential 0.44kgCO2 per kg of tall oil input. Although this assumes capture of combusted biofuels required for process heat.
Gasification pathways result in intrinsic emissions of concentrated CO2 during the syngas conditioning phase (acid gas removal). The negative emissions potential (per kg of feedstock input) from syngas conditioning ranges from 0.312kgCO2 via fluidized-bed gasification of bark, up to 0.528kgCO2 from entrained-flow gasification of black liquor (a pulp production by-product). Black liquor to drop-in gasoline does not have the potential for a large amount of additional CO2 capture. However, combustion of syngas, char, RME and tars during the bark to drop-in gasoline process results in a large potential for additional CO2 capture (0.59kgCO2 per kg of bark). Both concentrated and dilutes CO2 streams give bark to drop-in gasoline the highest potential negative emissions (per kg of feedstock input) of any biofuel option.
2.9.1.4 Schematics
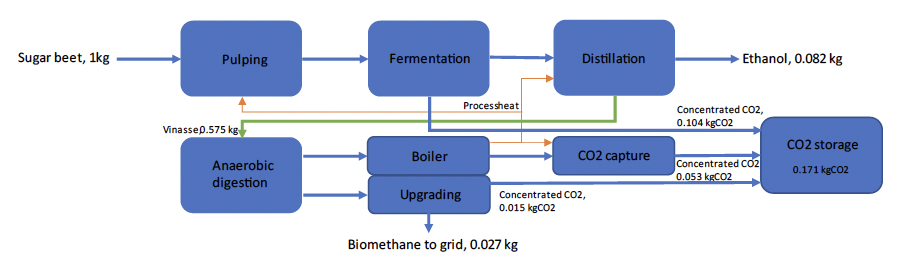
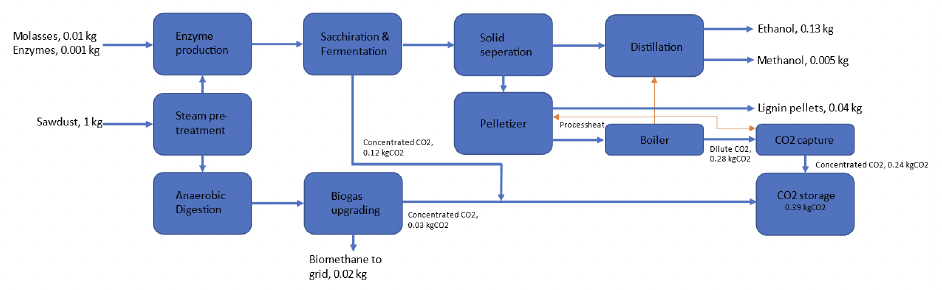
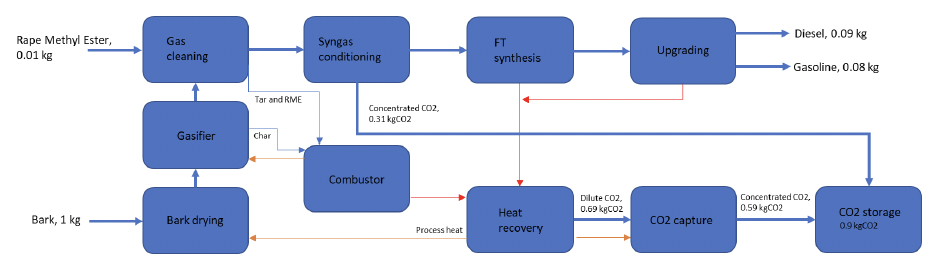
2.9.2 Potential carbon impact
NNFCC studied the potential of a sugar beet to bioethanol industry in Scotland[145]. Three scenarios were explored, including an E4 (petrol mandated to contain 4% bioethanol), E10 and “most likely” scenario, producing 57, 145.2 and 171.8 million litres of bioethanol per year, respectively. Sugar beet input required ranges from 551 k tonnes to 1.6 M tonnes, equating to 1.1% to 3.2% of Scotland’s arable land (in comparison to 2.3% of arable land currently used to cultivate sugar beet in England). The negative emissions potential for each of these scenarios are 59, 150 and 177.4 kt of concentrated CO2 from fermentation alone. Adding co-production, onsite combustion and upgrading of biogas, a total potential of 97, 247.5 and 292.8 ktCO2 could be captured.
Similar processes to the sawdust to bioethanol plant (as illustrated in Figure 17) can be used for a number of feedstocks, including whisky industry by-products (DDGS, pot-ale and draff)[147] and agricultural by-products such as straw. Section 1.5 discussed the availability of these resources in Scotland. There is estimated to be an excess of sawmill residues of 0.53 Mt by 2030 but falling to 0.36 Mt by 2045. Of this, approximately 28% (0.15 Mt and 0.1 Mt) is sawdust. There is a surplus of whisky by-products of 1.75 Mt currently, which is expected to increase to 2.01 Mt and 2.42 Mt in 2030 and 2045 respectively. Of straw, there is a current excess supply of 0.29 Mt which is not expected to change out to 2045.
| Sawdust | Draff | Pot-Ale | DDGS | Straw | |
|---|---|---|---|---|---|
| Available feedstock | 148.7 | 51.7 | 1,610.9 | 19.2 | 293.7 |
| Fermentation CO2 | 17.5 | 3.7 | 94.6 | 5.3 | 58.7 |
| Other CO2 | 40.0 | 8.3 | 215.8 | 12.0 | 134.0 |
2.9.3 Potential locations in Scotland
Typical locations include abattoirs (tallow), sawmills (forest residues), ports (UCO), pulp mill (UPM Caledonian) and sugar beet, ideally sourced within 60 miles. Excess transport distances increase the cost of feedstock beyond economic viability.
2.9.4 Technology specific limitations & barriers
Fermentation produces a concentrated stream of CO2. Little equipment is required to capture the CO2 from fermentation. Production of bioethanol via sugar and starch crops is widespread throughout Europe and presents the technologically easiest route to capturing biogenic carbon. According to ePure, renewable ethanol producers in Europe captured 0.87Mt of CO2 in 2020[148] However, no bioethanol plants currently exist in Scotland. The NNFCC studied the potential of creating a sugar beet to bioethanol industry in Scotland, although there are a number of barriers to introducing this industry to Scotland.
Firstly, although generally viewed as a low carbon alternative to fossil fuels, production of biofuels from food crops raises concerns of food production being displaced to land not previously cultivated, therefore causing emissions through indirect land use change (ILUC). In response, current policy generally favours development of second-generation biofuels derived from wastes and residues. RED II placed restrictions on the increasing use of first generation (1G) biofuels within member countries, and both RED II and RTFO allow double counting of advanced biofuels to encourage development. Secondly, bioethanol is most applicable to light duty vehicles (passenger cars and light commercial vehicles), a sector of road transport seeing increasing penetration of electric vehicles. Accordingly, studies into future fuel demand often include scenarios which see a reduction in demand liquid fuels as a whole, and 1G biofuels in particular[149].
Although demand for liquid transport fuel may decline overall, there remains opportunities for advanced biofuel production to grow by displacing fossil fuels and 1G biofuels. As discussed in section 2.9.1, options for production of advanced biofuels are already deployed commercially in Europe, but at much smaller scale than more conventional biofuel production routes. Establishing biofuel production as a significant source of negative emissions within Scotland will be dependent on first establishing large-scale production in the country. Processes for advanced biofuels including a fermentation step, such as ABE fermentation, will present the technologically easiest route for negative emissions. Hydrotreatment pathways do not generally produce a concentrated CO2, negative emissions from this technology will be dependent on deployment of post-combustion capture technology described in section 1.2.1. Gasification processes to liquid biofuels are at lower TRL than other processes but present an opportunity to capture a concentrated stream of CO2 from syngas separation process (acid gas removal).
Contact
Email: NETs@gov.scot
There is a problem
Thanks for your feedback