National Demand Optimisation Group (NDOG): demand optimisation in laboratory medicine - phase IV report
The National Demand Optimisation Group (NDOG) is a Scottish Government commissioned group. Its main objective is to reduce unwarranted variation in laboratory diagnostic testing, contributing to improved patient outcomes The group has recently completed its fourth phase of work.
5 Phase IV Output
A primary focus of Phase IV was the establishment of a defined data set to feed into a monitoring tool, tracking diagnostic activity across Scotland during the pandemic and into recovery. This data acts as a direct surrogate metric for associated clinical activity, to be used to identify healthcare gaps, monitor recovery, and enable evidence-informed prioritisation of decisions regarding the resumption of tests and pathways across NHS Boards.
The Phase IV data collection focused on histopathology and blood sciences data sets and required a complete revision of the pre-established Atlas of Variation data set. Monthly data from January 2019 onwards was requested. The monthly 2019 data allowed for a baseline 'non-pandemic' year to be established for individual Boards. The 2020 and 2021 monthly data was mapped against the 2019 monthly averages to help identify possible gaps in healthcare provision during the pandemic and into recovery.
The Phase III Atlas of Variation data collection and associated activity was largely paused throughout Phase IV of the programme due to the refocused objectives, although some NHS Boards continued to provide this data through automatic data collection processes previously set up.
5.1 Histopathology Data Set
The pathology data set was finalised in early October in discussion with the SPAN Steering Group, Core Team and NDOG representatives. The histopathology data request was disseminated to agreed contacts at all 10 Scotland pathology laboratories on 12 October 2020. The agreed histopathology data fields requested are listed in Annex F.
It should be noted that immunohistochemistry (IHC) slide data was not included as part of the initial data collection, but was retrospectively requested from Boards in March 2021. IHC is considered to be a reliable surrogate marker for cancer diagnoses, given it is usually only requested to assist in staging/typing of cancers.
There has been continual engagement with the pathology community and data has been submitted by all 10 pathology laboratories. One of the laboratories has submitted partial data due to IT limitations.
5.2 Blood Science Data Set
The NDOG core team led a blood science data workshop in September 2020 to define the Phase IV blood science data set, attended by NDOG Steering Group members, IT laboratory staff and blood science discipline representatives. The finalised and agreed data request template (see Annex G) was disseminated to agreed contacts in all NHS Boards on 4 December 2020.
As with the pathology community, there has been extremely positive engagement and collaboration with colleagues regarding the blood sciences data collection. As of 31 May 2021, varying complexity levels of data have been submitted by 12 NHS Boards.
5.3 Data Governance and Data Publication
A Data Protection Impact Assessment (DPIA) screening was completed and there was no information governance risk above that already noted as part of Phase III of the programme. The same data collection principles utilised in earlier phases of the programme have continued throughout Phase IV. To date, two Boards have been able to set up automatic monthly data pulls from their Laboratory Information Management (LIMS) system.
The NDOG Core Team presented the Phase IV data publication proposal to Scottish Government Policy Lead Colleagues in March 2021 and it was approved. All dashboards were published on Tableau Public on 30 March 2021 and have been widely promoted and utilised throughout the clinical community in Scotland.
The NDOG has also liaised extensively with the diagnostic community, mainly through the National Managed Diagnostic Networks (NMDNs) and other networks, around the development of the dashboards, to ensure clear, appropriate and informative data presentation.
5.4 Recovery Monitoring Dashboard Views
A short paper outlining initial findings from the dashboard data was published as an addendum in the Phase III Report and is attached as Annex H.
Figures 1-6 in this report are screenshot examples of the published dashboard views and Figure 4 outlines the number of views of each of the dashboards since publication (NHS Board names have been redacted in this report, but are published on all dashboards).
Histopathology
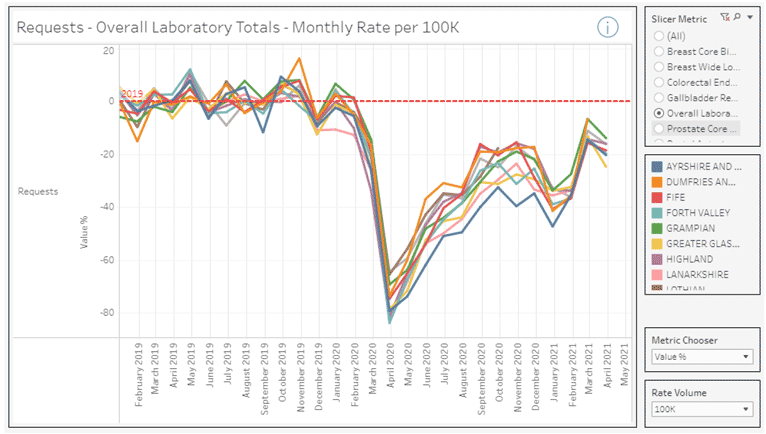
Figure 1 shows % change in monthly overall laboratory pathology requests per NHS Board from January 2019 – April 2021. Consistent across all Boards is the significant reduction in laboratory request numbers in April 2020 (~60-80% reduction from the 2019 monthly average) at the start of the first wave of the COVID-19 pandemic. The dashboard view shows varying levels of recovery across the Boards throughout 2020 into 2021, with a second smaller reduction in pathology requests during the second wave of the pandemic in winter 2020/21. Overall, request levels remain well below pre-pandemic levels.
The data shown in Table 1 supports these trends: Table 1 shows the total pathology specimens for the data received from NHS Boards in Scotland. It is clear that for all the pathology specimens, there has been a significant decline in levels during the COVID-19 pandemic, with a total reduction of 183,721 specimens compared to pre-pandemic levels.
| Specimens | Pre-COVID | COVID | Difference | % Change | |
|---|---|---|---|---|---|
| Breast Core Biopsy | 13,336 | 10,866 | -2,470 | -18.52% | |
| Breast Wide Local Excision | 9,667 | 6,499 | -3,168 | -32.77% | |
| Colorectal Endoscopy Biopsy | 98,048 | 53,132 | -44,916 | -45.81% | |
| Gallbladder Resection | 7,309 | 4,266 | -3,043 | -41.63% | |
| Prostate Core Biopsy | 21,946 | 15,709 | -6,237 | -28.42% | |
| Rectal Anterior Resection | 1,639 | 1,017 | -622 | -37.79% | |
| Grand Total | 151,945 | 91,489 | -60,456 | -39.79% | |
| Neuro | Workload | 1,455 | 1,195 | -260.0 | -17.87% |
| Overall Laboratory Totals | Specimens | 490,586 | 306,865 | -183,721 | -37.45% |
*SPAN Notes
Pre-COVID April 19 to Mar 20 inclusive and COVID April 20 to Mar 21 inclusive
Lothian Denominator – April 19 to Oct 19 and Apr 20 to Oct 20
Lanarkshire denominator – 11 months May 19 to Mar 20 and May 20 to Mar 21
Cancer data
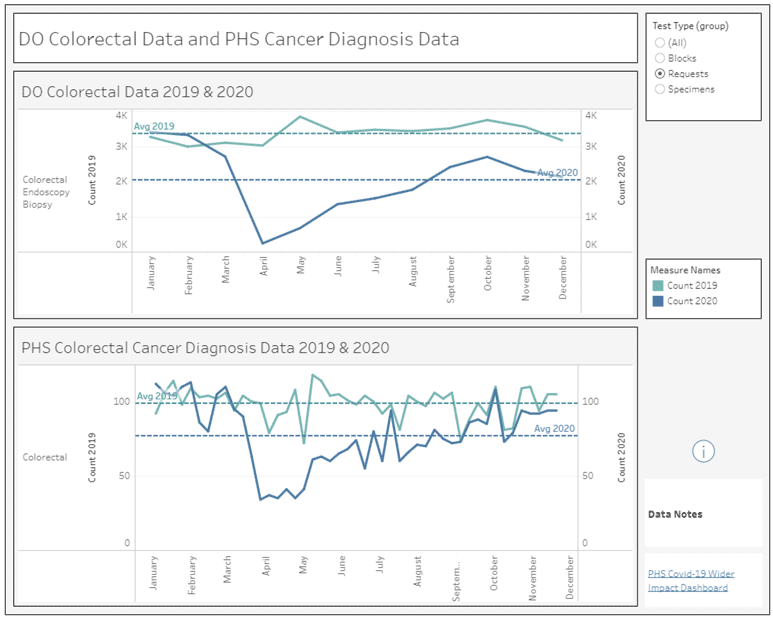
Public Health Scotland (PHS) has published weekly data on the number of individuals from whom a pathology sample detected cancer.[6] Overall, the commonest cancers in Scotland are of the lung, breast (females), prostate (males) and colorectal. By the week ending 27th December 2020, compared to the same week in 2019, there were 761 fewer lung cancers (a total fall of 21.2%); 1591 fewer breast cancers (a total fall of 19.1%); 831 fewer prostate cancers (a total fall of 18.7%); and 1,111 fewer colorectal cancers (a total fall of 21.1%). This Scotland total cancer data can be mapped against corresponding Pathology Demand Optimisation monthly (Scotland total) data for colorectal endoscopy biopsy, prostate core biopsy and breast core request numbers. Figure 2 shows this comparison for Colorectal biopsy/colorectal cancer diagnosis). The light blue lines in the graph are 2019 figures and darker blue lines are 2020 figures. Mapping of these two data sources allows for comparative assessment of changes in colorectal biopsy with colorectal cancer diagnosis. In summary, there was a 45.8% overall reduction in colorectal biopsy but levels of colorectal cancer diagnosis only fell by 21.2%. While this nevertheless presents as very concerning reductions in cancer diagnosis, the magnitude would appear to be less than the impact on colorectal biopsy levels. This suggests that while cancer referral pathways were not as affected as endoscopy services, there were still significant reductions in colorectal cancer diagnoses observed.
Blood Sciences
Figures 3 and 4 show monthly blood science workload by discipline data for an example Board. Figure 4 displays the raw monthly values against the 2019 monthly average and Figure 5 shows % change from the 2019 monthly average. As with the pathology data, these dashboard views clearly demonstrate a substantial and sudden decrease in monthly workload beginning in April 2020, with gradual, albeit partial, recovery throughout the rest of the year. These two figures also demonstrate the usability of the dashboards, as users are able to easily toggle between 'Metric Choosers' of raw request values, value % and also requests rate (weighted for Board population).
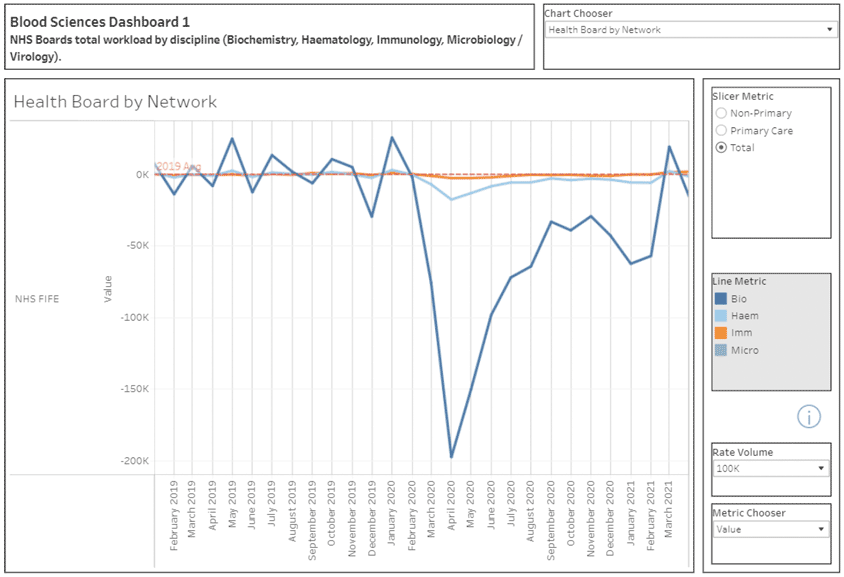
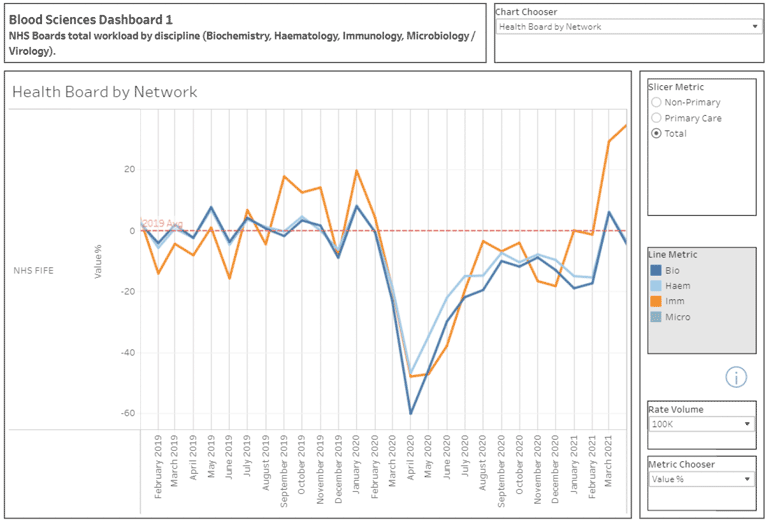
Table 2 below highlights the significant decline in discipline testing levels during the COVID-19 pandemic in comparison to the equivalent months the year before, with over 18 million fewer biochemistry tests being performed across Scotland and between 21%-31% decrease in testing levels across all disciplines.
| Pre-COVID |
COVID |
Difference |
% Change |
|
|---|---|---|---|---|
| Bio |
66,955,626 |
48,921,513 |
-18,034,113 |
-22.68% |
| Haem |
34,412,630 |
22,050,512 |
-12,362,118 |
-31.88% |
| Imm |
427,911 |
275,346 |
-152,565 |
-30.61% |
| Micro |
7,123,379 |
5,567,371 |
-1,556,008 |
-21.84% |
Blood Science Notes
Greater Glasgow and Clyde only Micro data
Ayrshire and Arran denominator April 19 to November 19
Forth Valley denominator April 19 to December 19
Highland denominator April 19 to January 20
Orkney denominator April 19 to January 20
Lanarkshire denominator May 19 to March 20
Table 3 below provides an overview of total NHS Scotland test data received for the 25 tests as outlined in Level 2 of Annex G. Reflective of the trends displayed on the dashboards, it is clear that there has been a substantial decline across the majority of the suite of tests during the pandemic year, with some tests seeing up to an 80% drop in testing in comparison to the previous year – 8 million fewer tests overall. This highlights both the ability to track individual test use but also demonstrates the variable impact on specific tests, with a few tests even showing over recovery and increased use during the pandemic.
| Pre-COVID | COVID | Difference | % Change | |
|---|---|---|---|---|
| B12 | 440,075 | 330,197 | -109,878 | -24.97% |
| Blood Film | 169,155 | 132,831 | -36,324 | -21.47% |
| BNP/ ntpro-BNP | 15,133 | 16,515 | 1,382 | 9.13% |
| Bone Marrow | 2,128 | 1,765 | -363 | -17.06% |
| CA125 | 36,966 | 33,888 | -3,078 | -8.33% |
| Calprotectin | 78,817 | 53,493 | -25,324 | -32.13% |
| CEA | 32,376 | 28,522 | -3,854 | -11.90% |
| Chlamydia/ Gonorrhoea | 296,986 | 135,916 | -161,070 | -54.23 |
| Cholesterol | 1,118,224 | 601,057 | -517,167 | -46.25% |
| Coeliac (tTG Antibody) | 58,224 | 40,779 | -17,445 | -29.96% |
| D-Dimer | 44,879 | 49,639 | 4,760 | 10.61% |
| Drugs of Abuse | 81,026 | 16,178 | -64,848 | -80.03% |
| Ferritin | 541,905 | 415,804 | -126,101 | -23.27% |
| Full Blood Count | 17,112,516 | 11,695,980 | -5,416,536 | -31.65% |
| HbA1C | 702,563 | 512,200 | -190,363 | -27.10% |
| Immunophenotyping | 4,740 | 4,619 | -121 | -2.55% |
| INR (not including POCT) | 261,149 | 182,600 | -78,549 | -30.08% |
| Intrinsic Factor | 8,738 | 8,099 | -639 | -7.31% |
| PSA | 211,841 | 179,689 | -32,152 | -15.18% |
| QFIT | 62,416 | 92,648 | 30,232 | 48.44% |
| Serum Electrophoresis | 48,350 | 39,099 | -9,251 | -19.13% |
| SFLCs | 12,421 | 12,566 | 145 | 1.17% |
| Sodium | 4,867,718 | 3,717,448 | -1,150,270 | -23.63% |
| Urine Culture | 468,825 | 359,777 | -109,048 | -23.26% |
Blood Science Notes
Greater Glasgow and Clyde only Micro data
Ayrshire and Arran denominator April 19 to November 19
Forth Valley denominator April 19 to December 19
Highland denominator April 19 to January 20
Orkney denominator April 19 to January 20
Lanarkshire denominator May 19 to March 20
Figure 5 is a dashboard example of NHS Board level monthly data for the diabetes blood test, HbA1c. In April 2020, all Boards saw a notable decrease in HbA1c testing, dropping between ~80-85% at the height of the first wave of the pandemic. Since then there has been variable recovery in testing activity, with some boards showing both recovery and overshoot from previous activity, while for other boards the recovery remains challenging. This marked reduction in overall testing is likely to have impacted both the diagnosis rate of new diabetics and the optimal monitoring of existing diabetes patients. Clearly, Health Boards and Diabetes services could use the dashboard to monitor such trends for their own local services.
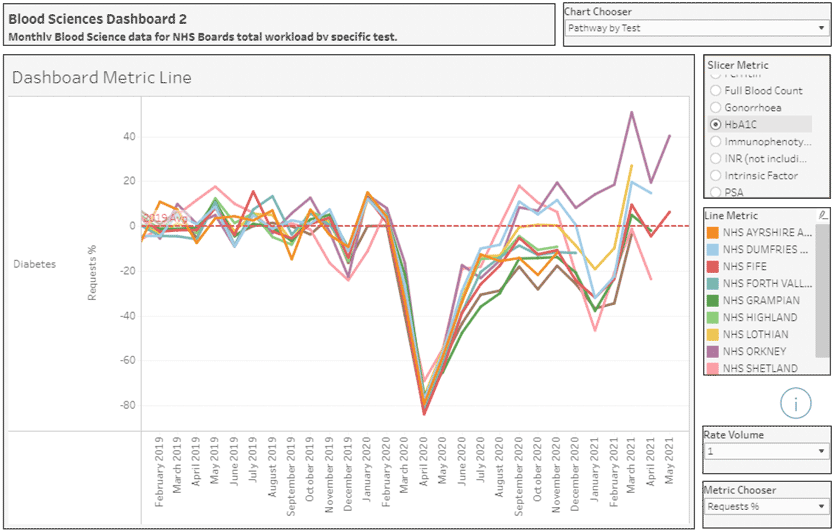
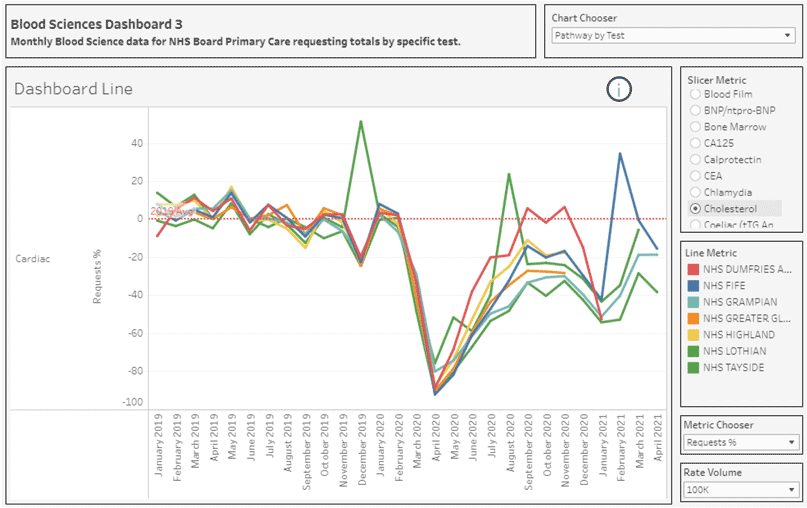
Figure 6 shows the dashboard view for total cholesterol Primary Care request figures by NHS Board (raw monthly values against 2019 monthly average). A familiar trend in test requesting is evident here, with a sharp decline in cholesterol requesting numbers in April 2020 and gradual increase across the second half of 2020 and into 2021. Overall test number remain lower than previous pre-pandemic levels and recovery of previous testing rates is variable.
The interactive recovery monitoring dashboards and tabulated data clearly demonstrate substantial reductions in diagnostic testing across NHS Boards throughout the COVID-19 pandemic. The dashboards have been developed in such a way as to allow Boards to identify, prioritise and address possible related gaps in healthcare provision as NHS Scotland moves further into recovery.
The dashboard has already been widely utilised, and the view counts as of 31 May 2021 can be seen below in Table 4. Through further targeted promotion of the dashboards and engagement with specific NHS and Scottish Government groups, the NDOG anticipate these dashboard viewing figures will continue to increase.
| Pathology Dashboard | Blood Science Level 1 Dashboard | Blood Science Level 2 Dashboard | Blood Science Level 3 Dashboard | |
|---|---|---|---|---|
| Number of views as of 31st May 2021 | 169 | 220 | 166 | 170 |
The NDOG have identified work in the following areas where the recovery monitoring dashboards should be utilised within NHS Scotland, including:
- Phlebotomy capacity: monitoring and directing resource.
- Cancer: identifying gaps in the screening, diagnosis and monitoring of specific malignancies.
- Chronic disease pathways: focusing on specific disease pathways to identify healthcare gaps.
- Targeted prioritisation: identifying healthcare gaps to be assessed and prioritised as Scotland recovers from the COVID-19 pandemic.
- Targeting and reducing unwarranted variation: ensuring appropriate laboratory test use is tracked. This is especially important during post-pandemic recovery.
- Laboratory resource allocation – varying demand and pressure on laboratory services will occur as healthcare recovery brings heavier use of lab tests. This will be mostly felt across pathology where a predictable overshoot above normal pre-pandemic workloads will require urgent additional resource.
5.5 Links – Scottish Government and Recovery
Where the data presented in the recovery monitoring dashboards indicate that there is variation in remobilisation across NHS Boards, the NDOG have ensured that relevant networks and Scottish Government policy teams including diabetes, heart disease and cancer are involved, to allow the NDOG to contribute effectively to work progressing on improving patient outcomes across Scotland.
5.6 Quality Improvement projects and educational Guidance
The Atlas of Variation and recovery monitoring dashboards provide powerful Quality Improvement (QI) tools with 'at a glance' information on variation of diagnostic test use at a variety of levels. In order to make a difference and generate positive outcomes, the Atlas of Variation and recovery monitoring dashboards should be utilised in all NHS Boards and QI teams.
In previous phases of the programme, the NDOG and wider stakeholders in NHS Boards have undertaken some QI projects with teams at a local level. There has also been some appetite from Primary Care colleagues to lead QI projects within their practice or cluster groups. During Phase IV, progressing QI work was obviously challenging due to COVID-19 pandemic. However, NDOG are aware that QI work has previously taken place in NHS Fife (targeted QI work with local GPs around optimising Vitamin D primary care test requesting) and NHS Ayrshire and Arran (targeted QI on coagulation and glucose test requesting patterns) and these are initiatives that the programme will revisit and support throughout future phases.
A detailed Frequently Asked Questions (FAQs) document has been published on the NDOG website that clearly outlines the functionality and details the interactive features of the recovery monitoring dashboards (Annex I).[8] A link to this document is published on each dashboard for information and the document is included as part of the NDOG toolkit.
Test feedback templates have been developed for the diagnostic tests included in the recovery monitoring dashboards (see Annex J for an example). The templates include a screenshot of the relevant dashboard test view and a data table with pre-pandemic and pandemic totals by NHS Board to enable the quick identification of gaps in testing and rates of recovery. A link to the dashboard is also included to encourage further interrogation of data and questions are listed at the bottom of the form, the responses to which will help provide deeper clinical context to the dashboard views where appropriate.
Contact
Email: Caroline.Ballantyne@gov.scot