Life at age 14: initial findings from the Growing Up in Scotland study
Growing Up in Scotland is a longitudinal study following the lives of young people. The report is based on data collected in 2019/20, when participants were 14 years, from 2,943 families. The report presents high level findings relating to young people’s experiences across a range of life domains.
8. General health, physical activity and sleep
This final section presents findings on physical activity and health, including young people's experiences with puberty and sleep.
8.1 General health – young person
Young people were asked how they would say their health was in general. As shown in Figure 47, around two thirds (65.1%) said their health was 'excellent' or 'very good', whilst only a small minority said their health was 'poor'.
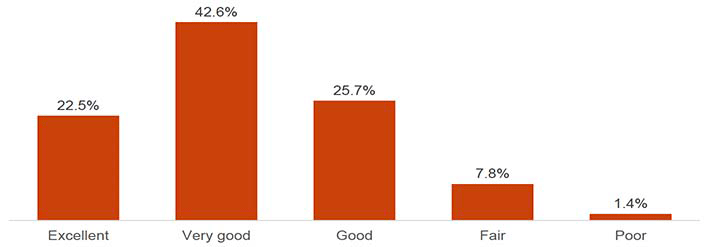
Base: All young people (2642)
Disabled young people were less likely than non-disabled young people to say their health was either 'excellent' (10.5%, compared with 24.5%) or 'very good' (31.8%, compared with 44.4%).
Young people in SIMD quintiles 1 and 2 were less likely than those in quintiles 4 and 5 to say their health was 'excellent' (16.5% and 18.6%, compared with 26.1% and 27.1% respectively).
8.2 General health – parent/main carer
8.2.1 Parental perception of child's health
Parents were asked about their perception of their child's health in general. Just over two thirds reported that their child had 'very good' health, with a further quarter reporting 'good' health. Only a small minority reported that their child's health was 'bad' or 'very bad'.
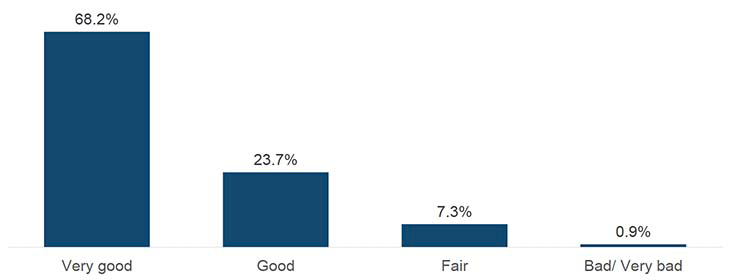
Base: All parents/main carers (2914)
Parents of a disabled young person were much less likely to rate their child's health as 'very good' (29.2%, compared with 75.6% for parents of non-disabled young people).
Parents in SIMD quintiles 1 and 2 were less likely to rate their child's health as 'very good' (59.1% and 62% respectively) compared to parents in quintiles 3 (70.2%) 4 (72.9%) and 5 (75.3%)
8.2.2 Parental perception of own health
Parents were also asked about their own general health, with over half rating their health as 'excellent' (17.1%) or 'very good' (38.2%). A quarter (25.8%) felt their health was 'good', whilst 13.9% rated it as 'fair' and 4.8% as 'poor'.
Parents of a disabled young person were less likely to rate their own health as either 'excellent' (7.2%, compared with 19.0%) or 'very good' (26.2%, compared with 40.4%) than parents of a non-disabled young person.
Parents in SIMD quintiles 1 and 2 were also less likely to say their own health was 'excellent/very good' (42.3% and 45.5% respectively), compared with those in less deprived quintiles (57.3% of quintile 3, 62% of quintile 4 and 66.9% of quintile 5).
8.3 Puberty – young person
Boys were asked whether they had noticed a deepening of their voice – the majority (85.2%) answered 'yes'. Of those, nine out of ten (91.7%) had first noticed a deepening of their voice when they were 12, 13, or 14 years old, as shown in Figure 49.
Boys were asked whether hair had begun to grow on their face; over three quarters (78.4%) said it had done so. Of those, the majority (78.7%) had noticed hair had begun to grow at age 13 or 14.
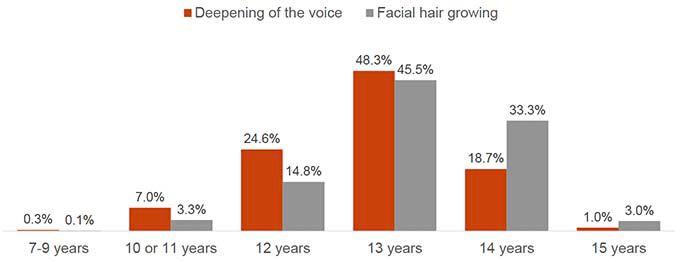
Base: All boys who noticed a deepening of their voice (1118) or facial hair growing on their face (1023)
Disabled boys were less likely to say they had noticed a deepening of their voice (71.6%, compared with 87.7% of non-disabled boys).
Girls were asked whether they had ever menstruated; the vast majority answered 'yes' (92.9%). Of those, the vast majority (90.3%) said they had their first period when they were between 10 and 13 years old.
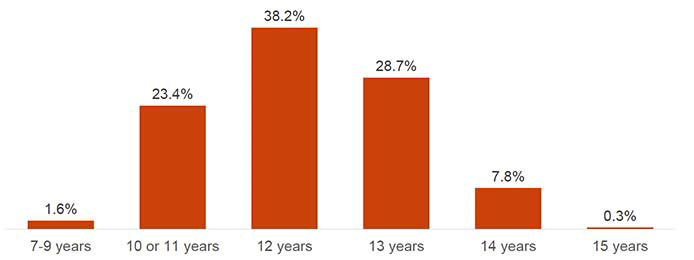
Base: All girls who ever menstruated (1227)
8.4 Perception of weight – young person
Young people were asked whether they thought their body was too thin or too fat. As shown in Figure 51, half said they thought their body was about the right size. More than one third said they thought it was 'a bit too fat' or 'much too fat', whilst a smaller proportion thought their body was 'much too thin' or 'a bit too thin'.
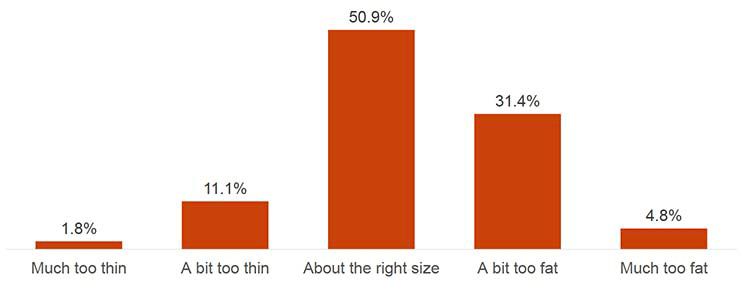
Base: All young people (2639)
As shown in Figure 52, boys were more likely to say they thought they were 'much too thin', 'a bit too thin' or 'about the right size', whilst girls were more likely to think they were 'a bit too fat' or 'much too fat'.
Disabled young people were less likely to say they thought they were 'about the right size' (42.6%, compared with 52.2% of non-disabled young people) and more likely to say they thought they were 'much too thin' (3.2%, compared with 1.6%) and 'much too fat' (8.2%, compared with 4.3%).
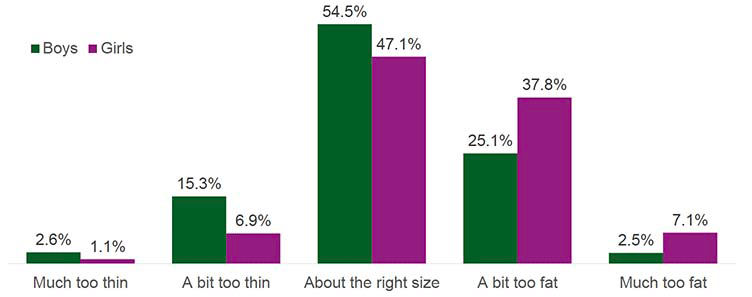
Base: Boys (1302), Girls (1324)
8.5 Body image – young person
Young people were asked how happy they felt about the way they look, as shown in Figure 53. Three quarters (75.6%) said they felt 'very happy' or 'quite happy', whilst the remaining quarter (24.4%) felt 'not very happy' or 'not at all happy'
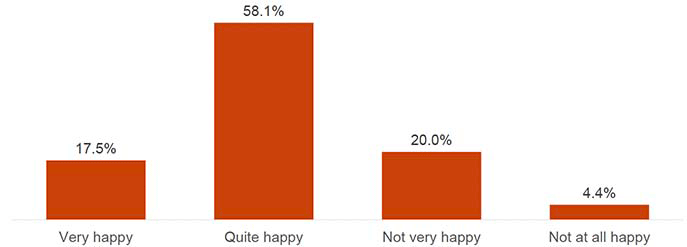
Base: All young people (2639)
Boys were more likely say they were 'very happy' with how they look (25%, compared with 9.9% of girls). Girls were more likely than boys to say they were 'not very happy' (27%, compared with 12.9%) and 'not at all happy' (7%, compared with 1.8%) with how they look.
Disabled young people were more likely to say they were 'not at all happy' (9.8%, compared with 3.5%).
8.6 Physical activity – young person
Young people were asked how many hours a week they were usually physically active[23]. As shown in Figure 54, just under two thirds said they were usually active between one and six hours a week, which is less than the NHS recommended average of at least 60 minutes of activity per day[24]. A small minority said they were not at all physically active. A third either met or exceeded the minimum activity hours recommended by the NHS (7 hours).
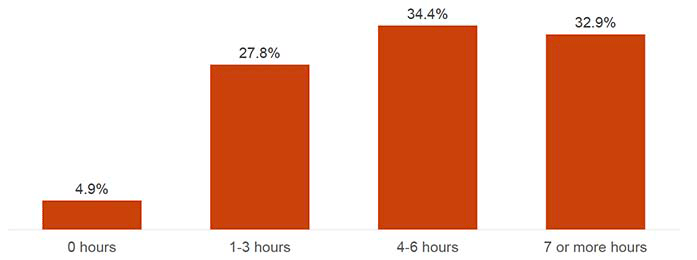
Base: All young people who were happy to answer questions about physical activity (2755)
Boys were more likely to say they were active for 7 or more hours a week (36.2%, compared with 29.6%, of girls), whilst girls were more likely to say they were active for 1-3 hours a week (31.4%, compared with 24.2% of boys).
Disabled young people were less likely to say they were active for 7 or more hours a week (23.2%, compared with 34.6% of non-disabled young people) and more likely to be active for 0 hours (10.9%, compared with 3.8%) or 1-3 hours a week (37%, compared with 26.2%).
8.7 Physical activity – parent/main carer
Parents were asked how many hours a week they were usually physically active (excluding time at work)[25]. Half of parents said they were physically active between one and five hours a week, whilst 15% were not physically active at all.
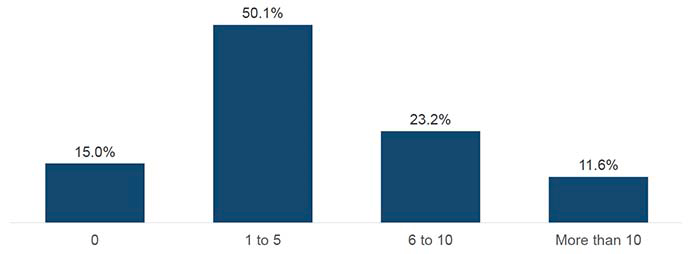
Base: All parents/main carers who were happy to answer questions about physical activity (2896)
Parents of a disabled young person were more likely to say that they were not physically active (zero hours activity) compared with parents of a non-disabled young person (24.2% and 13.3% respectively).
Parents in SIMD quintiles 1 and 2 were more likely to say they were not physically active (zero hours activity) compared to those in quintiles 4 and 5 (21.6% and 19.4% respectively compared with 11.5% and 8.3% respectively).
8.8 Sleep – young person
8.8.1 Sleep on school nights
When asked how many hours of sleep[26] they usually got when they had school the next day, over half (62.1%) of young people said they got between eight and ten hours – which is in line with NHS recommendations[27]. Two out of five (37.2%) said they got less sleep than the recommended eight to ten hours. A very small minority (0.8%) said they usually got more than ten hours.
Girls were more likely to say they got less than 8 hours sleep (40.9%, compared with 33.4% of boys) whilst boys were more likely say they got 8-10 hours (65.8%, compared with 58.3% of girls).
Disabled young people were more likely to say they got less than 8 hours sleep (49.8%, compared with 35% of non-disabled young people) and less likely to say they got 8-10 hours (48.3%, compared with 64.5%).
Those in SIMD quintile 1 more likely to say they got less than 8 hours sleep (45%) compared with those in quintiles 3 (35%), 4 (34.9%) and 5 (32.4%).
8.8.2 Sleep on non-school nights
Young people were also asked how many hours of sleep they usually got when they did not have school the next day[28]. As shown in Figure 56, young people got more sleep when they did not have school the next day. Only one out of four (24.7%) said they got less than eight hours of sleep, whilst 14.5% said they got more than ten hours of sleep.
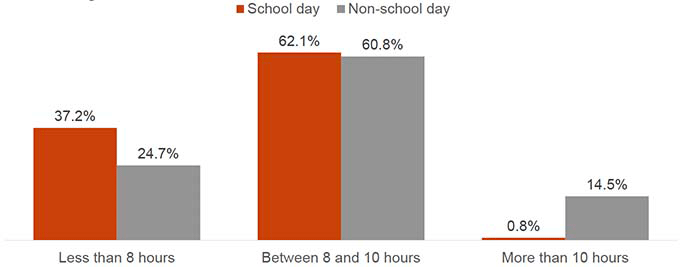
Base: All young people (2769 school day; 2763 non-school day)
Girls were more likely to say they got less than 8 hours sleep (26.8%, compared with 22.7% of boys) on a non-school night. Disabled young people were less likely to say they got between 8 and 10 hours sleep (53.4%, compared with 62% of non-disabled young people) and more likely to say they got less than 8 hours (30.5%, compared with 23.7%).
Young people in SIMD quintile 1 were more likely to say they got less than 8 hours sleep (31.5%) compared with those in quintiles 3 (20.6%) 4 (22.3%) and 5 (20.4%). Those in SIMD quintile 2 (29.2%) were also less likely to say they got less than 8 hours sleep compared with those in quintiles 3 and 5.
8.8.3 Time taken to fall asleep
Young people were asked how long it had usually taken them to fall asleep at night, excluding any time they might had spent in bed doing other things. As detailed below, most young people said they fell asleep within half an hour;
- Between 0 and 15 minutes – 36.0%
- Between 16 and 30 minutes – 35.5%
- Between 31 and 45 minutes – 14.2%
- Between 46 and 60 minutes – 8%
- More than 60 minutes – 6.3%
Boys were more likely to say that it took between 0-15 minutes to fall asleep (39.8%, compared with 32.2% of girls), whereas girls were more likely to say it took them between 46-60 minutes (9.5%, compared with 6.5%).
Disabled young people were less likely to say it took them between 0-15 minutes to fall asleep (27.7%, compared with 37.5% of non-disabled young people) and more likely to say it took more than 60 minutes (16.3%, compared with 4.5%).
Young people in SIMD quintile 1 were more likely to say it took them more than 60 minutes to fall asleep (11.4%) than those in less deprived quintiles (6% of quintile 2, 4.3% of quintile 3, 5.7% of quintile 4 and 4.5% of quintile 5).
Contact
Email: GUS@gov.scot