Life at age 14: initial findings from the Growing Up in Scotland study
Growing Up in Scotland is a longitudinal study following the lives of young people. The report is based on data collected in 2019/20, when participants were 14 years, from 2,943 families. The report presents high level findings relating to young people’s experiences across a range of life domains.
4. Relationship with peers, peer pressure and bullying
This section includes findings from questions about relationships with peers, as well as questions about bullying, peer pressure and sexual relationships and experience.
4.1 Relationships with peers
Young people were asked how they got on with their friends, through a list of statements shown in Figure 19. The vast majority reported their friends 'always' or 'often' paid attention to them (85.1%), and it was 'always' or 'often' true that their friends 'listened to what they had to say' (84.4%), and that they could 'count on their friends to help them when they had a problem' (81%).
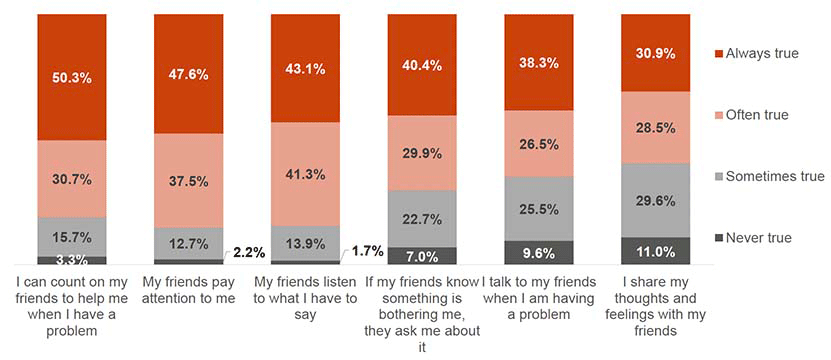
Base: All young people (2628)
Girls were more likely to respond 'always true' for each statement;
- My friends listen to what I have to say – 48.7%, compared with 37.5% of boys.
- I can count on my friends to help when I have a problem – 57.3%, compared with 43.2% of boys.
- I talk to my friends when I'm having a problem – 46.4%, compared with 30.1%.
- If my friends know something is bothering me they ask – 52%, compared with 28.8% of boys.
- I share thoughts and feelings with my friends – 39.7%, compared with 21.9% of boys.
- My friends pay attention to me – 52.7%, compared with 42.2% of boys.
Disabled young people were less likely to say it was 'always true' for each statement:
- My friends listen to what I have to say (35.9%, compared with 44.4%)
- I can count on my friends to help when they have a problem (37.8%, compared with 52.5%)
- I talk to my friends when I'm having a problem (31.5%, compared with 39.5%)
- If my friends know something is bothering me they ask (32.7%, compared with 41.8%)
- I share thoughts and feelings with my friends (21%, compared with 32.6%)
- My friends pay attention to me (34.8%, compared with 49.8%).
A similar set of questions were asked to young people about their parents (see section 3.1). As shown in Figure 20, young people were more likely to respond that it was 'always true' for each statement when referring to their parents compared with when the statements referred to their friends.
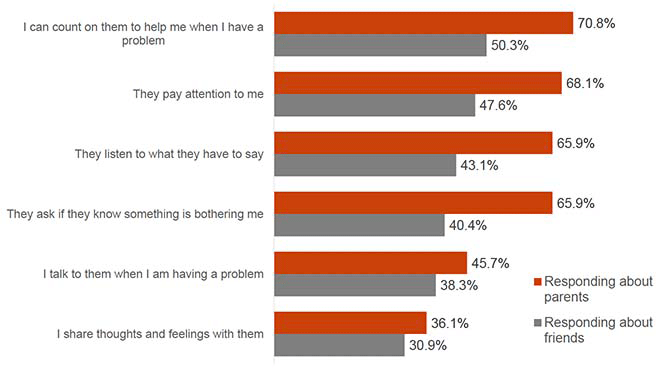
Base: All young people with a parent living in household who were happy to answer questions about their relationship with their parent 1 (2626-2627), All young people (2628)
4.2 Peer pressure – young person
Young people were asked how pressured they felt by their friends or people they knew to do certain things. As shown in Figure 21, the majority of young people said they felt 'not at all' pressured by their friends. However, one third (32.9%) said they felt 'a little' or 'a lot / quite a lot' pressured to act tough or hard, whilst two in five (40%) felt 'a little' or 'a lot / quite a lot' pressured to look or dress a certain way.
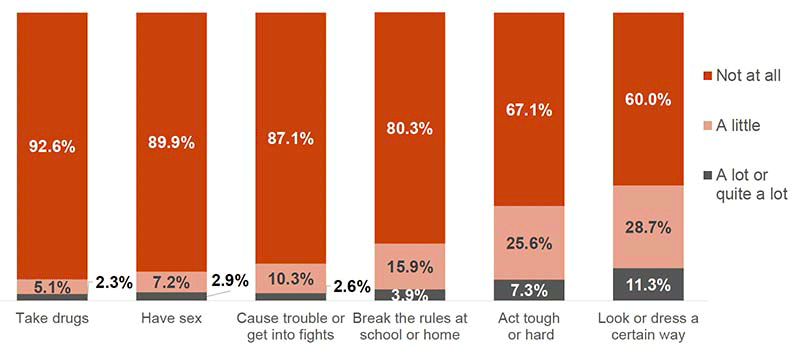
Base: All young people (2632-2633)
Boys were more likely to say they felt 'a lot', 'quite a lot' or 'a little' pressure to act tough or hard (36.3%, compared with 29.6% of girls), to break rules at school and at home (23%, compared with 16.5% of girls) and to cause trouble or get into fights (17.5%, compared with 8.4% of girls).
Conversely, girls were more likely to say they felt pressured to look or dress a certain way', with 45.8% saying they felt 'a lot, 'quite a lot' or 'a little' pressure, compared with 34.2% of boys.
4.3 Bullying and discrimination – young person
Young people were asked how other young people may have treated them by doing any of the things listed in Figure 22. Most young people said they had not been bullied by other young people in these ways. However, half (49.1%) said they had been picked on by being called names or been made fun of in a way they didn't like, and just under one in five were picked on in this way at least once a week or more. A small proportion said they had been picked on at least once a week or more through other behaviours.
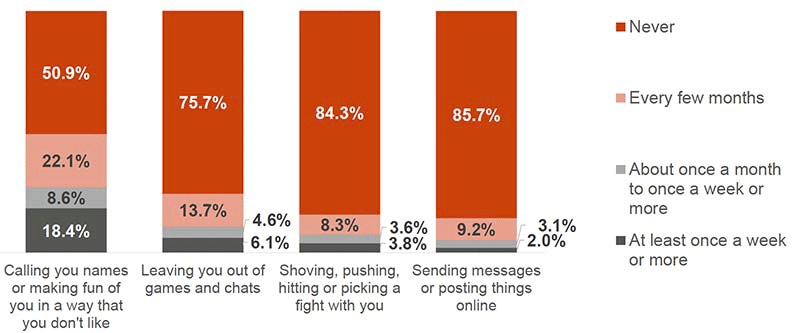
Base: All young people (2626-2630)
There were differences between girls and boys, with girls were more likely to say that they had experienced bullying through:
- Name calling (52.1%, compared with 46.1% of boys)
- Being left out of games/chats (26.7%, compared with 21.9% of boys)
- Messages/posting online (17.4%, compared with 11.1% of boys).
Whereas boys were more likely to say they had experienced shoving, pushing, hitting or picking a fight (19.3%, compared with 12.2% of girls).
Disabled young people were more likely to say they had experienced bullying through:
- Name calling (60.3%, compared with 47.2% of non-disabled young people)
- Being left out of games/chats (29.5%, compared with 23.5% of non-disabled young people)
- Being shoved, pushed hit or picked in a fight (23.8%, compared with 14.4% of non-disabled young people).
Young people were asked how often they picked on others. The majority (82.2%) said they never picked on others, whilst small minorities picked on others 'most days' (1.3%), 'about once a week' (2.4%), or 'about once a month' (2.9%). A further 11.3% said they picked on others 'every few months.'
Boys were more likely to say that they had picked on others (21.8%, compared with 14% of girls).
4.3.1 Discrimination – young person
When asked whether anyone had treated them unfairly, the majority (70.4%) of young people said others had not treated them unfairly because of any of the characteristics shown in Figure 23[8]. Around one fifth said they were treated unfairly because of their body shape, size or physical appearance, whilst smaller proportions said they were treated unfairly because of other individual characteristics.
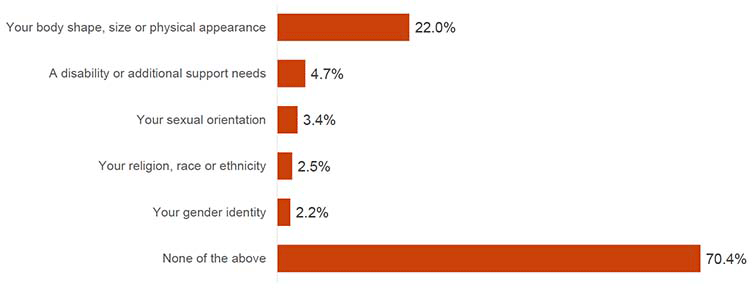
Base: All young people (2614)
Girls were more likely than boys to say that they had been treated unfairly because of their body shape (24.5%, compared with 19.4%), their sexual orientation (5.1%, compared with 1.6%) and their gender identity (3%, compared with 1.4%).
Disabled young people were more likely than non-disabled young people to say they had been treated unfairly because of:
- Their body shape, size or physical appearance (27.7%, compared with 21.1%)
- Their disability or additional support needs (15.6%, compared with 2.8%)
- Their sexual orientation (5.1%, compared with 3.1%)
- Their gender identity (4.3%, compared with 1.9%).
4.4 Gender identity and sexual orientation
Young people were asked how they thought of themselves in terms of their gender identity; 49.8% said they considered themselves to be a man/boy, 49.4% said women/girl and 0.8% said 'in another way'.
When asked how they thought of themselves in terms of sexual orientation, the vast majority of young people (89.3%) answered 'straight/heterosexual', whilst 1.2% identified as 'gay or lesbian', 7.3 % as 'bisexual' and 2.2% 'in another way.'
Boys were more likely to say they identified as 'straight/heterosexual' (95%, compared with 84% of girls). Disabled young people were less likely to say they identified as 'straight/heterosexual' (82.6%), compared with non-disabled young people (90.5%).
4.5 Relationships and sexual experience
Three out of ten (30%) young people had a boyfriend or girlfriend in the last 12 months that they went out with for at least three months; 70% had not.
Disabled young people were less likely to say they had 'a boyfriend or girlfriend at the moment' (25.1%, compared with 30.9% of non-disabled young people).
Young people in SIMD quintiles 1, 2 and 3 were more likely to say they had a boyfriend or girlfriend (36.3%, 31.6% and 33.9% respectively) compared with those in quintile 5 (22.7%).
Young people were asked how much, if any, sexual experience they had. As shown in Figure 24, two thirds said they had no sexual experience, whilst 9.5% said they had 'some experience, but not sexual intercourse' or 'more experience, including sexual intercourse'. A further quarter said they had a 'small amount' of experience.
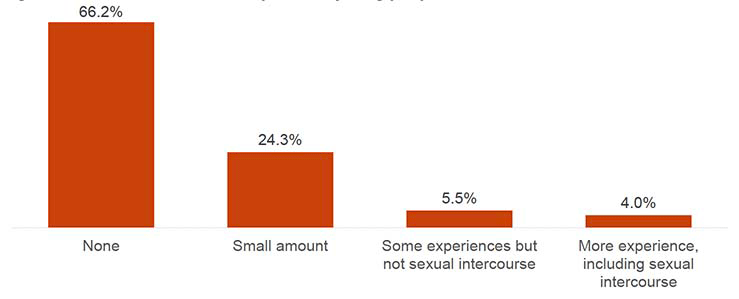
Base: All young people (2635)
Disabled young people were more likely to say they had 'no sexual experience (73.5%, compared with 64.9% of non-disabled young people).
Those who said they had 'more sexual experience' or 'some sexual experience' were asked whether they had ever had sex without a condom. Those with 'more sexual experience' were asked if they had ever had sex without using any form of protection or contraception, and how old they were the first time they had sexual intercourse.
For those who reported 'more/some sexual experience', 27.8%[9] had ever had sex without a condom. For those who reported 'more sexual experience' just over one third (34%) said they had ever had sexual intercourse without using any form of protection or contraception[10].
Young people with more sexual experience were asked how old they were the first time they had sexual intercourse; the majority (69.2%[11]) said they were aged 14, whilst 19.7% were 13 years old or younger, and 11.1% were 15 years old[12].
4.6 Sexual health and behaviour – parent/main carer
Parents were asked how often they (or their partner) had spoken to their child about the range of issues relating to sex. The full text is shown below, with abbreviations used in Figure 25:
- Sex, including sexual intercourse.
- How to behave in relation to people he/she might be sexually attracted to, and/or how to respond to sexual advances.
- Contraception to protect against pregnancy.
- Safe sex or sexually transmitted infections (also sometimes referred to as STIs).
- His/her sexual orientation (e.g. homosexuality, heterosexuality, etc.).
As shown in Figure 25, the majority of parents said they had spoken to their child more than once about 'sex, including sexual intercourse' and 'how to behave in relation to people he/she might be sexually attracted to, and/or how to respond to sexual advances.' Just under four in ten parents said they had never discussed 'contraception to protect against pregnancy', 'safe sex or sexually transmitted infections' or his/her sexual orientation'.
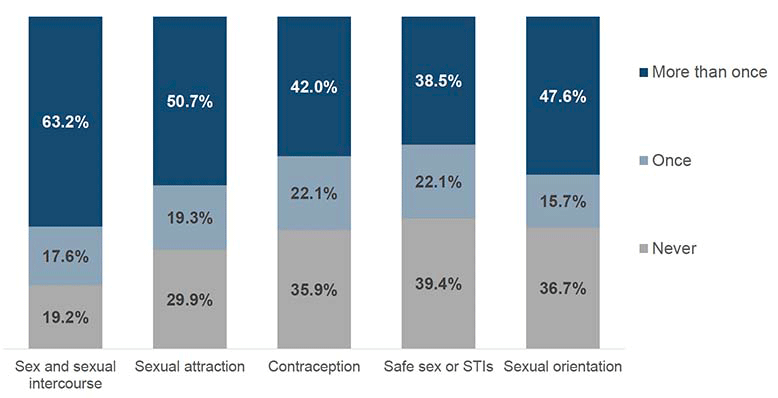
Base: All parents/main carers (2747-2748)
Parents of boys were more likely than parents of girls to say they had 'never' talked to their child about;
- Sex and sexual intercourse (23%, compared with 15.5%)
- Sexual attraction (32.5%, compared with 27.2%)
- Contraception (38.8%, compared with 33%).
Conversely, parents of disabled young people were more likely than parents of non-disabled young people to say they had talked 'more than once' to their child about all of the statements shown;
- Sex overall (68.6%, compared with 62.1%)
- Sexual attraction (57.6%, compared with 49.6%)
- Contraception (50.5%, compared with 40.5%)
- Safe sex (43.6%, compared with 37.6%)
- Sexual orientation (57.6%, compared with 45.8%).
Contact
Email: GUS@gov.scot