Life at age 14: initial findings from the Growing Up in Scotland study
Growing Up in Scotland is a longitudinal study following the lives of young people. The report is based on data collected in 2019/20, when participants were 14 years, from 2,943 families. The report presents high level findings relating to young people’s experiences across a range of life domains.
5. Social media usage and activities
This section presents findings from questions asked to young people about their screen time, leisure and youth activities, as well as their access to spending money. Parents were asked questions about their child's whereabouts and caring responsibilities.
5.1 Screen time – young person
Young people were asked how many hours they usually spend on an average school day on a phone, a tablet, a TV or a computer. The full descriptions of each option are shown below, with abbreviations used in Figure 26):
- Watching videos, television programmes or films. This included watching videos on YouTube or other online platforms, and using streaming services such as Netflix.
- Playing online or electronic games. This could be on a phone, on a computer or on a games system, such as an X-Box, PlayStation, Nintendo Switch or D-S.
- On social media or messaging people they know. For example texting or using Instagram or Snapchat, or messaging or chatting to people that they played online games with.
This question included time before as well as time after school. As shown in Figure 26, 85.6% said they spent at least one hour per day watching videos, television programmes or films. Six out of ten (59%) young people said they spent at least one hour playing online or electronic games, whilst seven out of ten (69.2%) spent at least one hour on social media or messaging people they know.
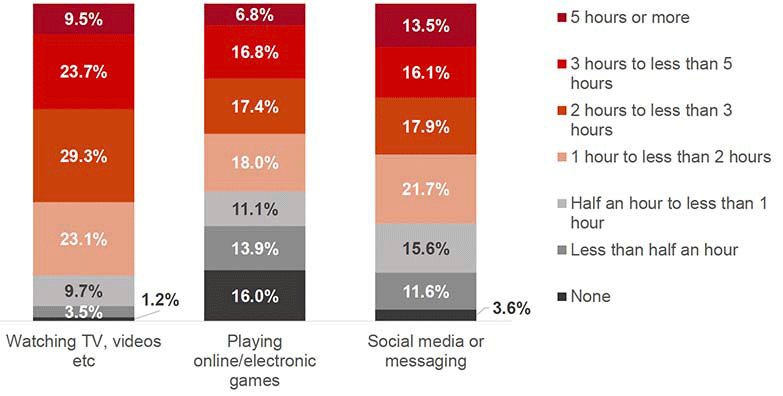
Base: All young people (2773)
Boys were more likely to say they spent time 'playing online/electronic games'; 88.8% said they had done this for at least half an hour, compared with 51.3% of girls.
Conversely, girls were more likely to say they spent time on 'social media or messaging'; 93.0% had done this, compared with 76.7% of boys.
Disabled young people were less likely to say they spent time on 'social media or messaging' with 71.8% saying they had done this for at least half an hour, compared with 87.1% of non-disabled young people.
5.2 Social media and fear of exclusion – young person
Young people were asked about their fear of exclusion with regards to social media.
For each statement shown in Figure 27, over half of young people said it was 'not at all true'. However, one out of five said it was 'extremely true', 'very true, or 'moderately true' that they would feel left out from their friends if they couldn't use social media at night.
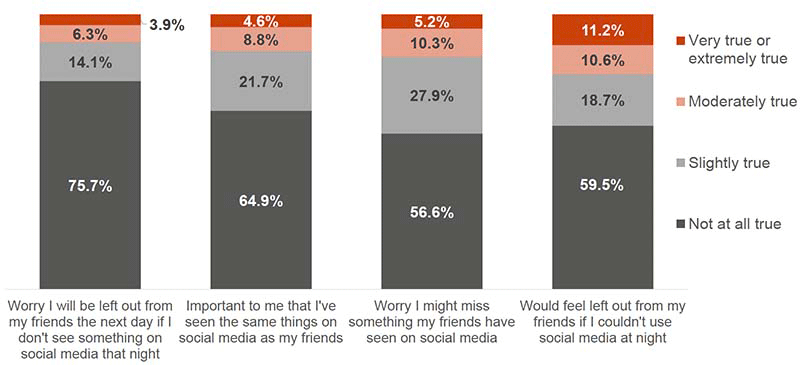
Base: All young people (2630-2631)
Girls were more likely to respond 'extremely true' or 'very true' for all of the statements;
- 'I worry I might miss something my friends have seen on social media' – 7.7% of girls, compared with 2.8% of boys.
- 'It's important to me that I've seen the same things on social media as my friends' – 6.5% of girls, compared with 2.6% of boys.
- 'I worry that I will be left out from my friends the next day if I don't see something on social media that night' – 5.6% of girls, compared with 2.1% of boys.
- 'I would feel left out from my friends if I couldn't use social media at night' – 15.2% of girls, compared with 7% of boys.
Disabled young people were more likely to say it is 'not at all true' that it is important to them that they've seen the same things on social media as their friends (70.8%, compared with 63.8% of non-disabled young people).
5.3 Managing money – young person
When asked whether they had any regular spending money just over three quarters of young people (78.2%) answered 'yes'[13].
5.3.1 Spending money sources
Young people were asked how they received their spending money based on the different ways shown in Figure 28. The most commonly chosen ways included being given money when needed, receiving an allowance, and doing chores or babysitting at home.
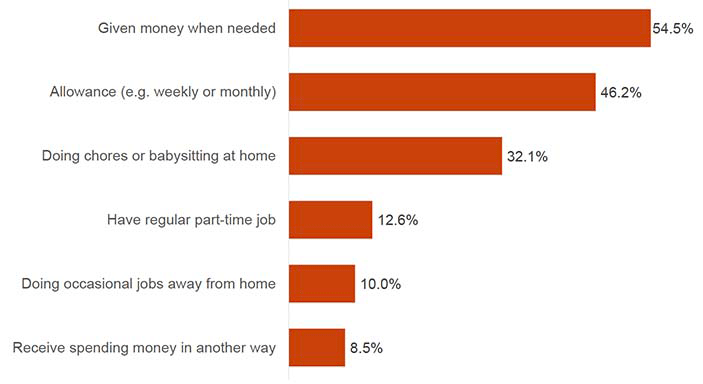
Base: All young people with access to spending money (2174)
Disabled young people were less likely to say they got money from 'doing occasional jobs away from home' than non-disabled young people (5.9% and 10.7% respectively) and from 'having a regular part-time job' (8.4%, compared with 13.3%).
There were a number of differences between SIMD quintiles. Young people in SIMD quintile 5 were more likely to have an allowance (56%) compared to those in quintiles 1 (41%), 3 (41.1%) and 4 (44.3%). Conversely, young people in SIMD quintile 1 were more likely to say that they were 'given money when needed' (64.2%) than those in less deprived quintiles (54.5% of quintile 2, 51.6% of quintile 3, 53.3% of quintile 4 and 49.6% of quintile 5).
Young people in SIMD quintile 1 were less likely to say they get money from 'doing occasional jobs away from home' than those in less deprived quintiles (4.2%, compared with 8.2% of quintile 2, 15.8% of quintile 3, 11.2% of quintile 4 and 10.9% of quintile 5) and less likely to say they get money 'in another way' (4.7%) compared with those in quintiles 4 and 5 (10% and 11.3% respectively).
5.3.2 Access to money
When asked about their access to money, over half said they used a bank account in their own name, as shown in Figure 29. Just over one third had no access to any of the options listed.
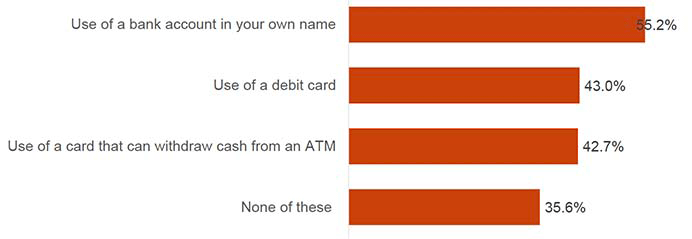
Base: All young people with access to spending money (2174)
Disabled young people were less likely than non-disabled young people to have any of the following:
- Use of bank account in their own name (49.2%, compared with 56.2%)
- Use of a debit card (35.8%, compared with 44.2%)
- Use of a card that can withdraw cash from an ATM (34.6%, compared with 44.1%).
Young people in quintile 1 were less likely than those in all other quintiles to have access to their money in all of the ways shown;
- 41.5% had a bank account in their own name, compared with 50.2% of quintile 2, 56.6% of quintile 3, 59.3% of quintile 4 and 66.3% of quintile 5.
- 26.3% had use of a debit card, compared with 37% of quintile 2, 41.9% of quintile 3, 53% of quintile 4 and 53.6% of quintile 5.
- 28.4% had use of a card to withdraw cash, compared with 37.6% of quintile 2, 44% of quintile 3, 48.4% of quintile 4 and 52.8% of quintile 5.
5.3.3 Whether parent talks to the young person about money
Young people were asked how often, if at all, their parents talked to them about what they did with their money. Just under half said their parents talked 'very often' (14.8%) or 'often' (33%) to them about this topic, whilst a smaller proportion (15.6%) said this was 'rarely' the case. The remainder (36.6%) said their parents spoke to them about money 'sometimes'.
Disabled young people were more likely to say their parents spoke 'rarely' to them about what they did with their money (23.4%, compared with 14.2% of non-disabled young people).
5.4 Organised activities – young person
5.4.1 After school activities
Young people were asked if they had regularly participated in any of the organised activities shown in Figure 30 outside of school hours in the last 12 months[14]. The most commonly named activities were 'team sports', 'art, music, performance', and 'individual sport'. Around three in ten young people had not participated in any of these activities.
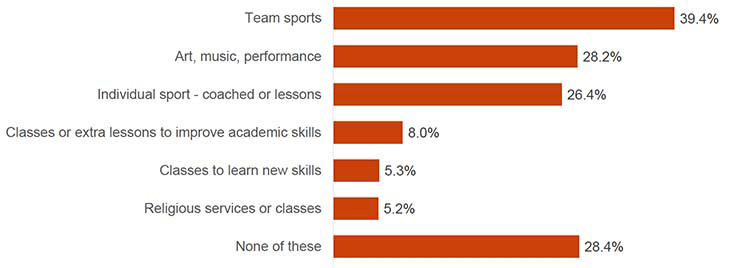
Base: All young people (2774)
Boys were more likely to have taken part in team sports (48.9%, compared with 29.9%). Girls were more likely to have taken part in art, music, performance (39.6%, compared with 16.9%).
Disabled young people were less likely to have taken part in team sports (22.1%, compared with 42.5% of non-disabled young people) and classes or extra lessons to improve academic skills (5.5%, compared with 8.5% of non-disabled young people). Disabled young people were also more likely to say they had not taken part in any of the activities shown (44.9%, compared with 25.4%).
In general, those in the highest SIMD quintile were more likely to take part in some activities;
- 49.7% of those in quintile 5 took part in team sports, compared with 31.9% of quintile 1, 32.9% of quintile 2 and 37.2% of quintile 3.
- 36% of those in quintile 5 took part in art, music or performance, compared with 22.2% of those in quintile 1 and 24.3% of quintile 2.
- 12.8% of those in quintile 5 took part in classes or extra lessons, compared with 5.7% of quintile 1, 6.8% of quintile 2 and 5.7% of quintile 3.
- 7.9% of quintile 5 took part in classes to learn new skills, compared with 3.7% of quintile 1 and 3.6% of those in quintile 3.
5.4.2 Youth work activities
When asked if they had regularly participated in any youth work activities in the last 12 months, around six in ten young people stated they had not participated in any of the activities shown in Figure 31[15]. One in five said they were 'involved in a group working towards a youth award', whilst 15.5% were 'members of uniformed youth'[16].
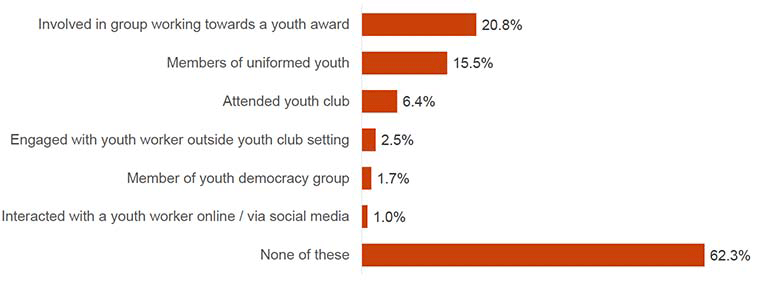
Base: All young people (2774)
Girls were more likely to say they had been involved in a group working towards a youth award (25.7%, compared with 15.8% of boys) or attended a youth group (7.5%, compared with 5.2% of boys).
Disabled young people were less likely than non-disabled young people to say they had been involved in a group working towards a youth award (15%, compared with 21.8%).
Those in SIMD quintile 1 were less likely than that those in quintiles 4 and 5 to say they had been members of uniformed youth (10.7%, compared with 17.2% and 20.9% respectively) but were more likely to say they had attended a youth club (9.7%, compared with 5.2% and 5% respectively).
Those in SIMD quintiles 1 and 2 were less likely to say they were involved in a group working towards a youth award (13.6% and 13.5%) than those in quintiles 4 (24.3%) and 5 (32.7%).
5.5 Young person's activities – parent/main carer
Parents were asked to what extent they knew about their child's activities and whereabouts. Three quarters said they knew 'all of the time' where their child was after school, whilst only a small minority said 'some of the time' or 'hardly ever.' As shown in Figure 32, around half of parents said they were aware 'all of the time' who their child is with when not at home, what their child does with their free time and what their child spends their money on. Most of the remainder said they were aware 'most of the time'.
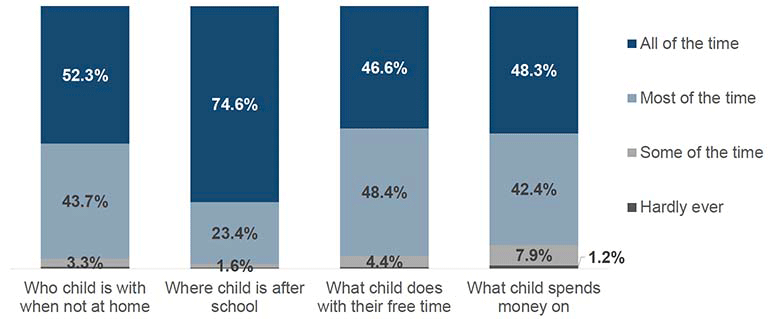
Base: All parents/main carers (2906-2914)
Parents of girls were more likely to say they knew where their child is after school 'all of the time' (78%, compared with 71.3% for parents of boys) and who their child is with when not at home (57.9%, compared with 47%).
Parents of a disabled young person were more likely to say they knew 'all of the time' than parents of a non-disabled young person for the following statements:
- Who their child is with when they are not at home (61.7%, compared with 50.4%)
- What child does in their free time (56.6%, compared with 44.7%)
- What their child spends their money on (58.2%, compared with 46.5%).
5.6 Caring responsibilities – parent/main carer
Parents were asked whether their child had caring responsibilities[17], with 11.1% answering 'yes'. Those that reported that their child was a young carer were also asked how many hours in a week they provide help. Of those, the majority (62.6%) reported that their child spent less than 4 hours a week providing help, a further 26.9% reported that their child spent between 4 and 19 hours providing help, whilst for 6.6% the time spent providing help exceeded 20 hours[18].
Parents of a disabled young person were more likely to say their child had caring responsibilities compared with parents of a non-disabled young person (15.7%, compared with 10.2%).
Parents in SIMD quintile 1 were more likely to say that their child had caring responsibilities (17.2%) compared with those in less deprived quintiles (11.4% of quintile 2, 12.3% of quintile 3, 8.9% of quintile 4 and 6.8% of quintile 5).
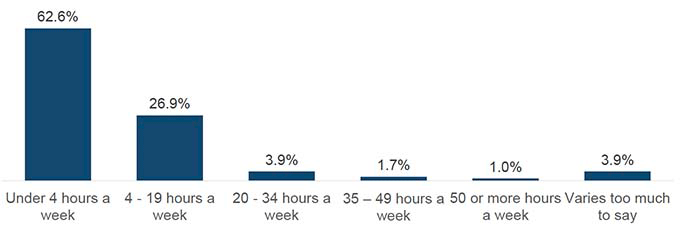
Base: All parents/main carers who reported young person has caring responsibilities (306)
Contact
Email: GUS@gov.scot