Life at age 14: initial findings from the Growing Up in Scotland study
Growing Up in Scotland is a longitudinal study following the lives of young people. The report is based on data collected in 2019/20, when participants were 14 years, from 2,943 families. The report presents high level findings relating to young people’s experiences across a range of life domains.
2. Experience of school and educational aspirations
This section presents findings relating to young people's experiences at school and their plans after school, as well as parents' engagement and involvement with school. Most questions in this section were only asked of those who attend school (98.3%). Some were also asked of those who are home schooled.
Disabled young people were less likely to attend school (93.5%) than non-disabled young people (99.2%).
2.1 School enjoyment and engagement – young person
Young people were asked about their enjoyment and engagement at school. As shown in Figure 1, the vast majority (84.8%) said their teacher 'always' or 'often' treats them fairly. Just over three out of five young people (61.3%) said they 'always' or 'often' enjoyed learning at school. Young people were less likely to report that they looked forward to going to school, with over half (56.4%) stating they 'sometimes' or 'never' looked forward to going to school. Only a small minority said they 'always' hated school.
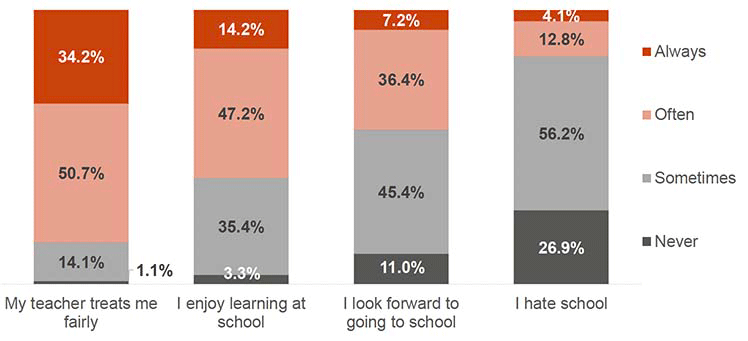
Base: All young people who attended school (2595-2596)
Girls were more likely than boys to say they 'always' enjoy learning at school (16.4%, compared with 11.6%).
Disabled young people were less likely than non-disabled young people to say they 'always' enjoy learning at school (9.7%, compared with 14.9%), but more likely to say they 'always' hate school (10.2%, compared with 3.1%).
2.1.1 Engagement with school – young person
Young people were asked how often they try their best and how often they misbehave at school. The vast majority (91.9%) said they 'always' or 'often' tried their best at school and only a small proportion (4.8%) reported that they 'always' or 'often' misbehaved or caused trouble in class.
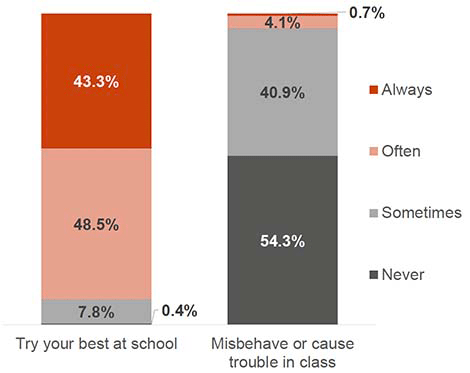
Base: All young people who attended school (2595-2596)
Girls were more likely to say that they 'always' try their best at school (50.3%, compared with 36.1% of boys). Girls were also more likely to say they 'never' misbehave or cause trouble in class (65.7%, compared with 42.7% of boys).
Disabled young people were more likely to say that they 'never misbehave or cause trouble in class (61.4%, compared with 53.1% of non-disabled young people).
2.2 Truancy – young person
Young people were also asked if they ever skipped school when their parents did not know (even if only for half a day or a single lesson); one in five (19.6%) said they had done so.
Girls were more likely to say that they had skipped school (21.7%, compared with 17.7% of boys). Young people in SIMD quintiles 1 and 2 were also more likely to say they had skipped school compared to those in quintile 5 (24.2% and 23.2%, compared with 15.3%).
2.3 Pressure of school work – young person
Young people were asked how pressured they felt by the school work they had to do[3]. As shown in Figure 3, 70.5% of young people said they felt 'not at all' or 'a little' pressured, whilst a small proportion (6.4%) felt 'a lot' of pressure. A further 23.1% felt 'quite a lot' of pressure.
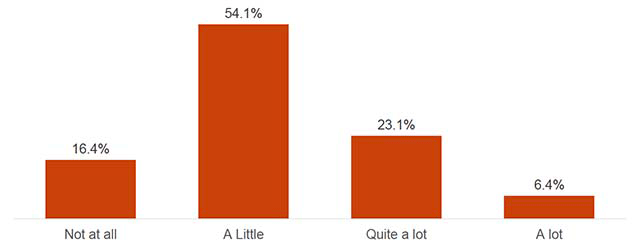
Base: All young people who attended school or were home schooled (2601)
Girls were more likely than boys to feel 'a lot' of pressure (8.5%, compared with 4.2%) or 'quite a lot' of pressure (26.3%, compared with 19.8%).
Disabled young people were more likely to feel 'a lot' of pressure (8.8%) than non-disabled young people (6%).
2.4 Perception of English and maths skills – young person
Young people were asked if they agreed or disagreed with the statements 'I am good at English' and 'I am good at Maths'; 80.8% 'agreed' or 'strongly agreed' that they were good at English, whilst around three quarters (76.1%) 'agreed' or 'strongly agreed' that they were good at Maths.
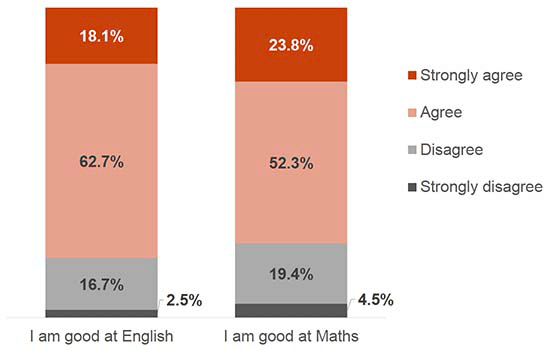
Base: All young people who attend school or were home schooled (2599-2600)
Girls were more likely to agree strongly that they were good at English (20.5%, compared with 15.5% of boys) whilst boys were more likely to agree strongly that they were good at maths (29%, compared with 18.8% of girls).
Disabled young people were less likely to 'strongly agree' that they were good at maths (17.1%, compared with 24.9% of non-disabled young people).
Young people in SIMD quintiles 1 and 2 were less likely to 'strongly agree' that they were good at maths (19.8% and 20.4% respectively), compared with those in quintile 5 (30.3%).
2.5 Aspirations – young person
All young people who attended school or were home school were asked whether they wanted to stay on at school or college full-time when they turned 16 and had finished S4, 79.5% answered 'yes'.[4]
Girls were more likely than boys to want to stay on at school or college full time (86.1%, compared with 72.5%) whilst disabled young people were less likely to want to stay on at school or college (73.6%, compared with 80.3%).
Young people in SIMD quintile 5 (85.1%) were more likely to want to stay on at school or college full time compared to those in quintiles 1, 3 and 4 (76%, 77.1% and 77.9% respectively).
Young people were then shown a list (see Figure 5) and asked what they saw themselves doing after they left school. The most commonly chosen option was 'going to University or College', whilst a substantial minority were 'not sure'.
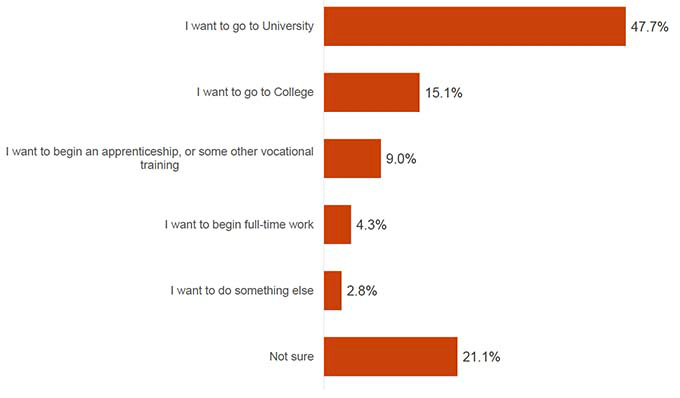
Base: All young people who attended school or were home schooled (2601)
As shown in Figure 6, girls were more likely than boys to choose all of the options shown. Boys were more likely to say they were 'not sure'.
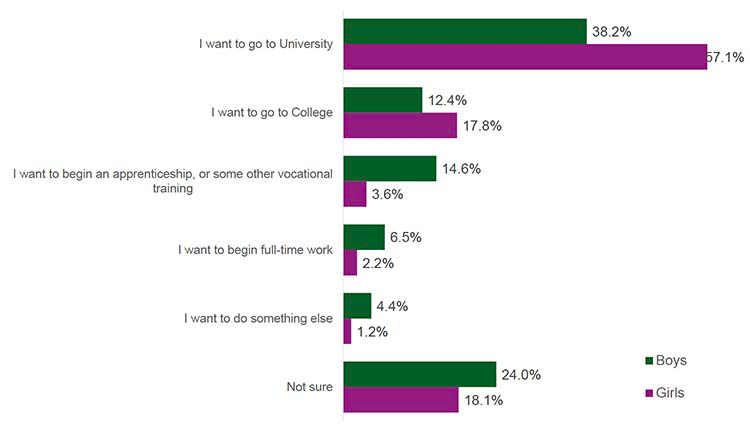
Base: Boys who attended school or were home schooled (1282), Girls who attended school or were home schooled (1306)
Disabled young people were less likely to say they saw themselves going to university (37.7%, compared with 49.3% of non-disabled young people), but more likely to saw themselves going to college (18.7%, compared with 14.6%) or to say they were not sure (29.2%, compared with 19.8%).
Young people in SIMD quintile 1 were less likely to say they saw themselves going to university than those in quintiles 4 and 5 (39.1%, compared with 51.5% and 57.5% respectively) and more likely to say they saw themselves going to college (27.8%) than those in less deprived quintiles (18.6% of quintile 2, 13.4% of quintile 3, 10.0% of quintile 4 and 7.8% quintile 5).
2.6 Additional support and contact from school – parent/main carer
Parents were asked whether their child had received any additional help or support at school; the vast majority said they had not. The most commonly chosen types of support were from the teacher and through equipment provision (see Figure 7).
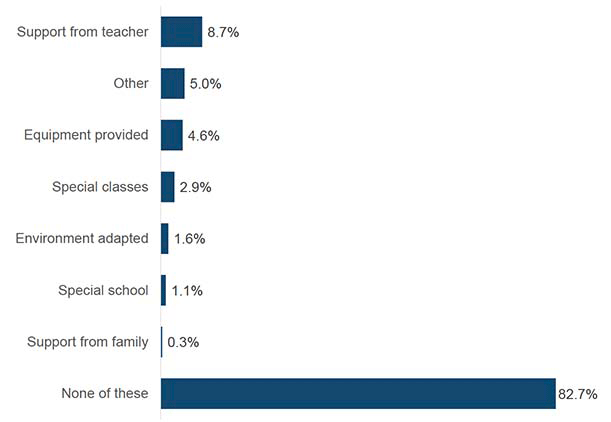
Base: All parents/main carers whose child attends school (2868)
Parents of boys were more likely to say that their child had received support in the following ways;
- Support from teacher (11.8%, compared with 5.4% of girls)
- Equipment provided (5.9%, compared with 3.3% of girls)
- Special classes (3.9%, compared with 1.9% of girls)
- Special school (1.6%, compared with 0.6% of girls).
Parents in SIMD quintile 1 were more likely than those in less deprived quintiles to say their child received support through special schools (3.4%, compared with 0.2%-1% of those in other quintiles). Those in SIMD quintile 1 were also less likely than those in quintile 5 to say their child got support from their teacher (12.8% and 5.5% respectively).
As shown in Figure 8, parents of a disabled young person were more likely to say they had received support in each of the ways shown.
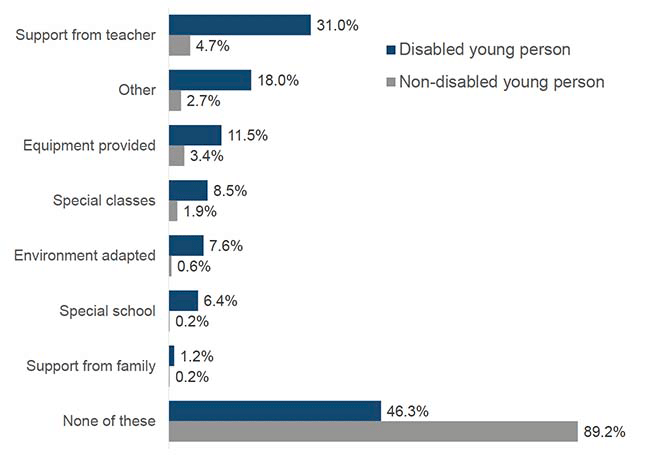
Base: Parents/main carers of a disabled young person who attends school (400), parents of non-disabled young people who attend school (2466)
2.7 Contact from school – parent/main carer
As shown in Figure 9, just over two thirds of parents said they had not had contact with their child's school since the previous GUS interview[5]. For those that had, this was most commonly because of their 'child's behaviour at school'.
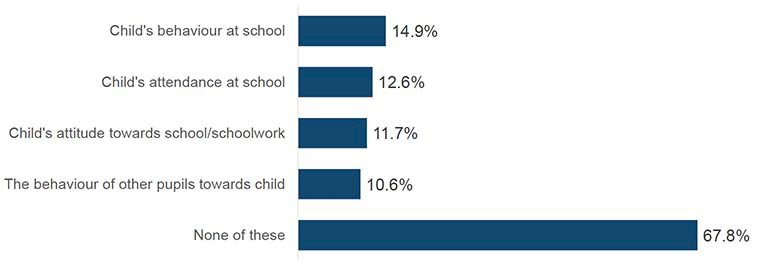
Base: All parents/main carers whose child attends school (2868)
Parents of boys were more likely to say that they had been contacted about their child's behaviour at school (21.6%, compared with 8% for parents of girls) and their attitude towards school (16.1%, compared with 7.2% for parents of girls).
Parents of a disabled young person were more likely to say they had been contacted about all of the issues shown (see Figure 10).
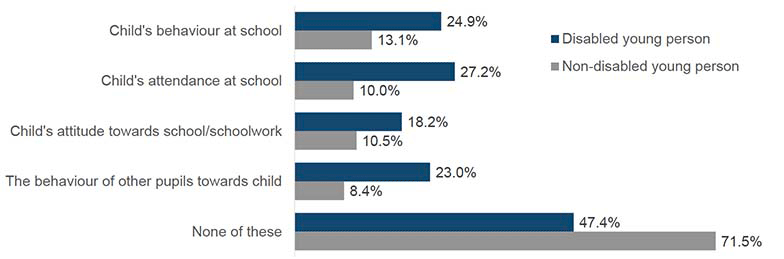
Base: Parents/main carers of a disabled young person who attends school (400) and parents/main carers of non-disabled young people who attend school (2466)
Parents in lower SIMD quintiles were more likely to say they had been contacted about some of the issues shown;
- 18.5% of those in quintile 1 and 16.4% of those in quintile 2 had been contacted about their child's behaviour at school, compared with 12.2% of those in quintile 4 and 10.8% of those in quintile 5).
- 23.9% of those in quintile 1 had been contacted about their child's attendance at school, compared with 10.3% of those in quintile 3, 7.6% of those in quintile 4 and 6.4% of those in quintile 5.
- 13.2% of those in quintile 1 and 13.8% of those in quintile 3 had been contacted about their child's attitude at school, compared with 7.8% of those in quintile 5.
2.8 Parental involvement in school – parent/main carer
Parents were shown a list of activities (shown in Figure 11) and asked if they had participated in any of them in the last year. The vast majority of parents said they had attended a parents' evening, whilst just over a third had attended a 'school event that their child had participated in'. Around one in ten said they had not participated in any school activities.
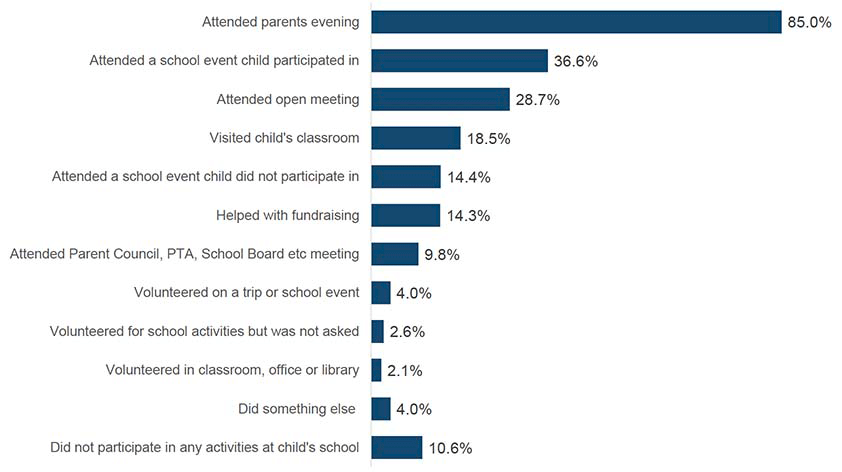
Base: All parents/main carers whose child attends school (2868)
Parents of girls were more likely to say they had attended a school event that their child had participated in (41%, compared with 32.2% of parents of boys).
Parents of a disabled young person were less likely to say they had attended a school event that their child had participated in (32.4%, compared with 37.4% of parents of non-disabled young people). Parents of a disabled young person were however more likely to say they had done something else (8.0%, compared with 3.3%).
Parents who lived in SIMD quintiles 1 were less likely to have participated in several of the activities shown;
- 74.6% attended a parents evening, compared with 86.7% of quintile 3, 89.7% of quintile 4 and 92.3% of quintile 5. Parents in quintile 2 were also less likely to have attended a parents evening than those in less deprived quintiles (79.9%).
- 25.6% attended a school event their child participated in (compared with 37% of quintile 3, 42.5% of quintile 4 and 45.9% of quintile 5).
- 17.6% attended an open meeting (compared with 27.4% of quintile 2, 30.0% of quintile 3, 31.4% of quintile 4 and 35.5% of quintile 5).
- 7.1% helped with fundraising (compared with 16.5% of quintile 3, 18.2% of quintiles 4 and 5). Those in quintile 2 were also less likely than parents in quintiles 3-5 to say they had helped with fundraising (10.4%).
- 6.3% attended a parent council, PTA, School board or other meeting (compared with 14.2% of quintile 5).
- 6.1% attended a school event that their child did not participate in (compared with 14.8% of quintile 3, 18.6% of quintile 4 and 21.2% of quintile 5).
- 1.5% volunteered or attended a school trip or event (compared with 4.7% of quintile 3, 5.8% of quintile 4 and 5.2% of quintile 5).
- Parents in quintile 1 were more likely to say they had not participated in any of these activities (20.5%, compared with 6.0% in quintile 3, 8.1% in quintile 4 and 3.3% in quintile 5). Parents in quintile 2 were also more likely than those in higher quintiles to say they had not participated (16.2%).
Contact
Email: GUS@gov.scot