International review of approaches to tackling child poverty: Comparative summary report and key learnings for Scotland
A summary of the evidence on historical approaches to tackling child poverty in Finland, Denmark, Slovenia and Croatia, with the key learnings for policy makers in Scotland.
Key poverty, inequality and labour market trends
This section of the report explores the similarities and differences between Scotland and the four case study countries – Croatia, Denmark, Finland and Slovenia – in terms of trends amongst the nature of poverty, inequality and labour market outcomes. In summary, this section shows that:
- Child poverty rates before housing costs (BHC) are higher in Scotland than the case study countries, and has been trending upwards over the last decade whereas it has either fallen (Croatia and Slovenia) or remained low and stable (Denmark and Finland) in the case study countries over the same period;
- At-risk groups, such as single parents and large families (three or more children), have higher poverty rates than other household types across Scotland and the case study countries. Scotland’s poverty rates for these family types are notably higher than the case study comparators;
- Income inequality is higher in Scotland than the comparator countries;
- Scotland has high employment rates (especially amongst parents) comparable to the case study countries and lower unemployment than the case study countries. However, parents in the case study countries are more likely than Scottish parents to work full-time, longer hours and at higher work intensities.
- In-work poverty is higher in Scotland than the case study countries, and has been trending upwards. Croatia has also seen an increase in in-work poverty over recent years.
Poverty trends
For the purpose of this section, relative (child) poverty is understood as living in a household with equivalised income below 60% of the median income after social transfers. Data comparisons between Scotland and the case study countries are not perfect due to differences in methodology and reporting. For the case study countries, data is based on EU statistics on income and living conditions (EU-SILC). EU-SILC data is reported before housing costs (BHC) and as a calendar year, with the most recent data for 2024. For Scotland, data is based on the Family Resources Survey / Households Below Average Income (FRS / HBAI). Scotland’s poverty data is mostly reported after housing costs (AHC) for three-year averages, with the most recent data 2021-2024. The exception is Figure 1 where data is reported BHC for individual financial years. Poverty rates are typically higher AHC.
Figure 1 shows how relative BHC child poverty has developed across the case study countries and Scotland between 2005 and 2024. Denmark and Finland have maintained low levels of child poverty since 2005, with child poverty rates consistently below 11% in Denmark and 12% in Finland. Slovenia also has low levels of child poverty – at 11% in 2024 – following an especially rapid decline from a high of 15% in 2014 to 9% in 2022. Croatia has similarly seen a decline in child poverty since 2012, albeit from a higher peak of 23% to 16% in 2023. It is notable that none of the case studies countries have child poverty strategies or many targeted policies aimed specifically at reducing child poverty levels.
By contrast, Scotland has seen comparatively high rates of BHC child poverty in recent years, which increased from 14% in 2013/14 to 24% in 2022/23. There has, however, been a significant decline in the most recent year from 24% in 2022/23 to 19% in 2023/24. Notwithstanding this reduction, Scotland still has higher BHC child poverty rates than all of the case study countries at the end of the time series – although only one percentage point above Croatia’s 2024 child poverty rate.
However, it should be noted that Scotland’s child poverty targets are set for AHC and while not comparable with the case study countries, Scotland’s AHC relative child poverty rates have remained fairly stable since 2011/12.[53]
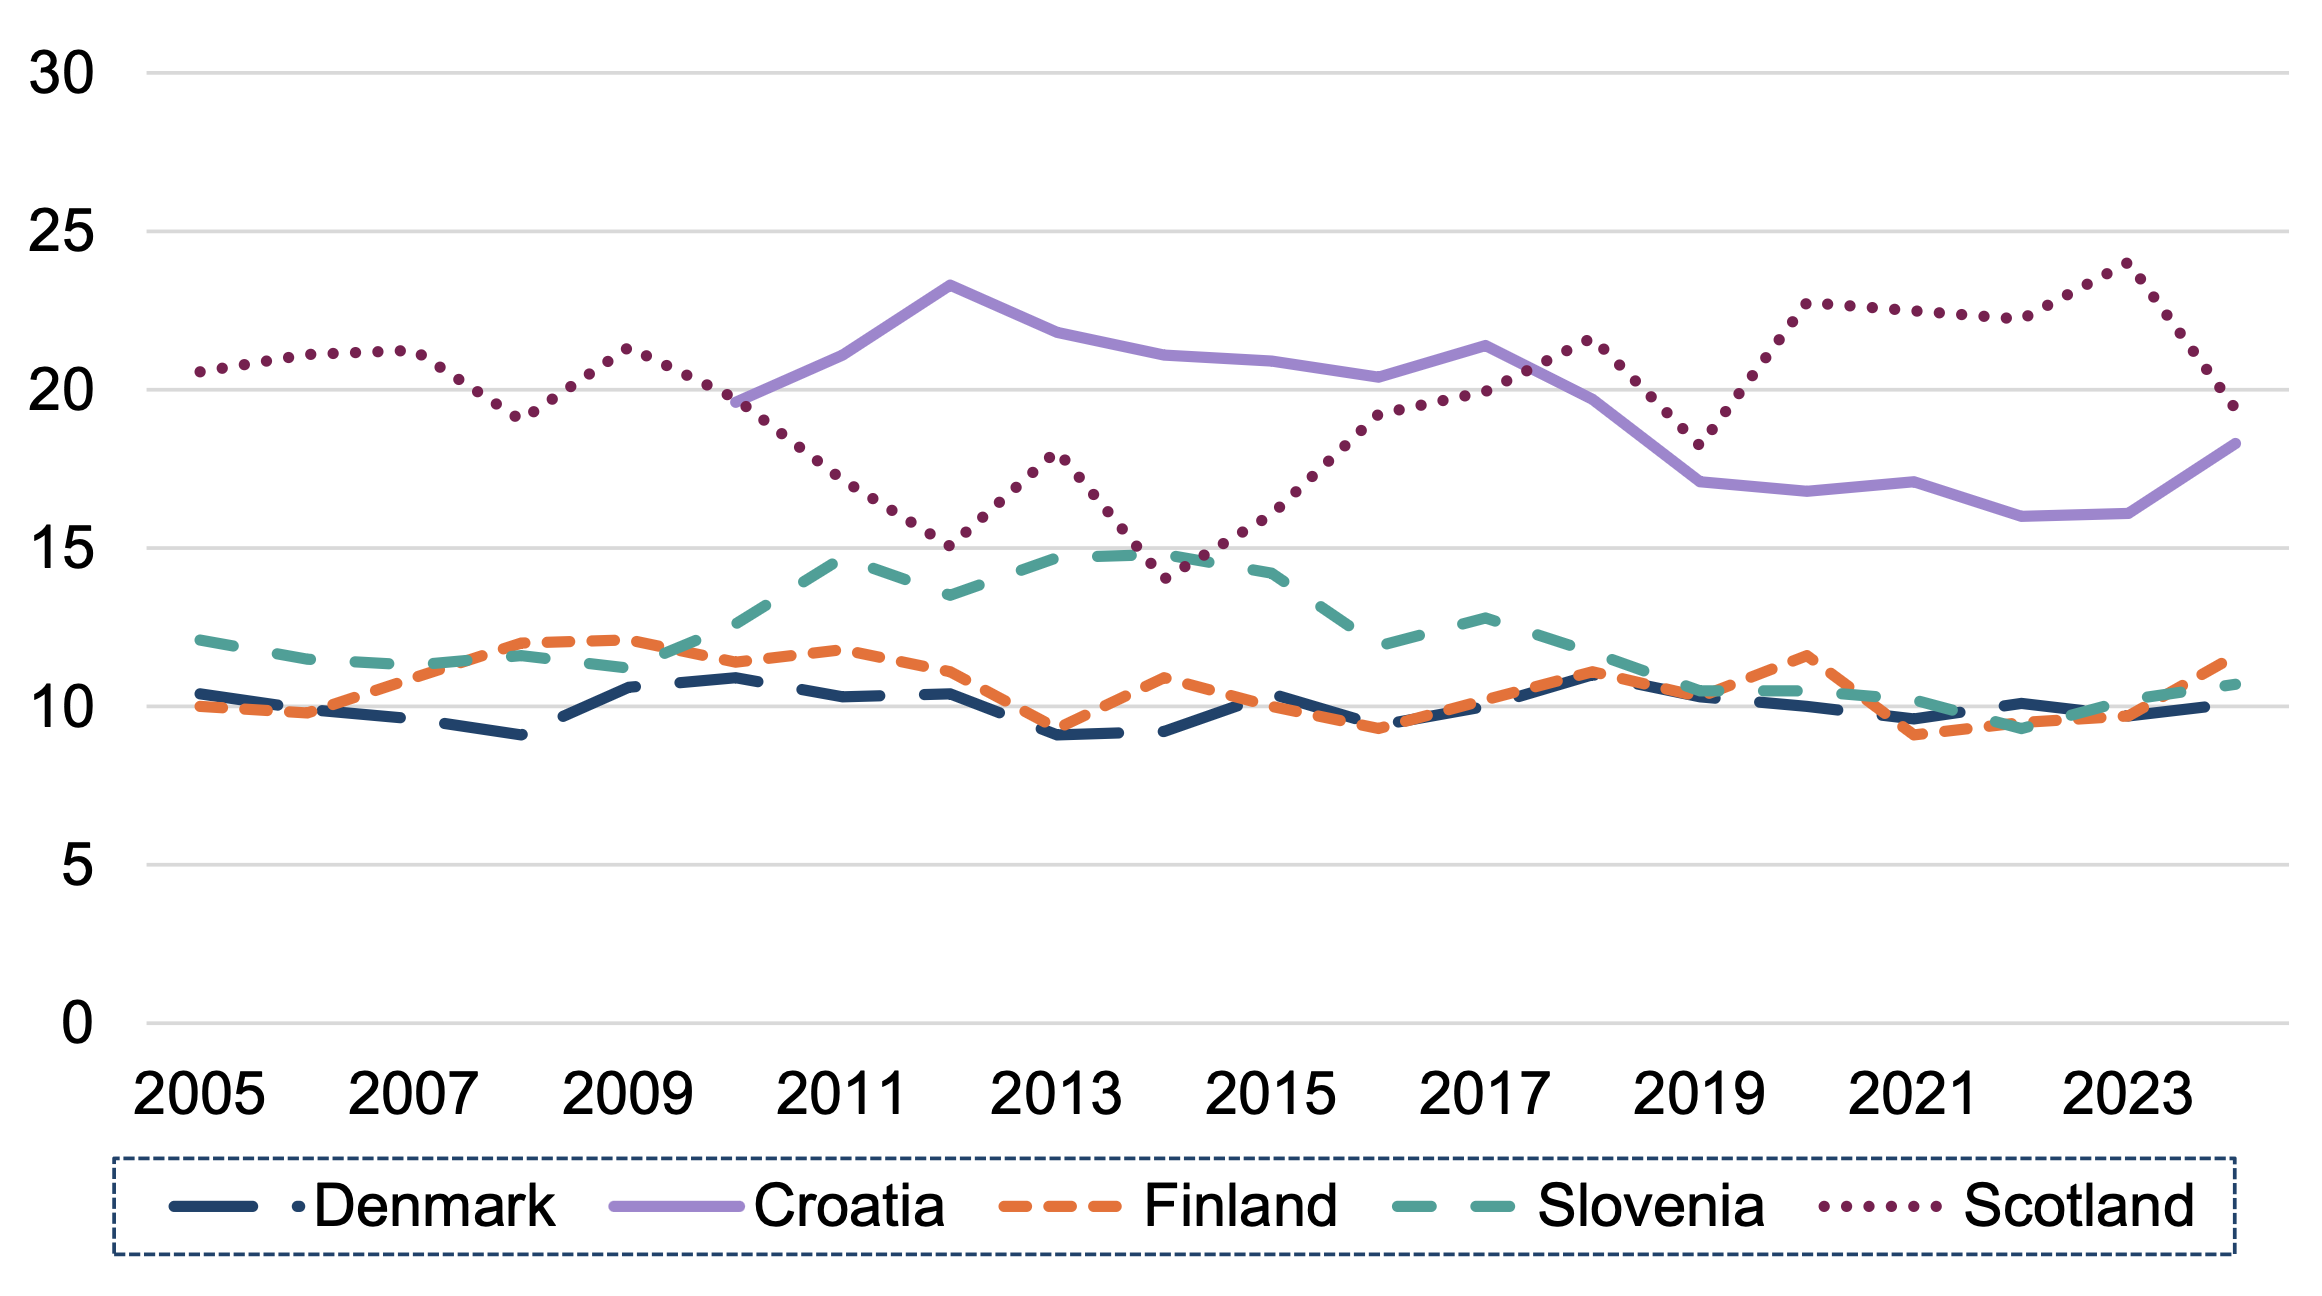
Source: Eurostat, At-risk-of-poverty rate by poverty threshold, age and sex, 2005-2024 (ilc_li02); Poverty and Income Inequality in Scotland National Statistics report, 2025 (2004/05-2023/24).
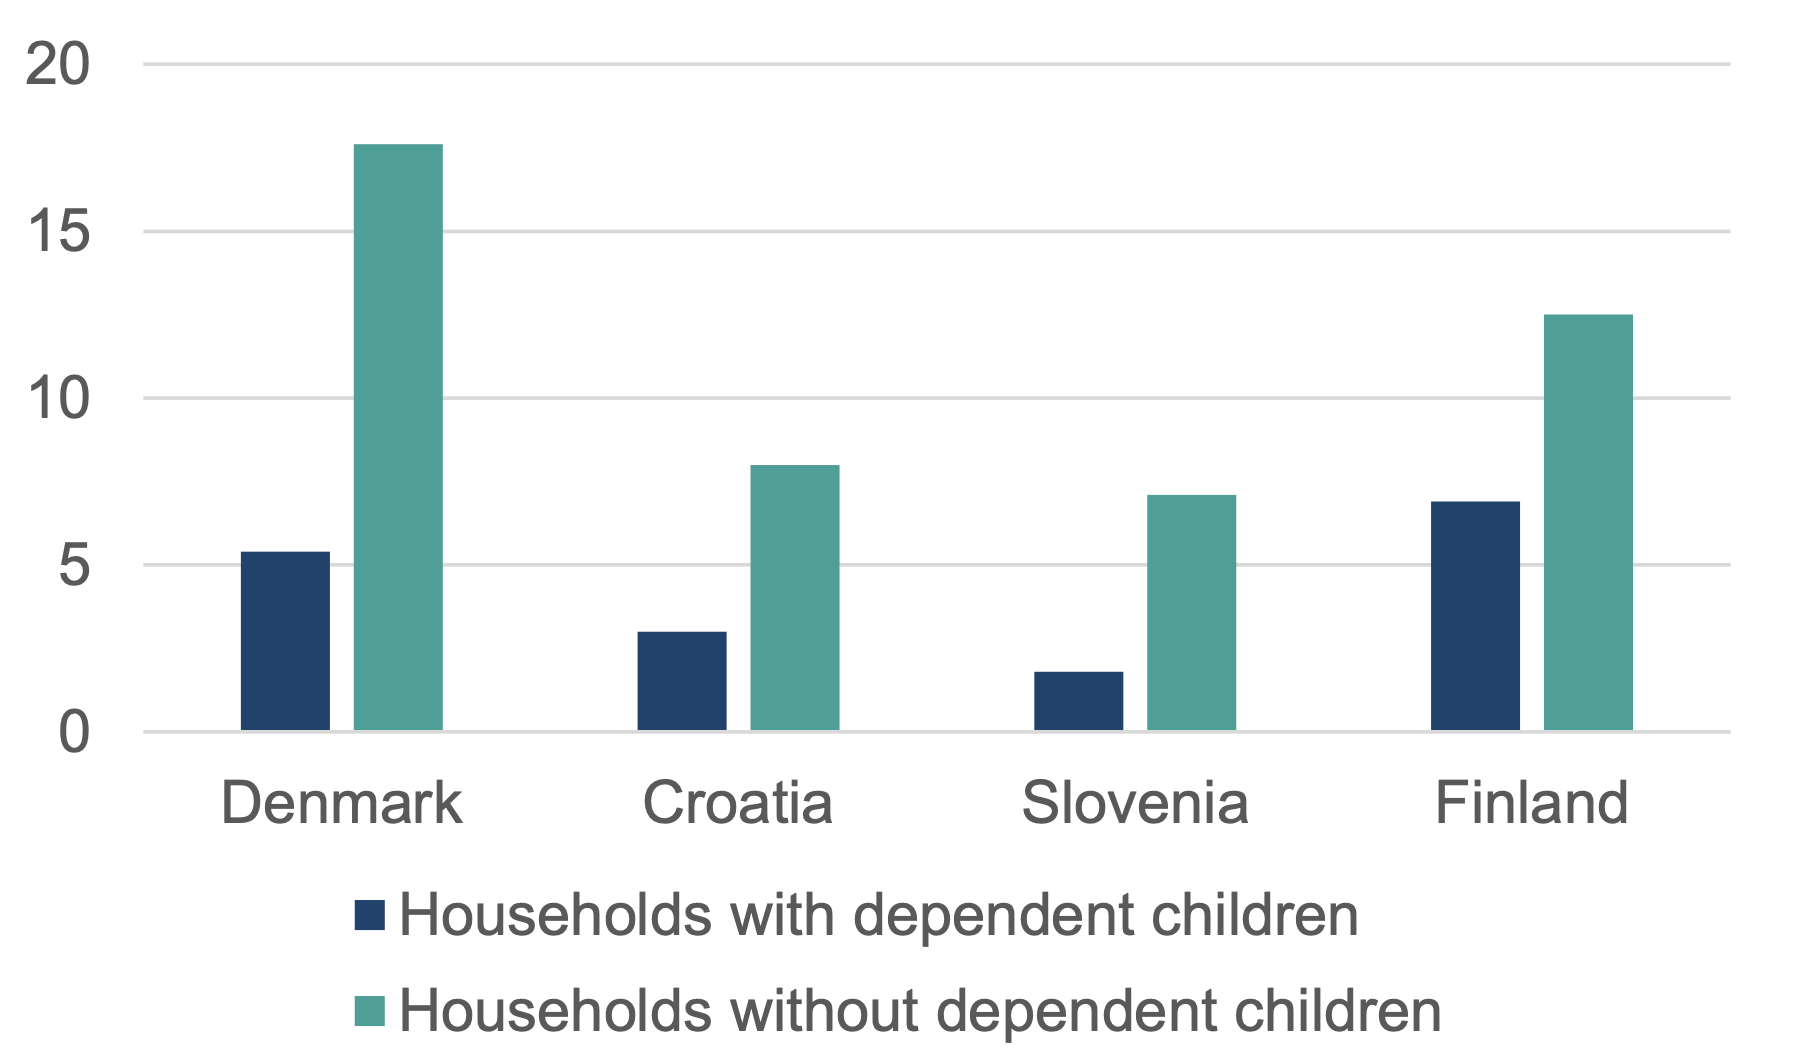
Within the case study countries, there are broadly similar patterns to the poverty rates amongst different household types. Figure 2 shows that in 2024 households with dependent children had a lower poverty rate than those without children. By contrast, Scottish households with children had a higher poverty rate than those without children in 2021-24. Evident here is the importance of well-targeted family policies for reducing poverty rates amongst families with children that boost their incomes and address the additional costs faced with raising children. Examples of these are explored in more detail in the subsequent sections of this report.
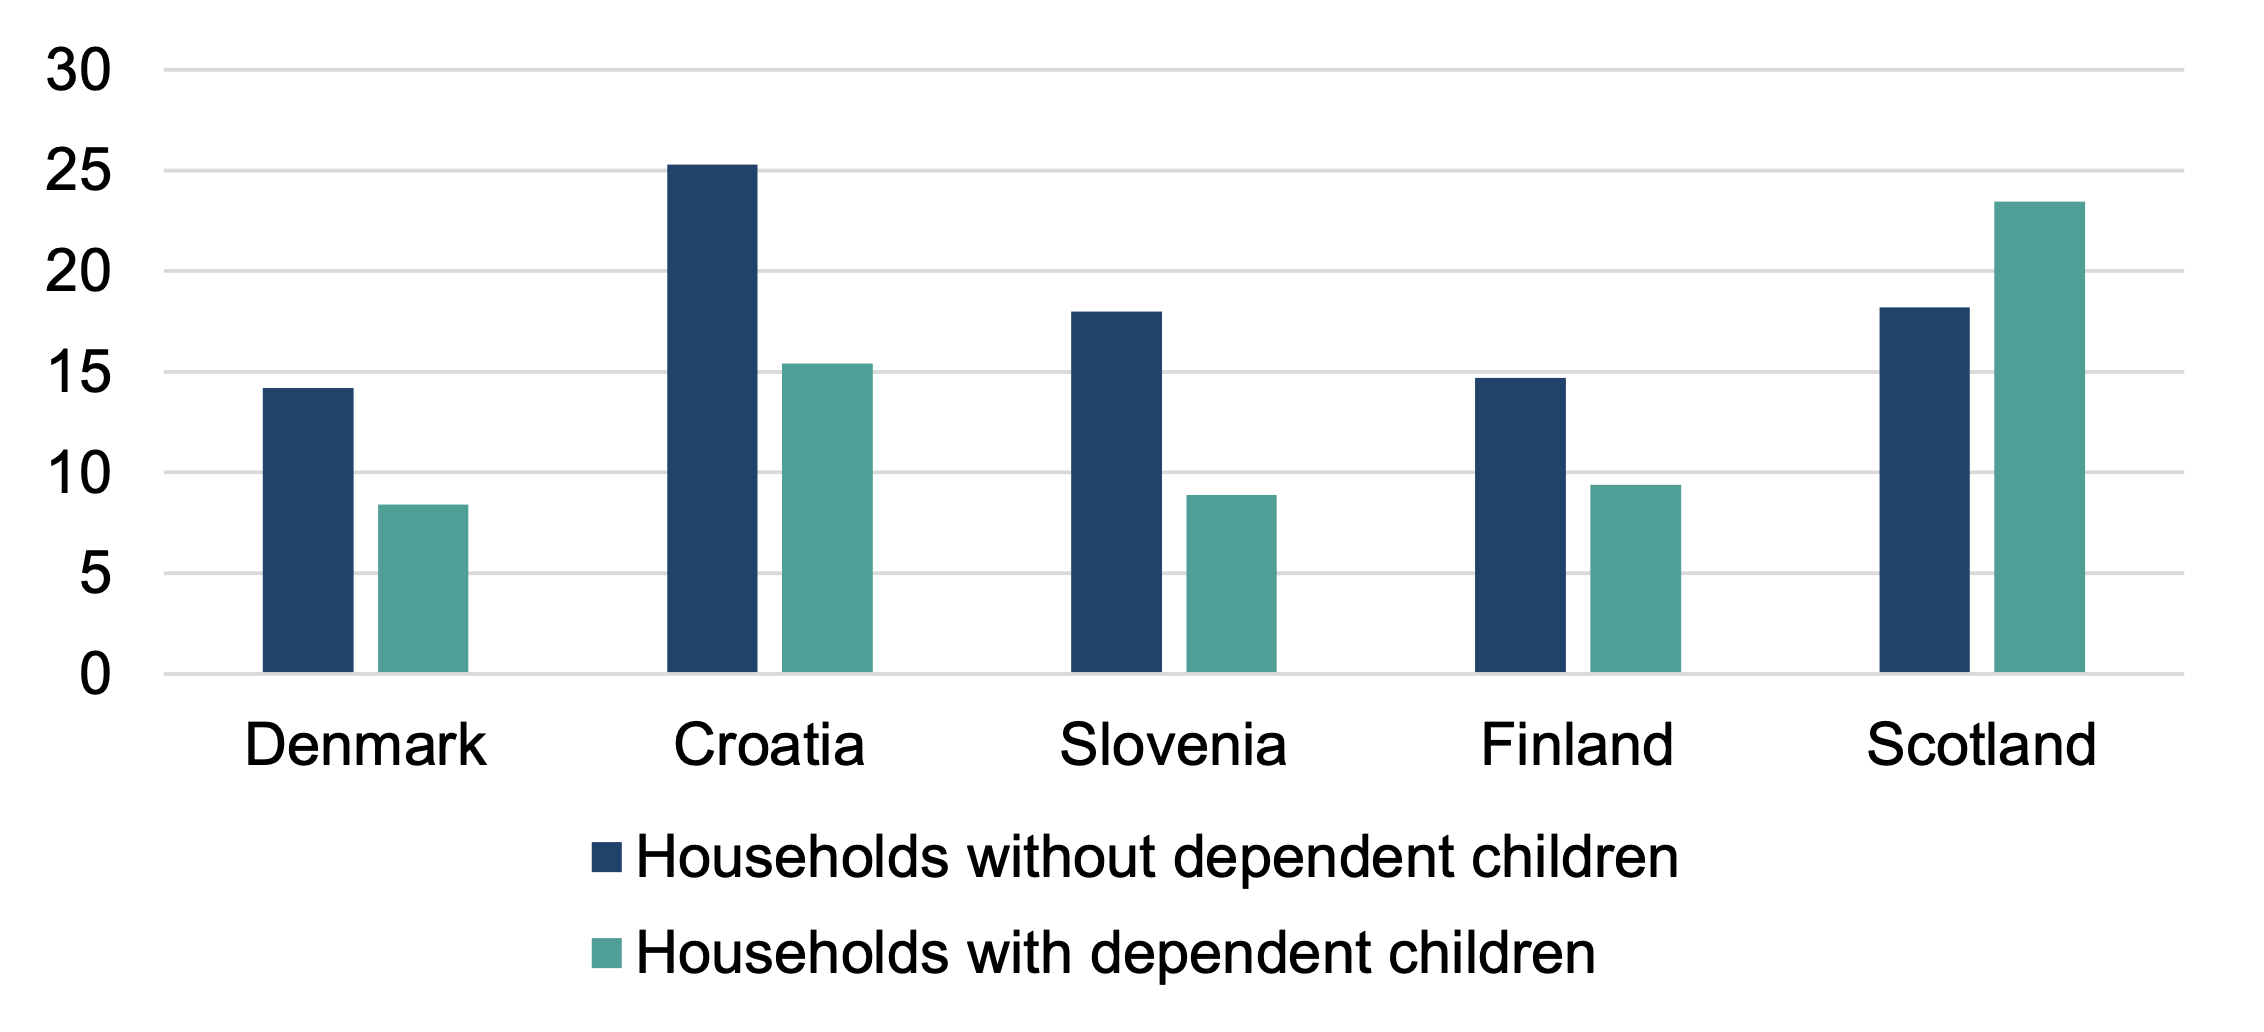
Source: Eurostat, At-risk-of-poverty rate by poverty threshold and household type, 2024 (ilc_li03); Poverty and Income Inequality in Scotland National Statistics, 2025 (three-year averages, 2021-2024)
In all countries, single parents have a higher poverty rate than couples with children. Figure 3 shows that in 2024 around a quarter of single parents are in poverty in Croatia, Denmark and Slovenia, and just under a fifth of single parents live in poverty in Finland. In Scotland just under a third (32%) of single parents were in poverty in 2021-24. By contrast, poverty rates of couples with children is very low in Denmark (6%), Finland (5%) and Slovenia (10%). Scotland’s poverty rate amongst couples with children is most comparable to Croatia’s – 18% compared to 15%. Denmark and Scotland share a similarity in that single parents have a higher poverty rate than single-person households without a child, whereas the reverse is true in Croatia, Finland and Slovenia.
As a result of their higher poverty rates, all four countries have targeted social security support for single parents unlike Scotland and the UK. All of the case study countries provide additional or more generous payments through their child benefits and social assistance / minimum income protection systems for single-parent households. Denmark is somewhat unique in that it has an entirely separate child allowance for single parents (including an additional payment for the parent who children live with) rather than a more generous child benefit payment. Moreover, Denmark has combined support through the social security system with policies to incentivise single parents into the labour market through childcare discounts and a higher personal tax allowance than other workers. Since the introduction of this higher personal tax allowance in 2011, employment rates of single parents in Denmark have increased by around ten percentage points.[54]
Finland also has a state-supported child maintenance system which pays a top-up to single-parent families without sufficient support from a liable parent. In Denmark, the state can provide an advance on child support in circumstances where the liable parents do not pay (and the state then seeks to recover from the liable parent). In Scotland, the system which is set up at UK level and operated by the Child Maintenance Service (CMS) does not provide financial support to single parents where child maintenance arrangements are not kept to, but can take legal action to recover arrears. CMS’s enforcement of this has been noted by the Work and Pensions Select Committee as ‘ineffective and slow’ and contributes to high child poverty rates in separated parents.[55]
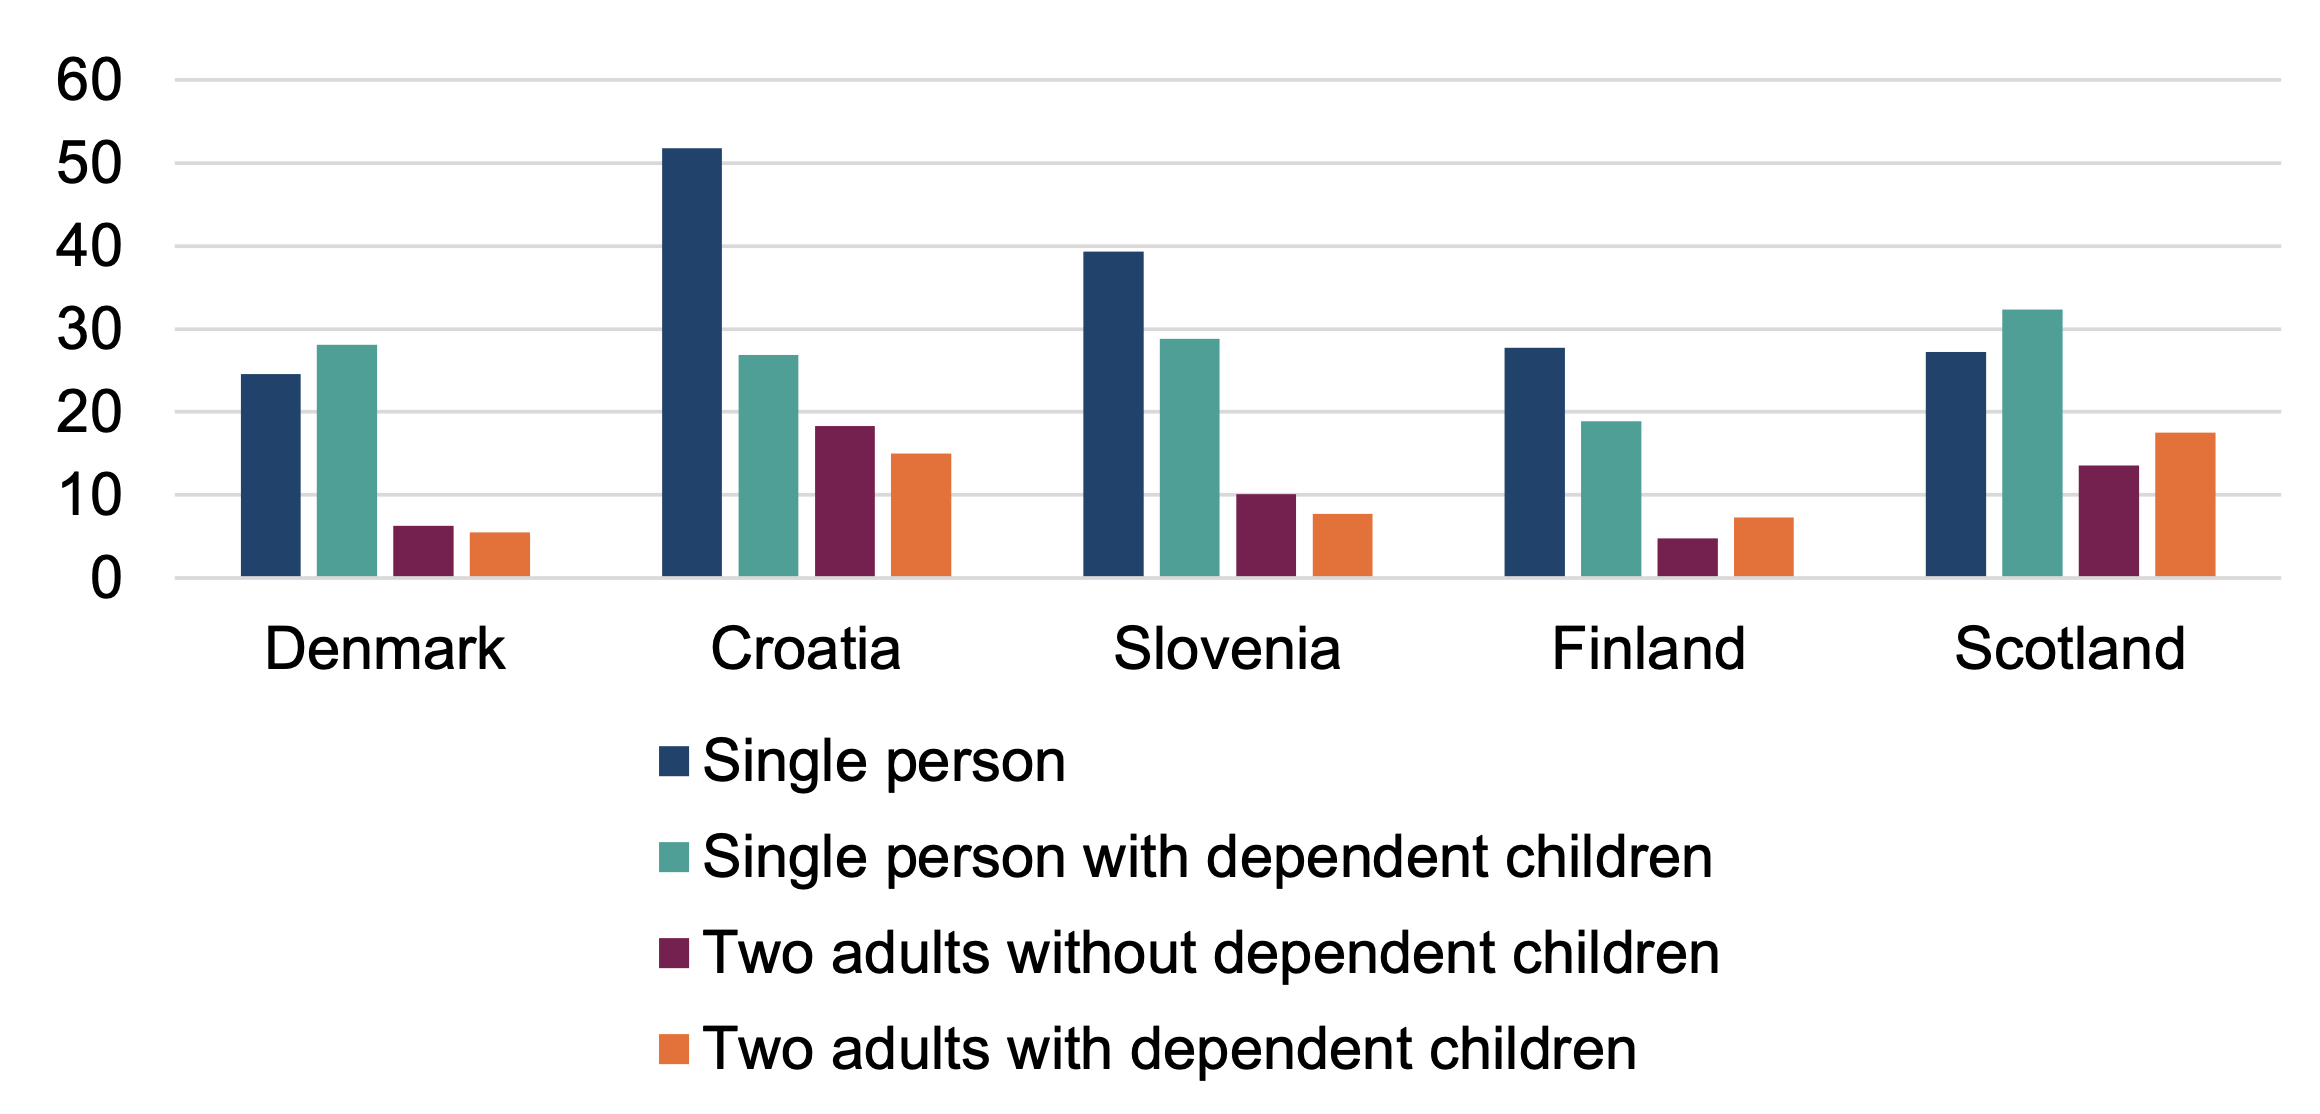
Source: Eurostat, At-risk-of-poverty rate by poverty threshold and household type, 2024 (ilc_li03); Poverty and Income Inequality in Scotland National Statistics, 2025 (three-year averages, 2021-2024)
Common across Scotland and the case study countries is that poverty rates are higher for larger families (three or more children) than for families with fewer children. Figure 4 shows that in Scotland 39.5% of large families were in poverty in 2021-24 – significantly higher than the case study countries, with Croatia the closest comparator with a large family poverty rate of 23.5% in 2024. The higher poverty rate amongst larger families in Scotland is in part a result of the UK Government’s decision to introduce a two-child limit on means-tested benefits since 2017. The Scottish Government announced in the 2025/26 Budget plans to mitigate the impact of the two-child limit,[56] and has also introduced a Scottish Child Payment in 2021 which provides additional per child support for low-income families.[57]
None of the case study countries restrict social security payments based on the number of children, and child benefits in Croatia, Finland and Slovenia increase in value the more children there are in a family. In addition, Slovenia has a targeted large-family allowance for low-income families with more than three children, and Finland applies higher housing allowance limits for large families. These policy choices are designed to recognise the additional costs faced by large families. Denmark did implement a cap on child benefit payments in 2011 that de facto operated a two-child limit, but this was scrapped after only a year due to the disproportionate impact on larger families.[58]
In 2024, Denmark has the lowest poverty rates for one child (2%) and three or more children (11%) families, and Finland for two children (5%) families. Denmark’s comparative low poverty rate amongst larger families is particularly interesting given Denmark’s mixed policy landscape in terms of support offered to larger families. Families with more than one child receive additional discounts on childcare support, but the benefit ceiling within Denmark’s social assistance system specifically impacts larger families and a child subsidy was introduced to offset the impact on these families.[59]
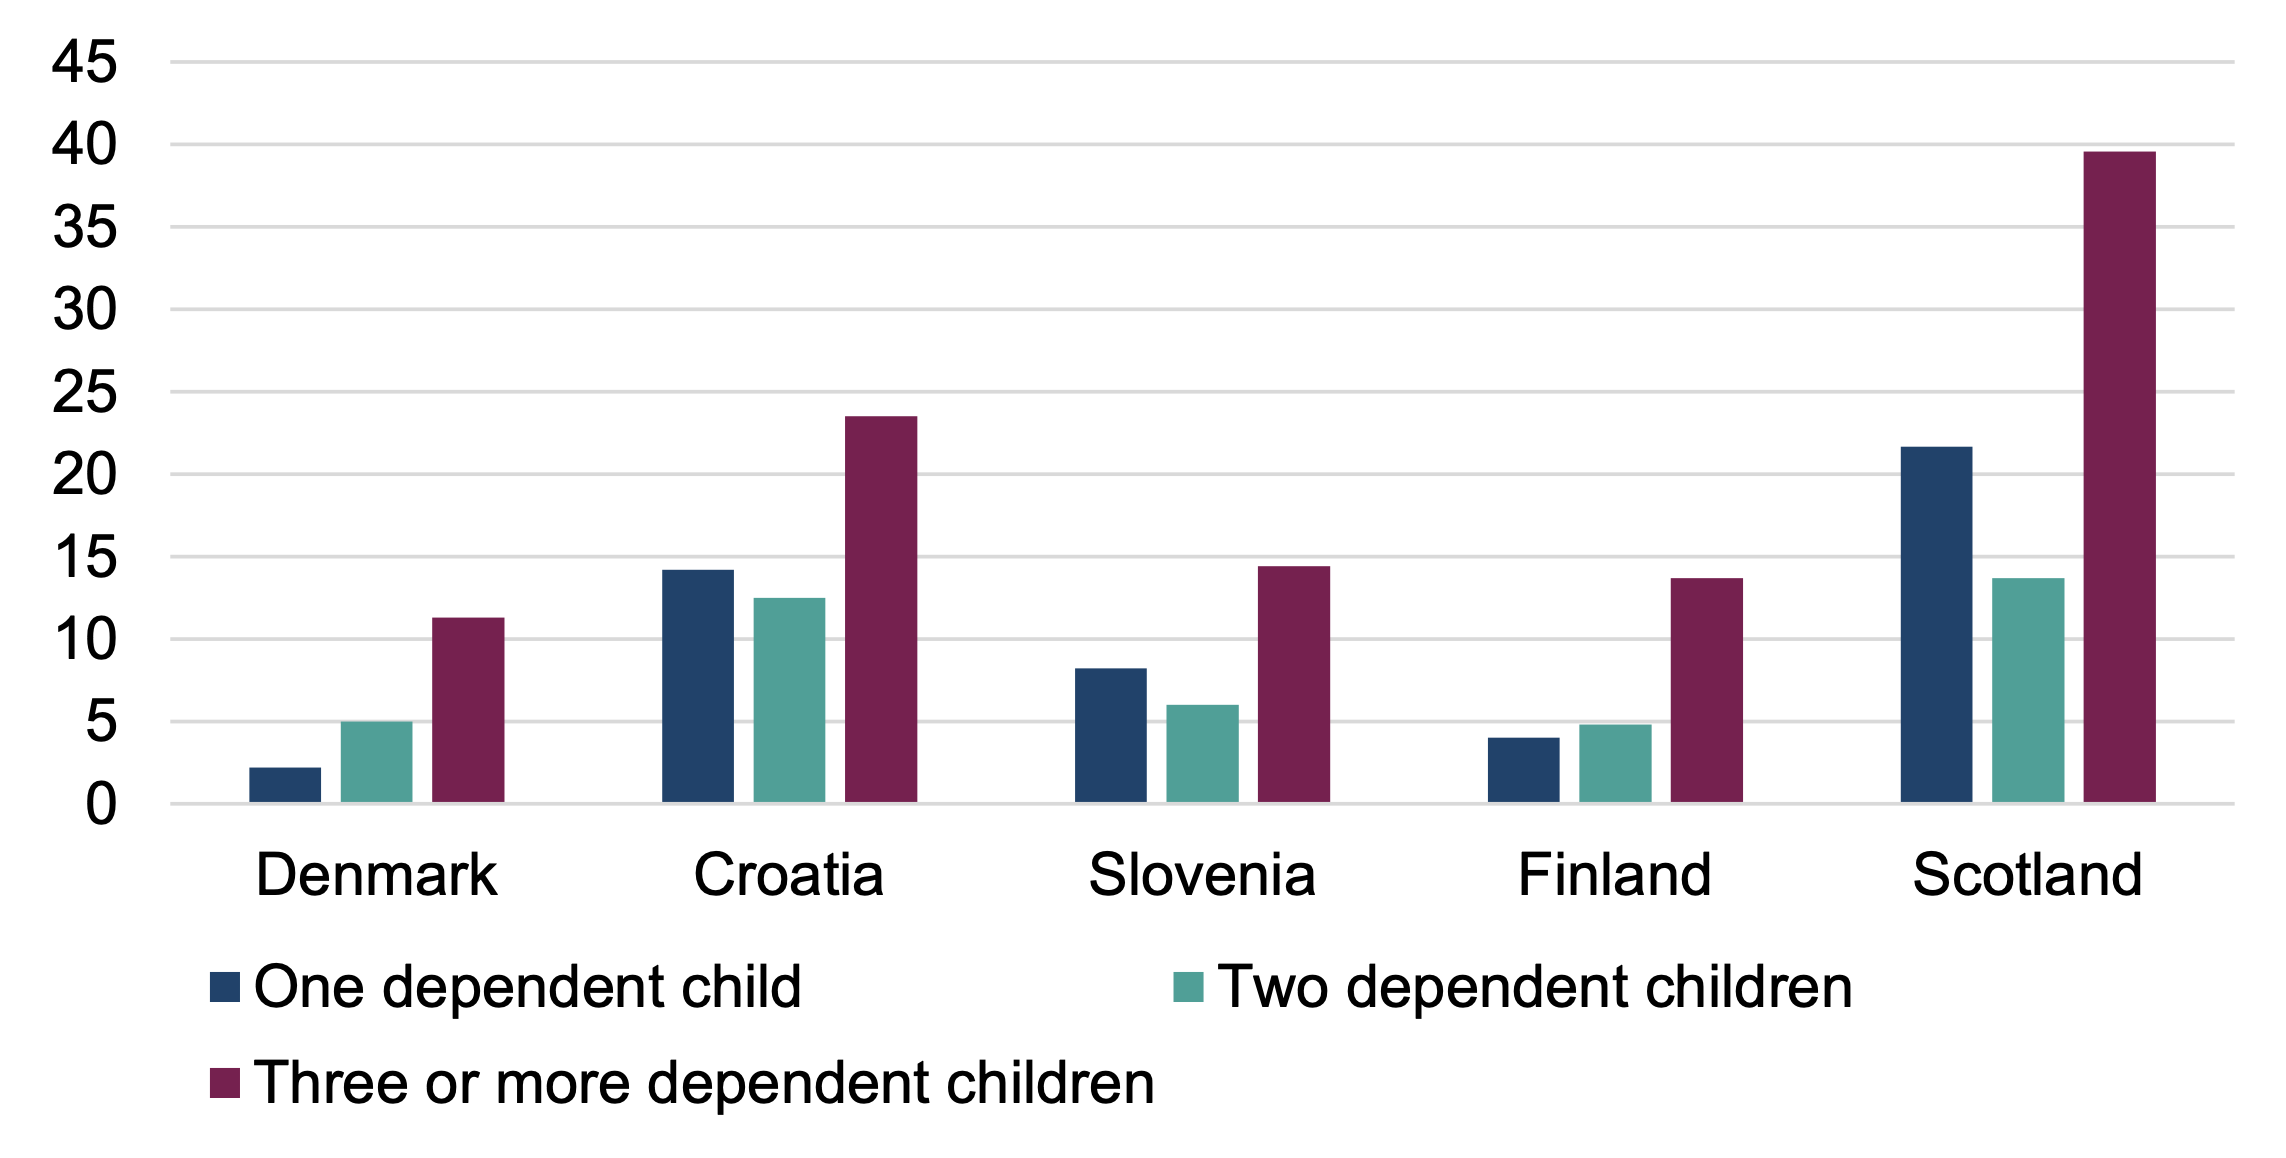
Source: Eurostat, At-risk-of-poverty rate by poverty threshold and household type, 2024 (ilc_li03); Poverty and Income Inequality in Scotland National Statistics, 2025 (three-year averages, 2021-2024)
In general, as Figure 5 shows, poverty rates are broadly similar across the age range of children. This shows the importance of ensuring support is provided to parents across a child’s life course. In 2021-24, Scotland saw higher poverty rates across all age ranges than the case study countries (albeit on slightly different age groupings). Across the case study countries and Scotland, younger children (under 6) had slightly lower poverty rates than teenagers. The especially low rate of poverty amongst young children in Denmark (9%), Finland (12%) and Slovenia (11%) could be linked to the affordable and widely available childcare provision in these countries. An additional factor in Denmark and Finland is that child benefit payments are more generous for younger children.
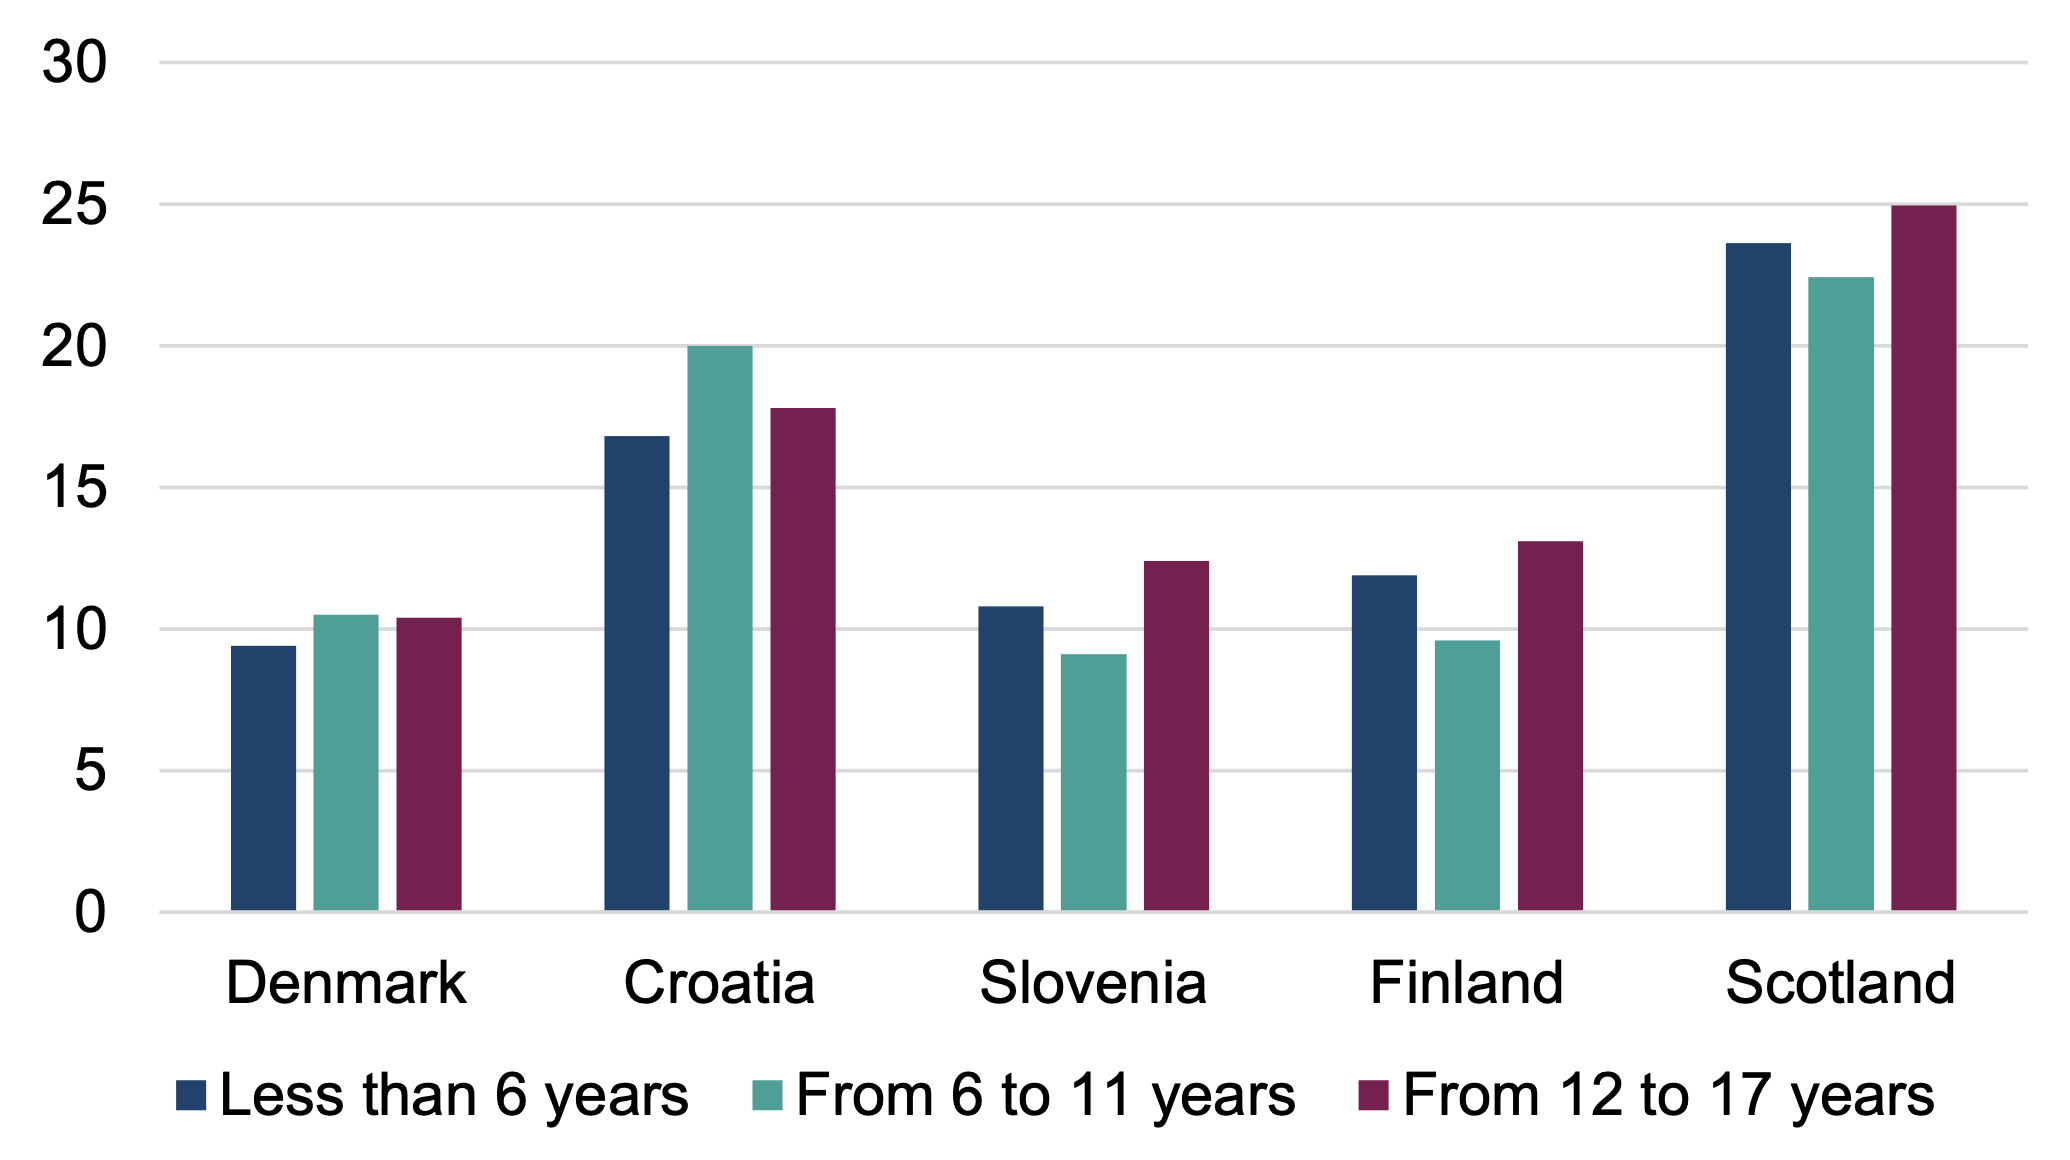
Sources: Eurostat, At-risk-of-poverty rate by poverty threshold, age and sex, 2024 (ilc_li02); Poverty and Income Inequality in Scotland National Statistics report, 2025 (three-year averages, 2021-2024)
Case study countries do not report data on ethnicity. Instead, they look at country of origin. Across the case study countries, in 2024 children of parents who were born abroad are more likely to live in poverty. As Figure 6 shows, at least a fifth of children of foreign-born parents live in poverty in Denmark, Finland and Slovenia – and over a quarter (28%) in Croatia. Croatia and Finland have the smallest gap between foreign-born and reporting country-born parents at 12 percentage points – but this is a result of higher poverty rates amongst reporting country-born parents than Denmark and Slovenia. Comparative data for Scotland is not available, however research by the IPPR found that in 2022/23 almost half (46%) of children in families with parents born outside of the UK are in poverty, compared to a quarter of children of UK-born parents.[60] Strikingly, the child poverty rate amongst foreign-born parents in the UK is over double the rates in Slovenia, Denmark and Finland.
In Scotland, the ethnicity of the parent is captured rather than where a parent was born. In 2021-24, AHC child poverty rates for households with parents from a minority ethnic background (including white minorities) are 17 percentage points higher than white British households: 37% compared to 20%.[61]
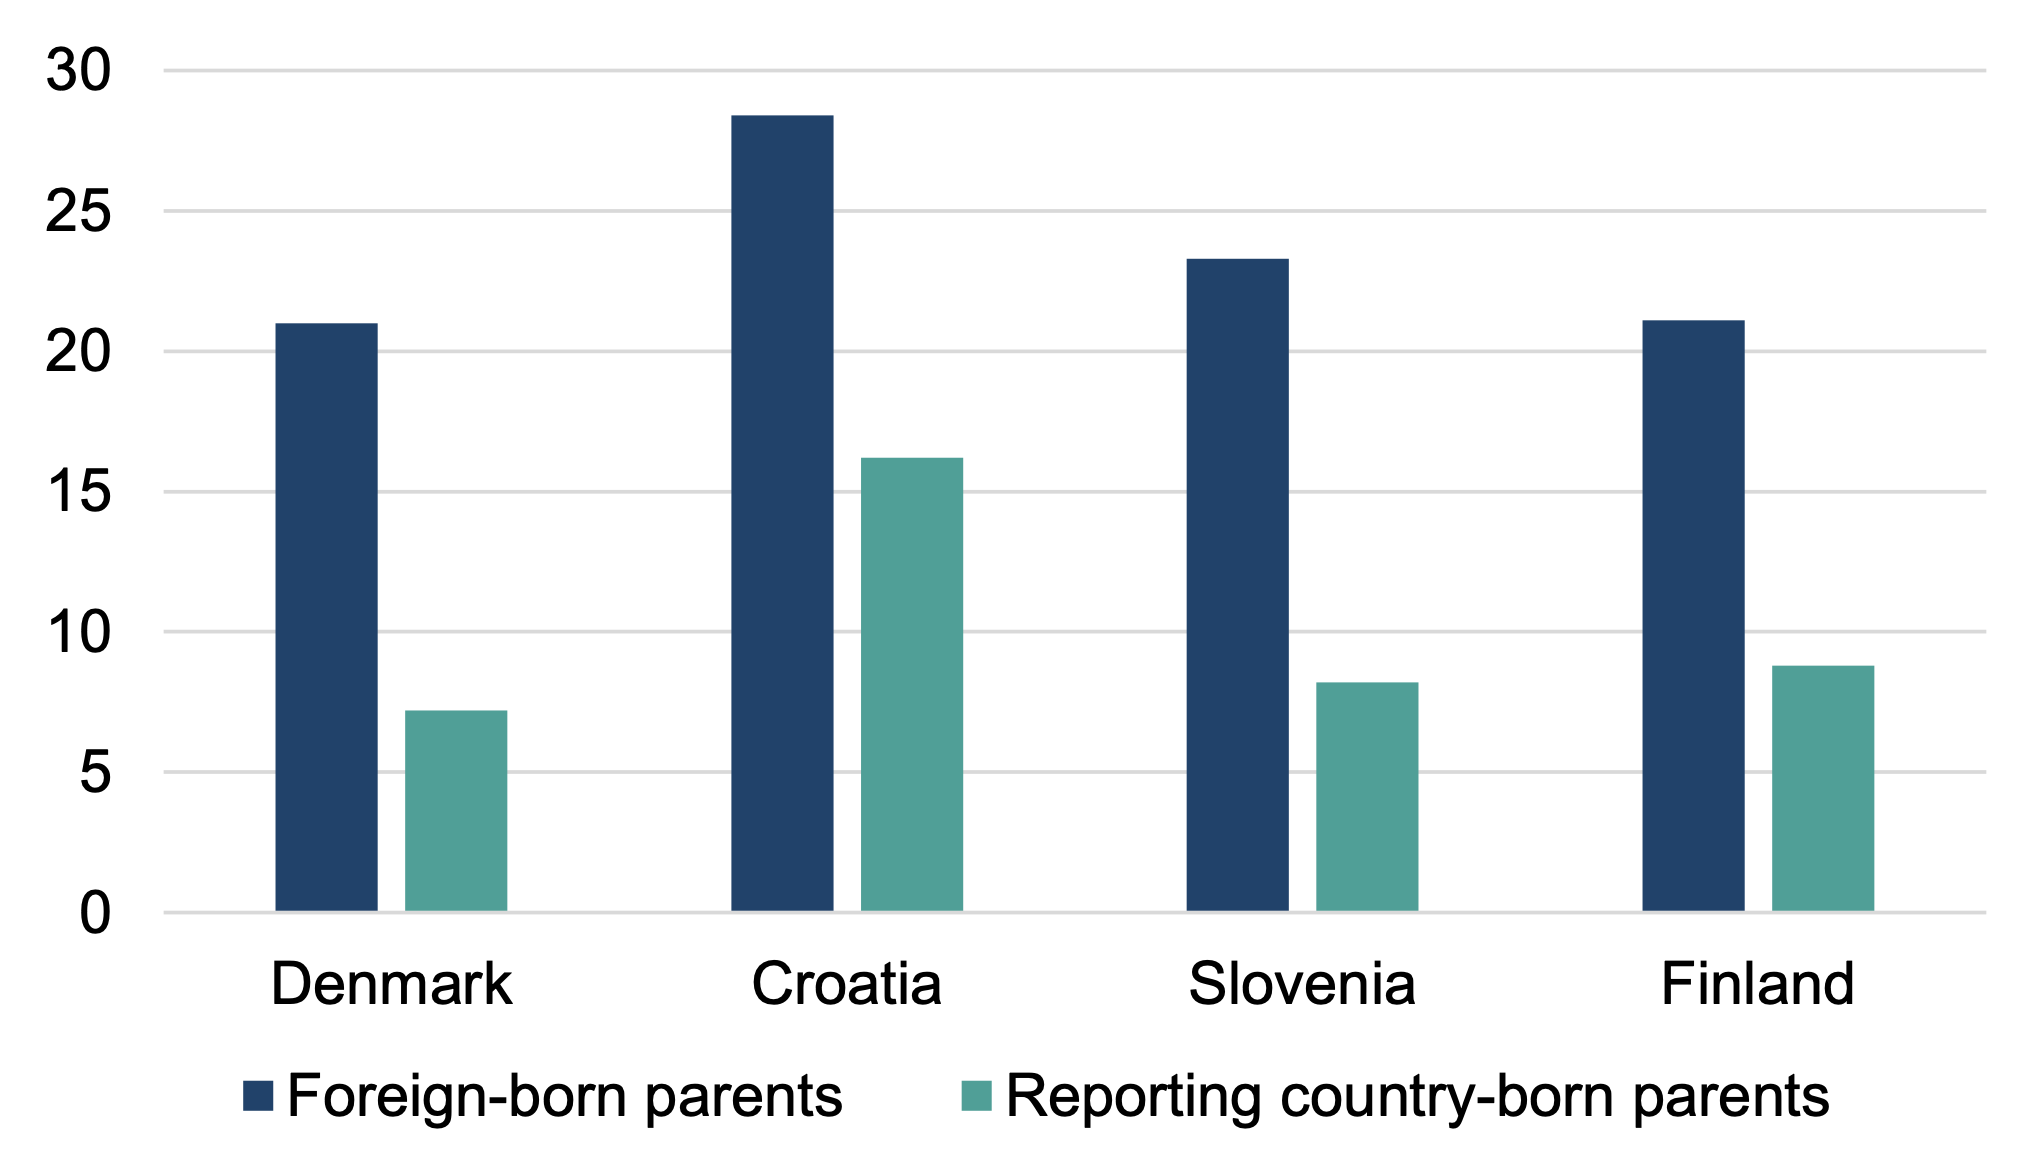
Source: Eurostat, At-risk-of poverty rate for children by country of birth of their parents, 2024 (ilc_li34)
In Scotland, we see that families where someone is disabled are at higher risk of being in poverty. This is also the case across all case study countries (see Figure 7). In Denmark and Slovenia, the BHC poverty gap between disabled households and non-disabled households is relatively small (six or seven percentage points), and is broadly comparable to Scotland’s AHC disability poverty gap (seven percentage points). In Croatia, the poverty rate of households where someone has a disability (30%) is almost three times the rate of non-disabled households (12%).
Data on whether a disabled person is a child is not readily available across the comparator countries, but in Scotland in 2021-24, households containing a disabled child had a lower AHC poverty rate than households without disabled children – 17% compared to 20%.[62]
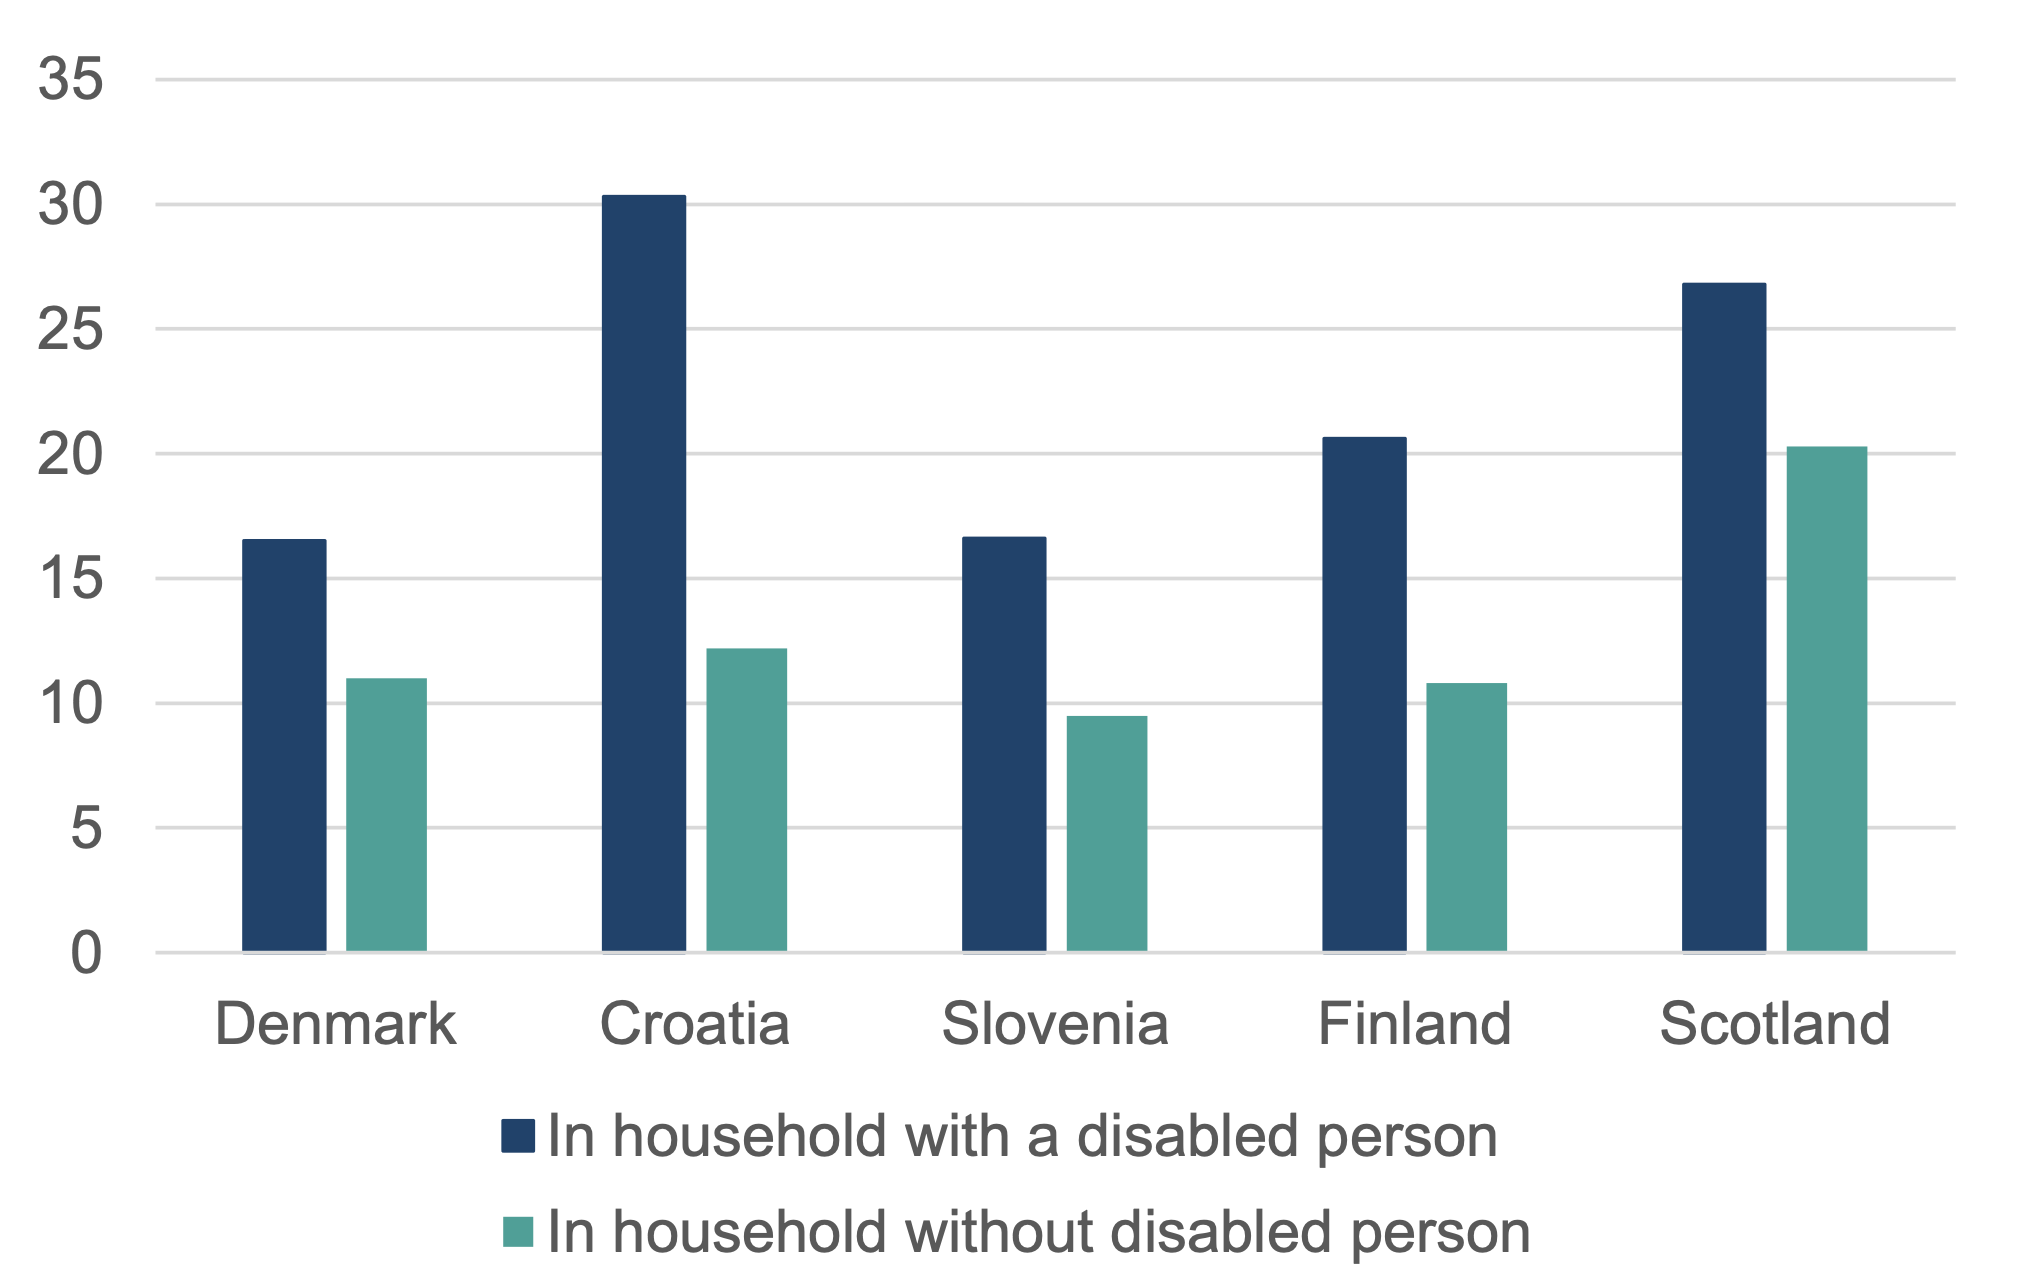
Source: Eurostat, Persons at risk of poverty by level of disability (activity limitation), sex and age, 2024 (hlth_dpe020); Poverty and Income Inequality in Scotland National Statistics report, 2025 (three-year averages, 2021-2024)
Inequality trends
Here we compare income and gender equality in each country. These measures matter for child poverty in different ways. Firstly, income equality can help reduce poverty levels when measured by a relative measure, as more of the population will have incomes near the median income – making it less likely people will be below the poverty threshold when set as a percentage of the median income. Secondly, greater before-transfers income equality can also reduce the amount of redistribution needed from the welfare system to bring families out of poverty. For example, this is the case in Slovenia, where a high minimum wage creates a large number of people who earn at – or close to – the median wage, reducing inequality.
The most common measure of income equality, the Gini coefficient, calculates the degree of inequality in the distribution of income or wealth within a population. Another measure of income inequality is the Palma index which measures the income share of the richest 10% to the income of the poorest 40%.
Scotland has higher levels of income inequality than the four case study countries on both measures, as shown in Table 4. In the context of Denmark and Finland this is influenced by a high priority being placed on redistribution within their tax and transfer systems because of their Nordic social model, but also lower inequality before transfers. As a result, Scotland’s tax and social security system achieves a similar level of poverty reduction (from 41.1% before-transfers to 23.5% after-transfers),[63] but child poverty is lower in these countries because the before-transfer poverty levels are lower, in part because of greater income equality.
Secondly, as discussed in the case studies, female labour market participation is an important factor of reduced child poverty in all of the case study countries. While the economic context plays a role in the level of female employment, policies like parental leave and childcare provision are also highly influential. For example, Denmark has the highest levels of gender equality, as measured by the European Institute for Gender Equality’s Index. Denmark performs especially well on gender equality in earnings and full-time working, which reflects broad cultural norms and policy development since the 1960s. This data source does not include Scotland. However, the Scottish Government has produced its own Gender Index based on the European model of assessment, but with national data sources. From Scottish Government figures, the gender index score is on a par with Denmark. It is notable that gender equality in Croatia is more than ten points below the other countries. Croatia does not have well-established or state-supported childcare provision, although informal family caring arrangements help support labour market participation.
| Scotland | Croatia | Denmark | Finland | Slovenia | |
|---|---|---|---|---|---|
| Palma ratio | 1.23[64] | 1.1[65] | 1.05[66] | 1. 0[67] | 0.8[68] |
| Gini coefficient | 32%[69] | 29.8%[70] | 28.6%[71] | 26.1%[72] | 23.8%[73] |
| Gender equality index | 79[74] | 59.7[75] | 78.8[76] | 74.4[77] | 70.1[78] |
Labour market trends
Employment and unemployment rates
In 2024, Denmark had the highest employment rates amongst the comparator countries at 77%, and Scotland, Finland and Slovenia had broadly similar employment rates of around 73%. Figure 8 shows that employment rates have increased across the case study countries since 2009, whereas employment rates in Scotland have been relatively stable (between 71-75%). It is notable that between 2013 and 2018, Scotland had higher employer rates than all of the comparator countries.
The largest increase in employment rates has been seen in Croatia, increasing by nine percentage points from 59% in 2009 to 68% in 2024. Croatia and Slovenia’s increase in employment has coincided with their significant reductions in child poverty rates, suggesting the importance of increasing employment rates – especially amongst women – in reducing child poverty. Across the fifteen-year period, Croatia and Slovenia have seen a respective thirteen and ten percentage point increase in female employment rates.[79] Despite this increase in female employment rates, Croatia and Slovenia have the largest gender employment gap of the case study countries at around seven percentage points. This gender employment gap is also evident in Scotland.[80]
Employment rates for women and men have followed the same trend as overall employment rates, although women’s employment has consistently been at lower levels than men’s in Scotland and most of the case study countries. The notable exception is Finland, where since 2021 employment rates for women and men have converged significantly – indeed, reaching parity in 2023 at 74%.[81] Finland has a strong cultural norm for dual breadwinner households, and this is also supported by policies like state-subsidised childcare, before/after school activities and shared parental leave.
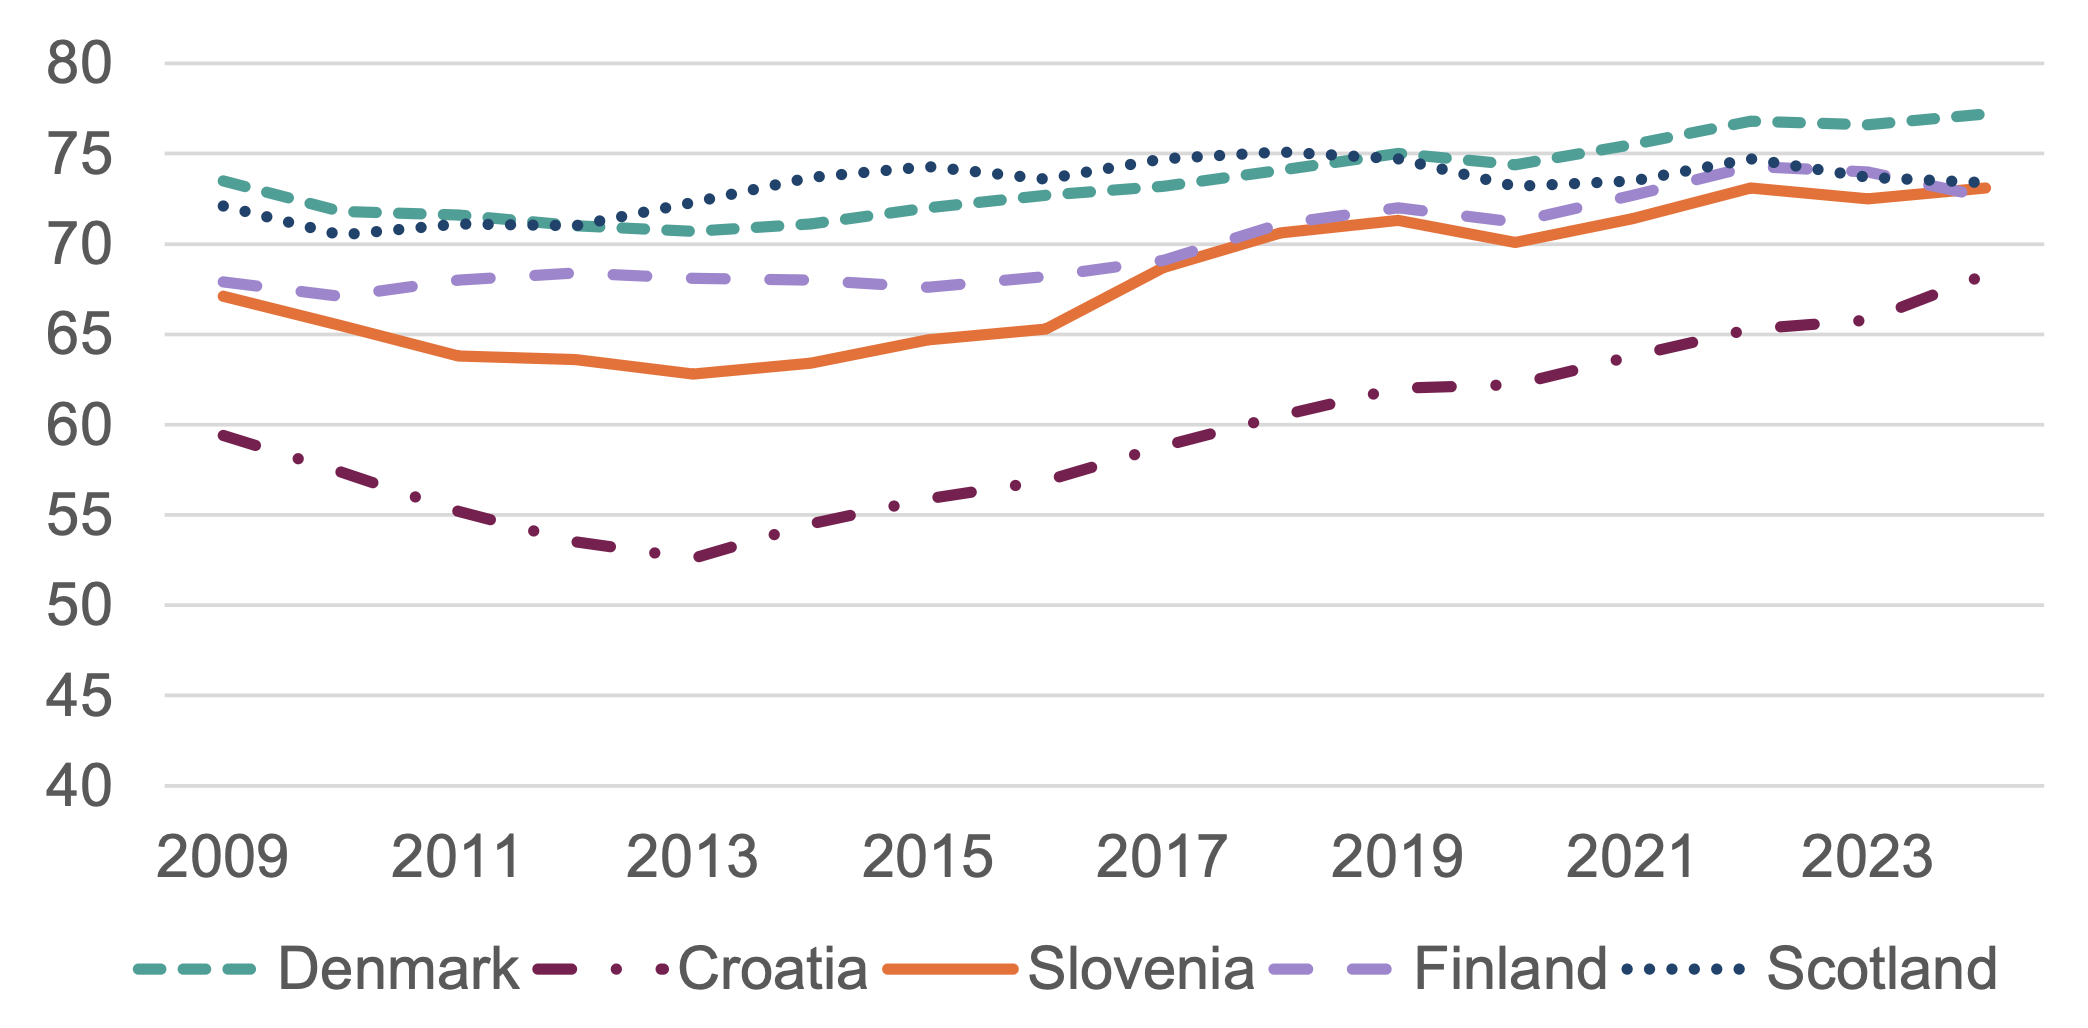
Source: Eurostat, Employment and activity by sex and age - annual data, 2009-2024 (lfsi_emp_a); Office for National Statistics / Labour Force Survey, ILO employment rate (Scotland), 2009-2024
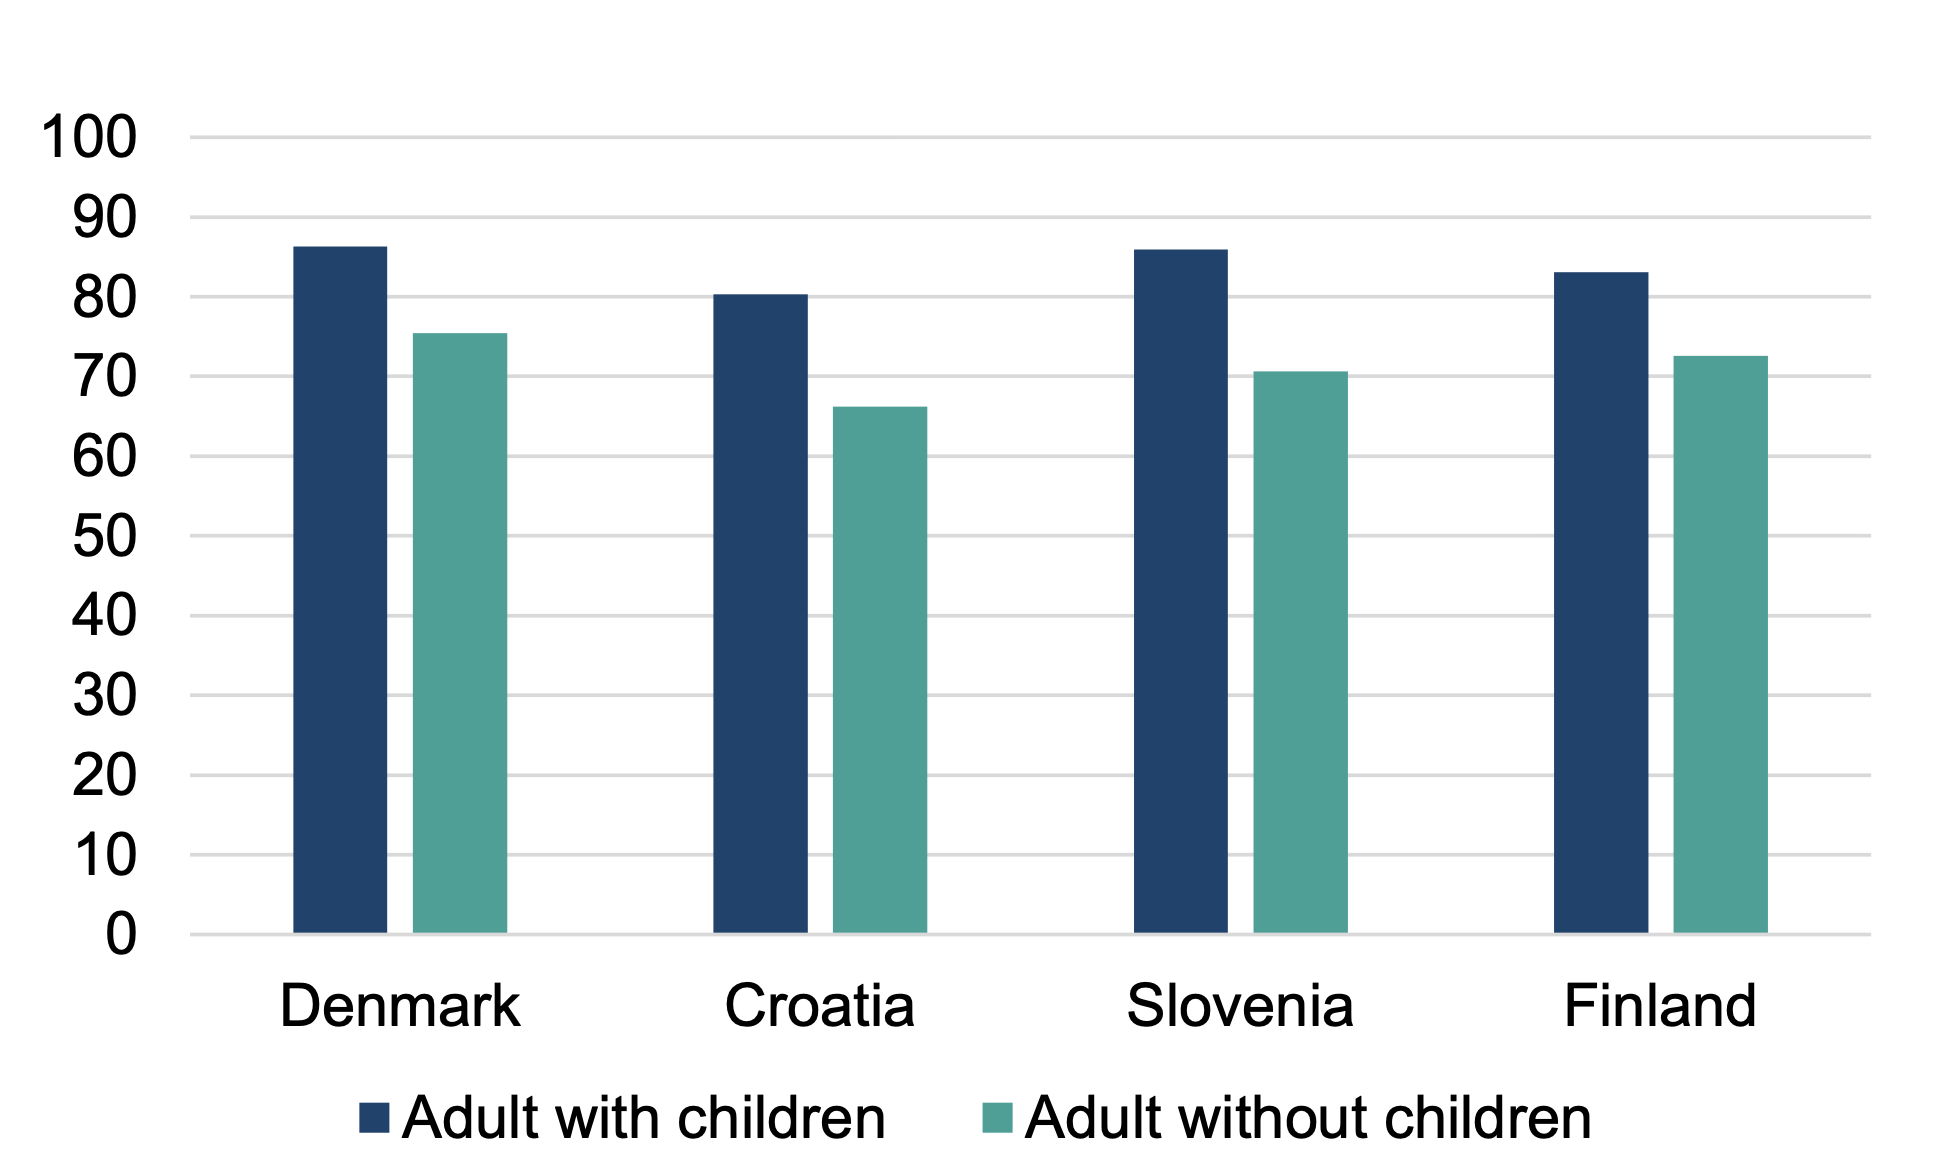
Across the case study countries, parents have a consistently higher employment rate than non-parents. As Figure 9 shows, in 2024 the employment rates for parents of working-age are at or above 80%, at least ten percentage points higher than working-age adults without children. Croatia has the lowest rates of employment amongst parents and those without children compared to the other case study countries.
Comparable data for Scotland is not available, with employment data broken down by parental status and gender. In 2024, the employment rate for fathers (93%) was around twenty-three percentage points higher than men without children (70%), and the employment rate for mothers (80%) was around fifteen percentage points higher than women without children (65%).[82]
Research has suggested that parental employment rates are often higher as parents are more likely to take advantage of employment practices that better support work-life balance (such as job sharing, part-time work, flexi-time) and benefit from the provision of paid and unpaid leave entitlements (parental leave and career break and financial assistance (childcare, maternity and paternity pay).[83]
Source: Eurostat, Employment rate by sex, age groups, educational attainment level and household composition, 2024 (lfst_hheredty)
In 2024, of the comparator countries only Slovenia (3%) had a lower unemployment rate than Scotland (4%). Indeed, as Figure 10 shows, Scotland’s unemployment rate has been consistently lower than most of the comparator countries since 2013. Croatia has seen the largest fluctuations in unemployment, increasing significantly between 2009 and 2014, followed by a significant reduction in the decade to 2024. Unemployment has been consistently higher for men than women in Scotland and Finland, with a more mixed picture in Croatia, Denmark and Slovenia.[84]
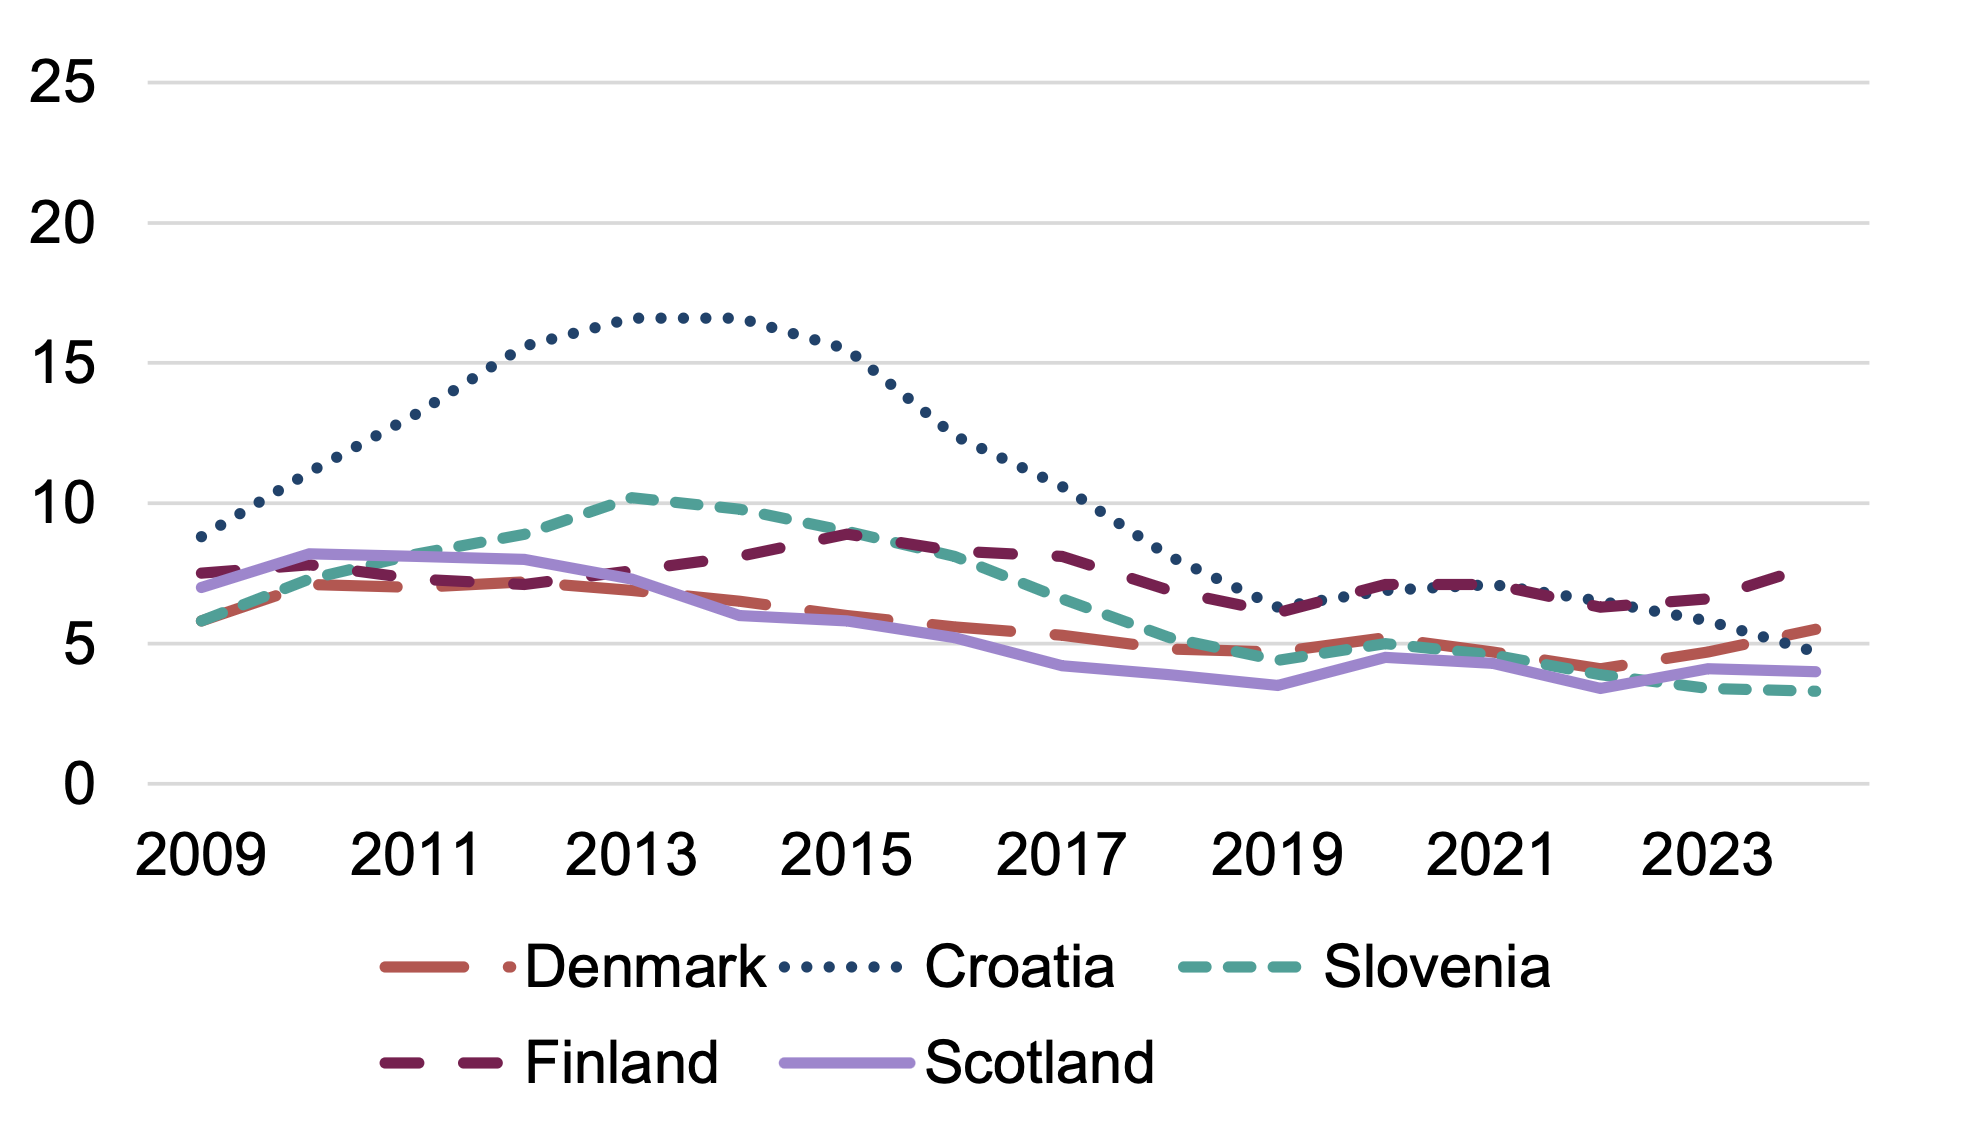
Source: Eurostat, Unemployment by sex and age - annual data (une_rt_a), 2009-2024; Office for National Statistics / Labour Force Survey, ILO unemployment rate (Scotland), 2009-2024
Part-time working
Non-parents are more likely to work part-time than parents across all of the case study countries. There is a significant gender divide in part-time working, with women – both those with and without children – more likely to work part-time than men. These vary significantly across the case study countries, with 31% of mothers and 39% of women without children working part-time in Denmark compared to 4% of both mothers and women without children working part-time in Croatia.[85]
Regardless of gender and family type, working part-time is much less common in Croatia and Slovenia than in Denmark and Finland (See Figure 11). This is particularly interesting given the cultural importance of full-time, dual earning couples (irrespective of children) in Denmark and Finland.
Comparable data broken down by parental status is not available for Scotland, but in July 2023 to June 2024 an estimated 26% of working-age adults worked part-time in Scotland, with a higher proportion of women working part-time compared to men (39% compared to 13%).[86]
Source: Eurostat, Percentage of part-time employment by sex, age groups and household composition, 2024 (lfst_hhptety)
Working full-time significantly reduces the risk of in-work poverty, and this is evident across Scotland and the case study countries. In-work poverty is significantly higher for part-time workers than full-time workers (see Figure 12). Despite part-time work making up only a small percentage of the Croatian labour market and the lowest of the case study countries (see Figure 11), the in-work poverty rate amongst part-time workers in Croatia is the highest of the case study countries. In Scotland, almost a third (32%) of part-time workers are in in-work poverty compared to just 4% of full-time workers in 2021-24. For part-time workers with children in Scotland, this rises to 44%.[87] Previous Scottish Government research has highlighted that part-time work in Scotland is more likely to be lower paid and precarious than full-time work, which greatly increases the risk of in-work poverty.[88]
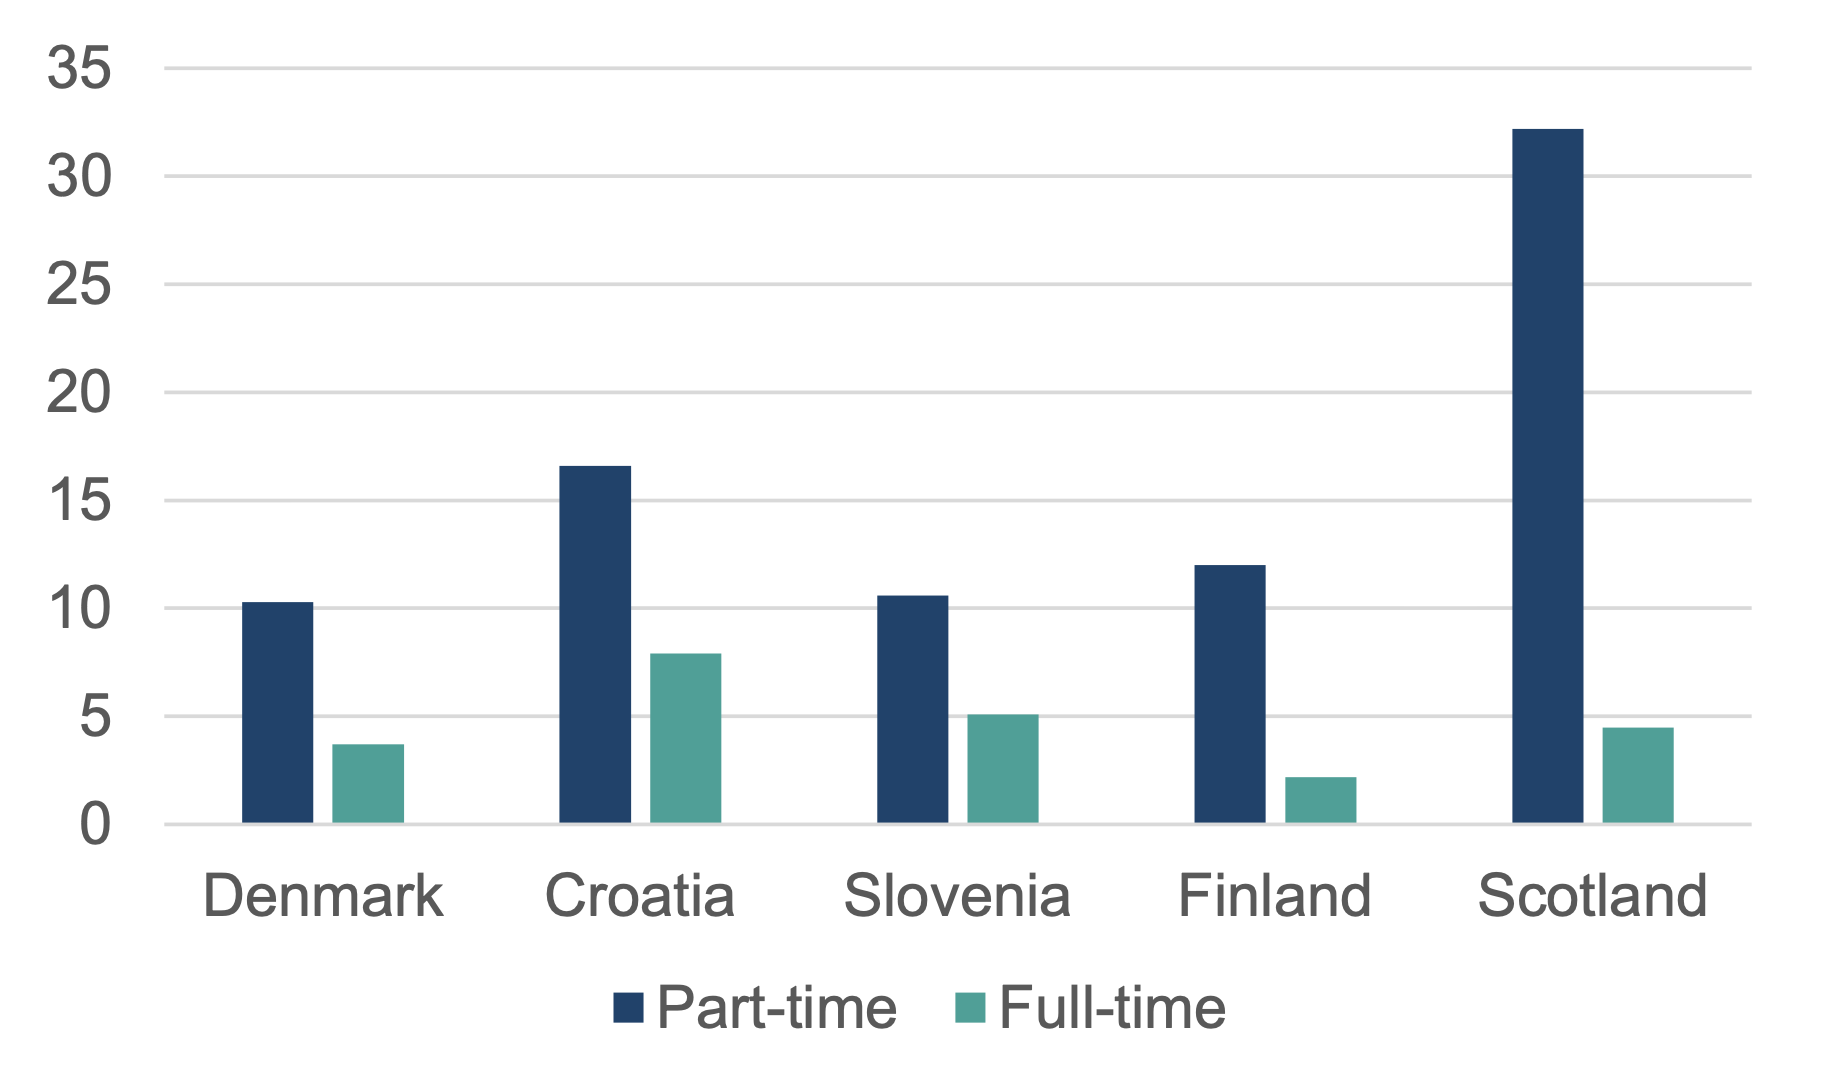
Source: Eurostat, In-work at-risk-of-poverty rate by full-/part-time work, 2024 (ilc_iw07); Poverty and Income Inequality in Scotland National Statistics report, 2025 (three-year averages, 2021-2024)
Work intensity
EU-SILC data defined work intensity as the ratio of the total number of months that all working-age household members have worked during a year and the total number of months the same household members theoretically could have worked in the same period. Work intensity is then expressed in levels, ranging from very low (household working time was equal to or less than 20% of the full potential) to very high (working time was more than 85% of the full potential).[89]
Very few working-age adults with children have the lowest levels of work intensity (less than 20% of a households full working potential) in the case study countries. Figure 13 shows that the presence of dependent children appears to have an impact on increasing work intensity. In Croatia, Finland and Slovenia, low levels of work intensity are five percentage points lower amongst parents than non-parents. The impact is especially pronounced amongst Danish parents, with levels of low work intensity thirteen percentage points lower than non-parents. Of particular importance here is Denmark’s affordable and generous childcare system (discussed in more detail below and in the case study report) that allows parents of especially younger children to increase their work intensity.
Comparable data using the same methodology as EU-SILC data is not available for Scotland or the UK. However, Scottish Government analysis from 2019 found that half of all working-age households in Scotland were classified as low work intensity on a definition of working less than 30 hours a week per working-age adult in a household.[90]
Source: Eurostat, People living in households with very low work intensity by income quintile and household type - population aged 0 to 64 years, 2024 (ilc_lvhl13n)
Across the case study countries there is a common trend that parents’ working intensity has a significant impact on child poverty rates. As Figure 14 shows, child poverty rates in 2024 are lower in families with higher work intensities. In Slovenia, over half (55%) of children are in poverty in a family with the lowest work intensity. Comparable data for Scotland is not available, but analysis by the Health Foundation shows that in 2022/23 46% of families with children in the UK with low work intensity were in poverty compared to 17% of high work intensity families.[91] This means that the UK’s poverty rate for low work intensity households with children is broadly in line with Croatia. Moreover, 2019 Scottish Government analysis found that of households in in-work poverty, almost 80% were low work intensity households (defined as working less than 30 hours a week per working-age adult in a household). This analysis concluded that this is likely to be a result of households in in-work poverty being more likely to have children, which presents additional barriers to all adults in the household working or working full-time.[92]
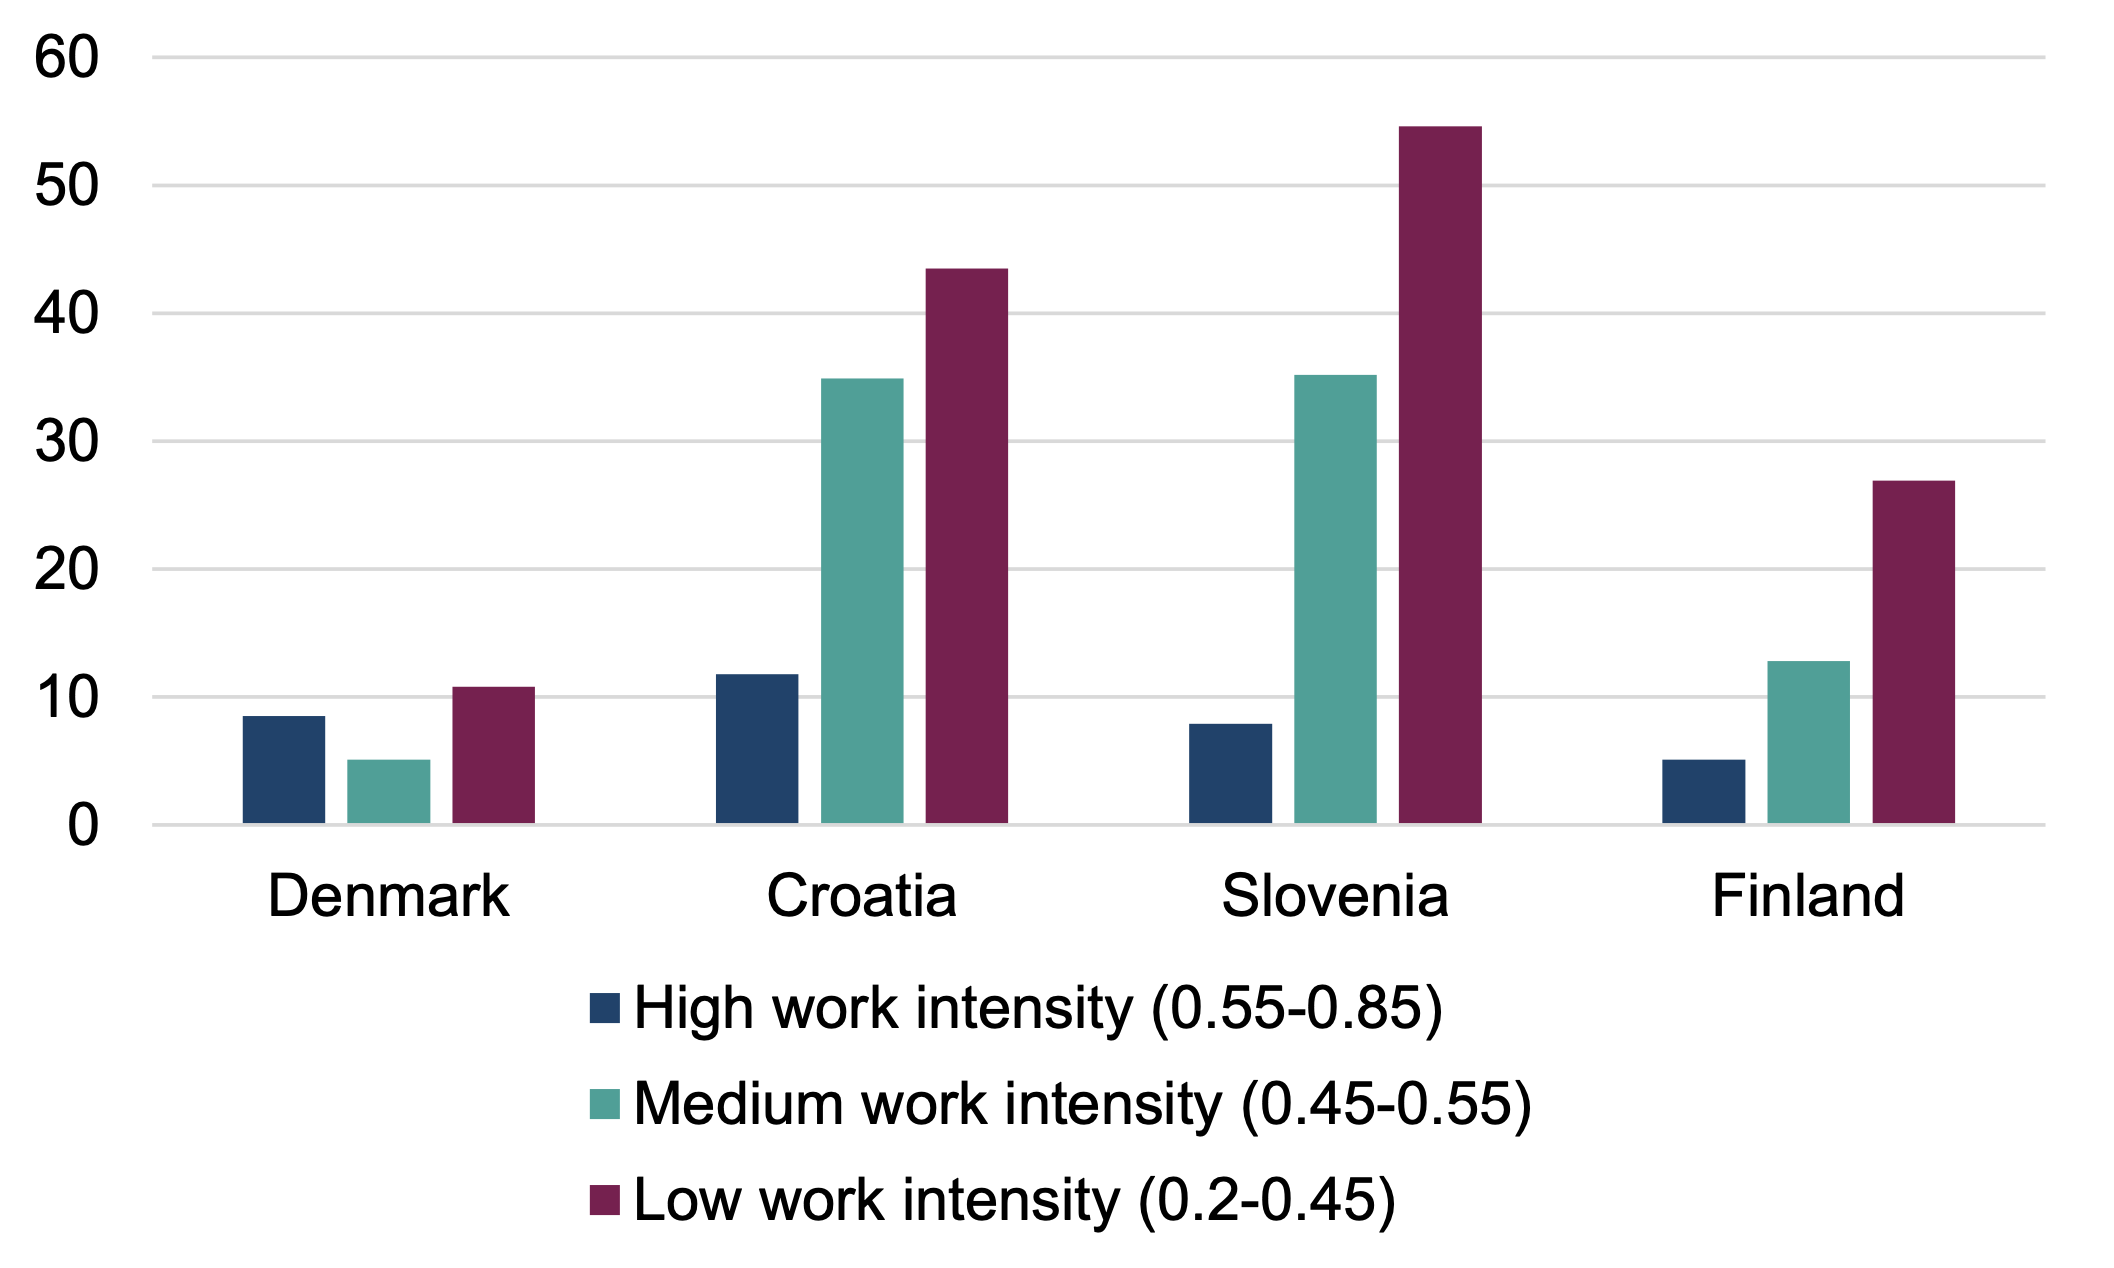
Source: At-risk-of-poverty rate by poverty threshold, work intensity of the household and broad age groups, 2024 (ilc_li06)
Hours and earnings
The hours a parent can work will have a significant bearing on the likelihood of their family being in poverty. Quantitative analysis undertaken by Alliance for Microsimulation and Policy Analysis CIC on behalf of the Scottish Government for this international review has found that, across Scotland and the case study countries, a couple with children is likely to work considerably longer hours than single parents and households without a dependent child (see Table 5). As we have seen, this is linked to parents being more likely to have higher overall employment rates and higher rates of full-time time and working intensity.
Additionally, there is a marked increase in a family’s working hours with older children (see Table 6). However, this includes the work that may be undertaken by these older children. Therefore, when looking at families with children under 13 years, Croatia and Denmark see a higher rate for families with the youngest children (0-2 years) whereas Finland, Slovenia and Scotland see higher working hours for those with children aged 7-13 years.
What is notable is that, across family types and ages of children, Scottish parents work considerably fewer hours than parents in the case study countries.
| Croatia | Denmark | Finland | Slovenia | Scotland | UK | |
|---|---|---|---|---|---|---|
| 1 adult, 1 child | 35.4 | 37.9 | 34.8 | 41.5 | 21.8 | 19.8 |
| 1 adult, 2 children | 40.0 | 39.9 | 44.9 | 38.4 | 17.2 | 18.7 |
| 1 adult, 3+ children | 37.2 | 41.3 | 27.4 | 44.5 | 7.0 | 11.1 |
| 2 adults, 1 child | 69.1 | 75.7 | 74.1 | 77.7 | 58.8 | 61.2 |
| 2 adults, 2 children | 75.3 | 78.4 | 78.5 | 82.2 | 64.8 | 61.9 |
| 2 adults, 3+ children | 63.4 | 81.8 | 82.1 | 77.5 | 48.6 | 51.5 |
| Other | 69.5 | 54.0 | 45.5 | 73.1 | 41.3 | 46.4 |
Source: Alliance for Microsimulation and Policy Analysis CIC analysis on input data for UKMOD (UK and Scotland) and EUROMOD (Croatia, Denmark, Finland and Slovenia).
| Croatia | Denmark | Finland | Slovenia | Scotland | UK | |
|---|---|---|---|---|---|---|
| 0-2 years | 83.9 | 71.5 | 64.1 | 79.0 | 51.9 | 51.9 |
| 3-6 years | 77.6 | 69.1 | 67.3 | 76.4 | 50.2 | 51.6 |
| 7-13 years | 74.9 | 71.0 | 76.0 | 80.5 | 56.5 | 52.4 |
| 14-17 years | 78.7 | 87.1 | 89.8 | 95.9 | 58.7 | 54.5 |
Source: Alliance for Microsimulation and Policy Analysis CIC analysis on input data for UKMOD (UK and Scotland) and EUROMOD (Croatia, Denmark, Finland and Slovenia).
Turning to earnings, there is a significant variation across the case study countries. As measured by the 2022 Structure of Earnings Survey (SES), Denmark has the highest median gross hourly earnings (€29.83) amongst the case studies and in the EU, whereas Croatia has the lowest of the case studies and one of the lowest in the EU (at €6.82). Finland has a relatively high median gross earnings (€19.33), whereas Slovenia’s (€10.47) is below the EU average (€14.91).[93] The 2022 Annual Survey of Hours and Earnings (ASHE) shows that Scotland’s median hourly pay of £15 was higher than the UK average of £14.72.[94] Based on the average 2022 Sterling-Euro conversion rates, this equates to €17.33 – broadly comparable to Finland’s median gross earnings.
The proportion of low- and high-paid earners gives an insight into how earnings are distributed. The OECD defines low-paid earners as those employees earning two-thirds or less of the national median earnings, whereas high-paid earners are defined as those employees with earnings more than one-and-a-half times national median earnings.[95] As a result, the threshold that determines low-wage earners is relative and specific to each country.
That said, Table 7 shows that the UK has the highest proportion of both low- and high-paid earners, suggesting a rather wide distribution of earnings. By comparison, Denmark has some of the lowest proportions of both low- and high-paid earners in the EU and OECD, suggesting greater equality of income distribution. Finland has similar levels of low-paid earners to Denmark, but alongside Croatia and Slovenia has a significantly higher proportion of high-paid earners than Denmark. While comparable data for Scotland is not available, ASHE data for 2024 shows that an estimated 11.4% of employees in Scotland earned less than the real Living Wage.[96]
| Low-paid earners | High-paid earners | |
|---|---|---|
| Croatia | 21.4% | 18% |
| Denmark | 9.8% | 2.5% |
| Finland | 9.9% | 15.8% |
| Slovenia | 15.6% | 20.4% |
| UK | 23.5% | 23.1% |
Source: OECD, Incidence of low and high pay database, 2022 & 2023
In-work poverty
Levels of in-work poverty amongst parents are relatively low in the case study countries. Scotland’s in-work poverty and child poverty rates are higher than for the case study countries (see Figure 15 and 16). Although Scotland has comparatively high employment and low unemployment rates, the labour market participation of parents is just one factor impacting child poverty and the nature of parents’ employment is another. Available evidence discussed above suggests that the greater prevalence amongst Scottish parents of part-time working, shorter hours and low work intensities are a key contributing factor towards Scotland’s higher in-work poverty and child poverty rates.
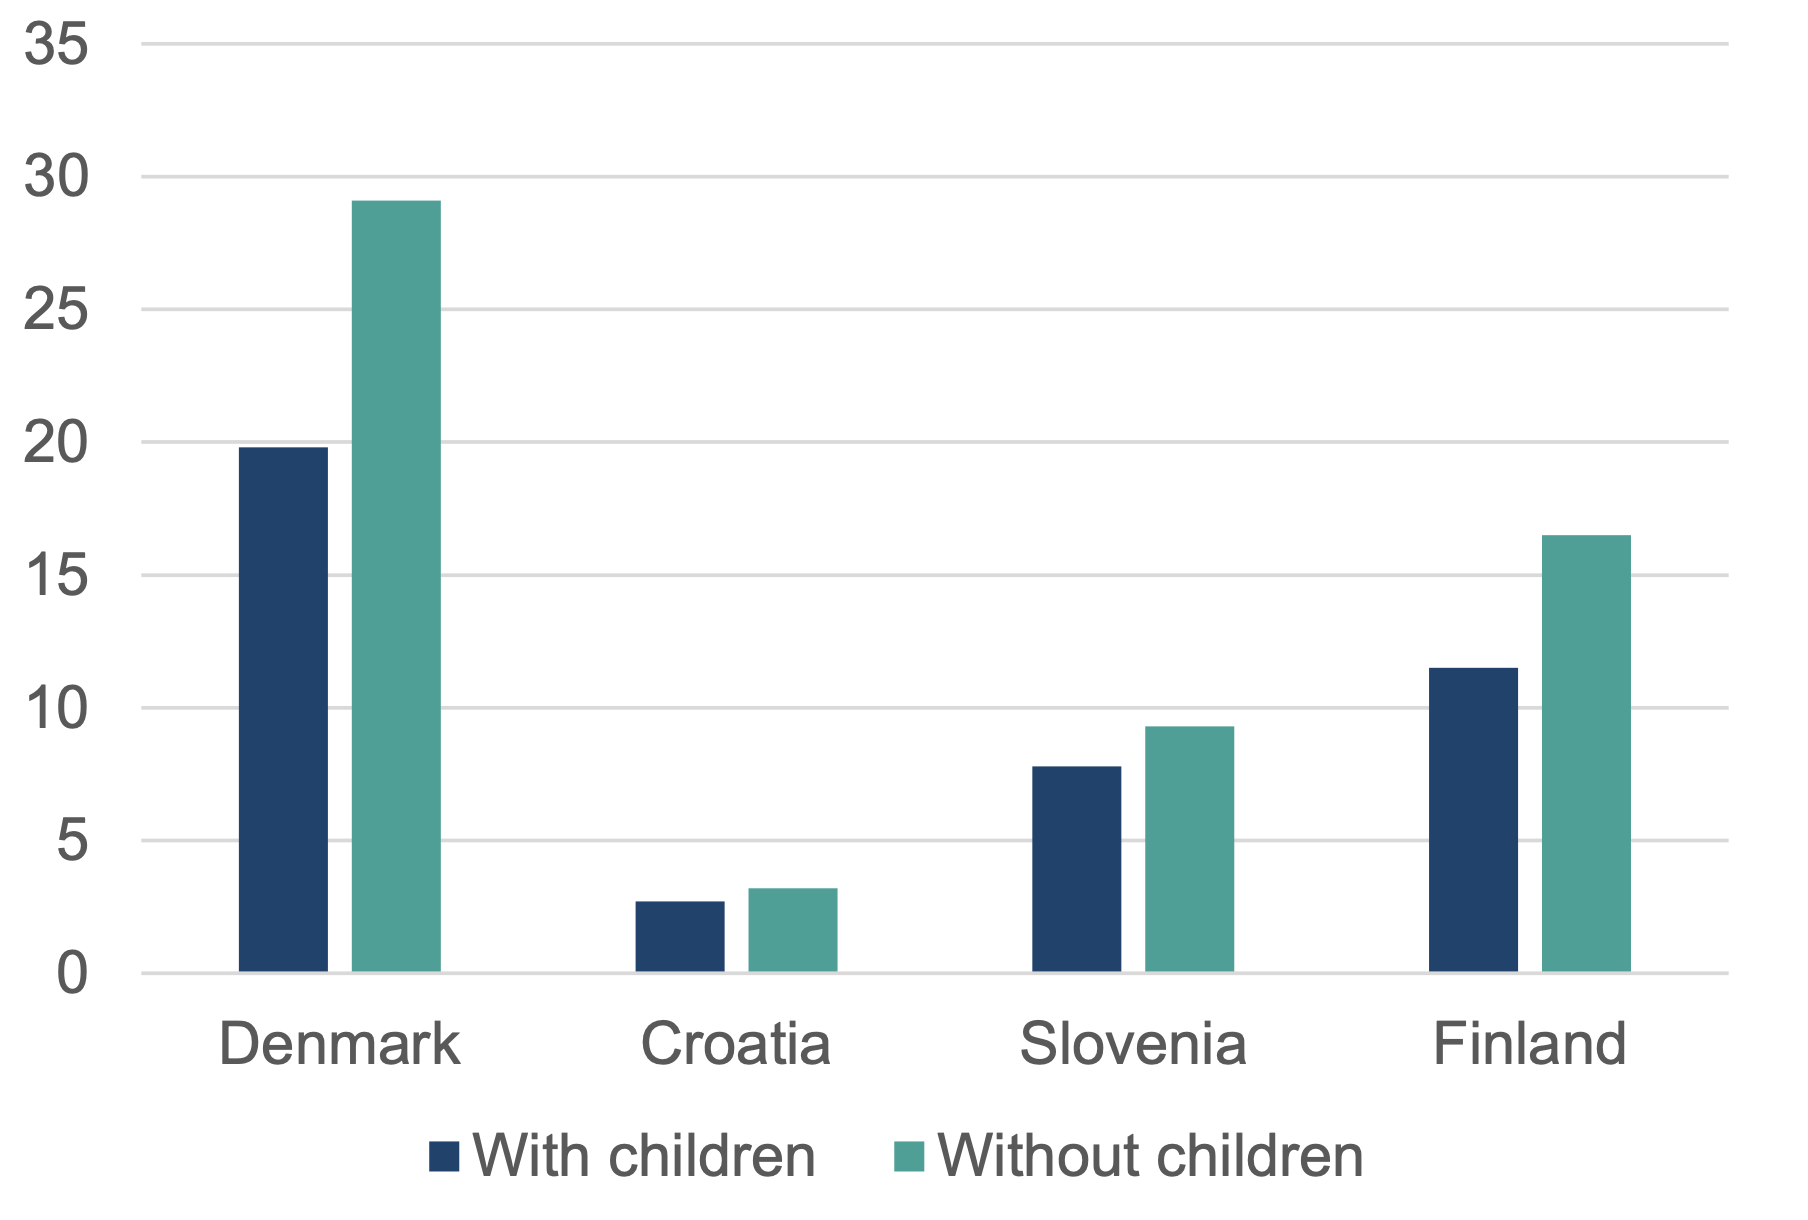
Figure 15 shows that in 2024, Finland had the lowest levels of in-work poverty amongst parents (3%), slightly lower than the rate in Denmark and Slovenia (both 5%). In Scotland, a fifth (20%) of parents were in in-work poverty in 2021-24 – double the rate in Croatia (10%) and four times the rates in other comparator countries. Scotland is similar to Croatia and Finland in that households with children have higher levels of in-work poverty than households without children.
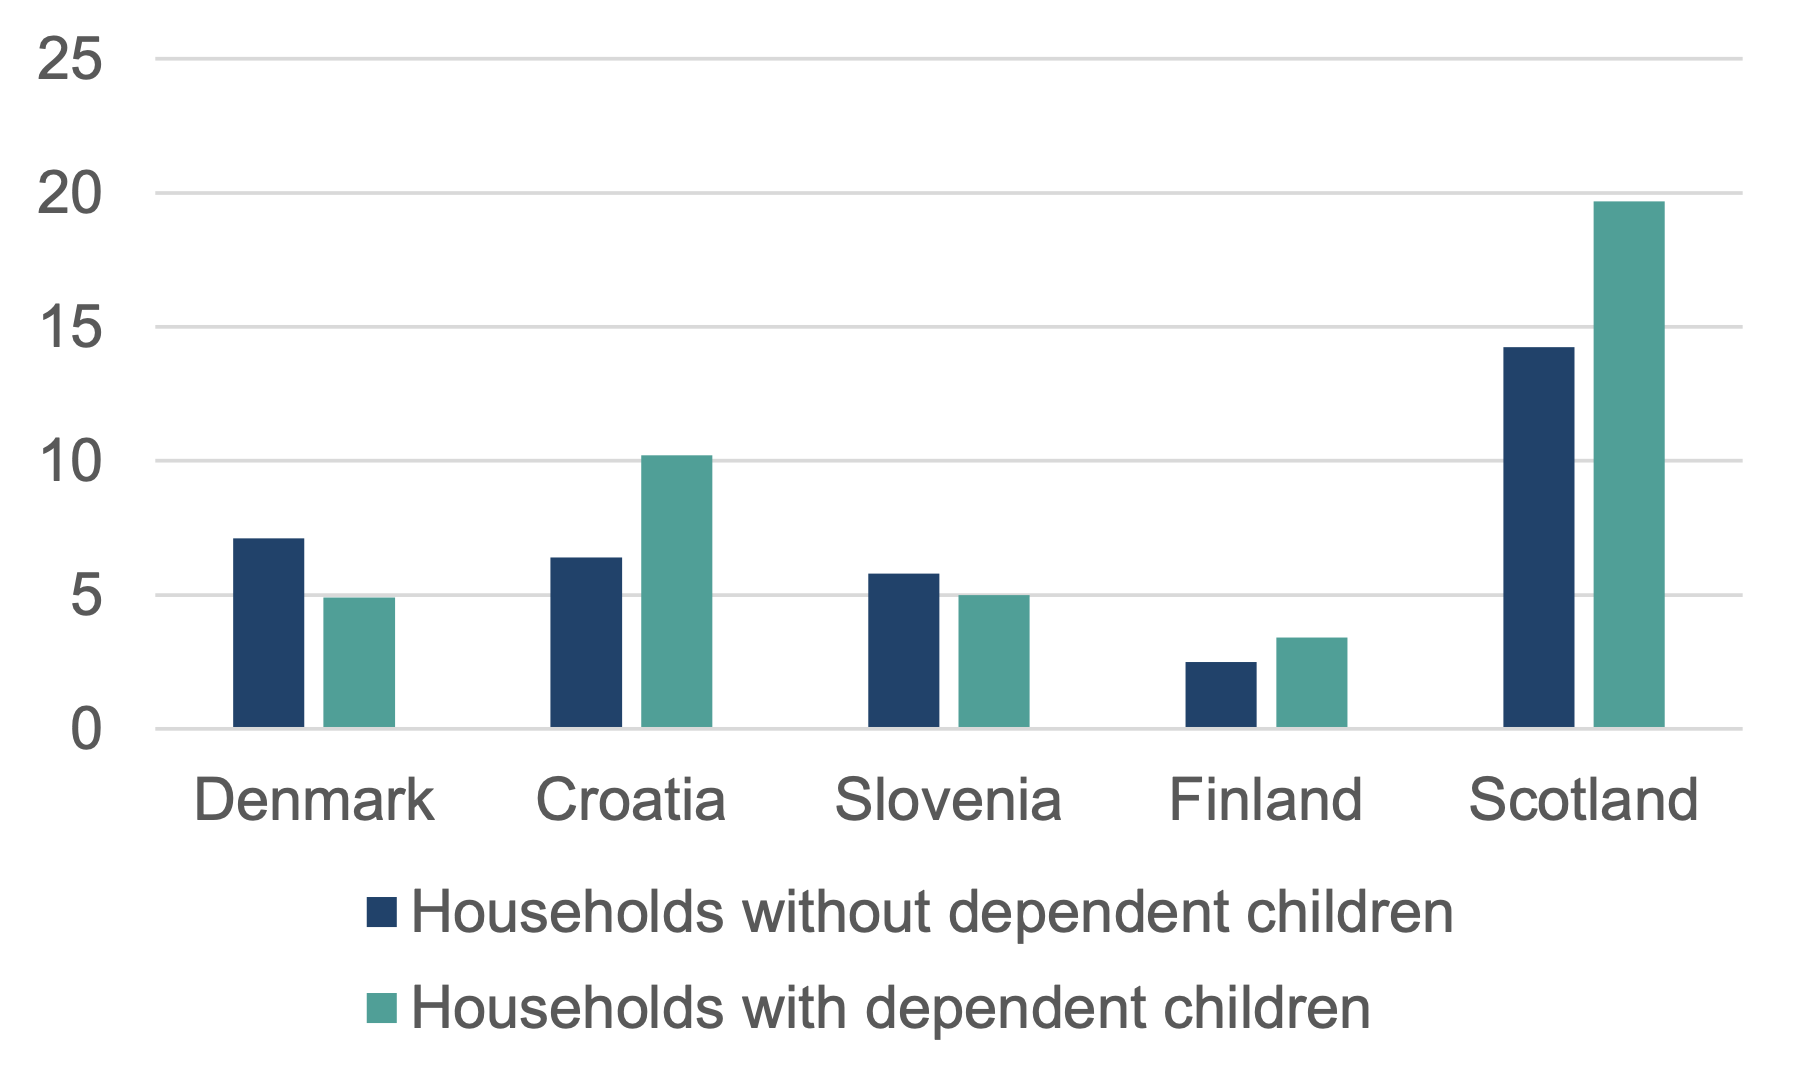
Source: Eurostat, In-work at-risk-of-poverty rate by household type, 2024 (ilc_iw02); Poverty and Income Inequality in Scotland National Statistics report, 2025 (three-year averages, 2021-2024)
Figure 16 shows how the trend in parents’ in-work poverty rate has changed over time. Finland and Denmark have seen consistently low rates of in-work poverty amongst parents since 2005. Croatia and Slovenia have both seen in-work poverty amongst parents decline since 2013, in line with their reductions in child poverty. Slovenia’s in-work poverty rate in 2024 was comparable to Denmark’s, but Croatia is notable for seeing a sharp increase in in-work poverty amongst parents since 2022 – rising from 6.5% in 2022 to 10% in 2024. In Scotland, in-work poverty amongst parents has been consistently higher than the comparator countries. Between 2002-2005 and 2012-2015, this was relatively stable at around 15%, but since then in-work poverty amongst parents has been trending upwards – reaching 20% in 2021-2024.
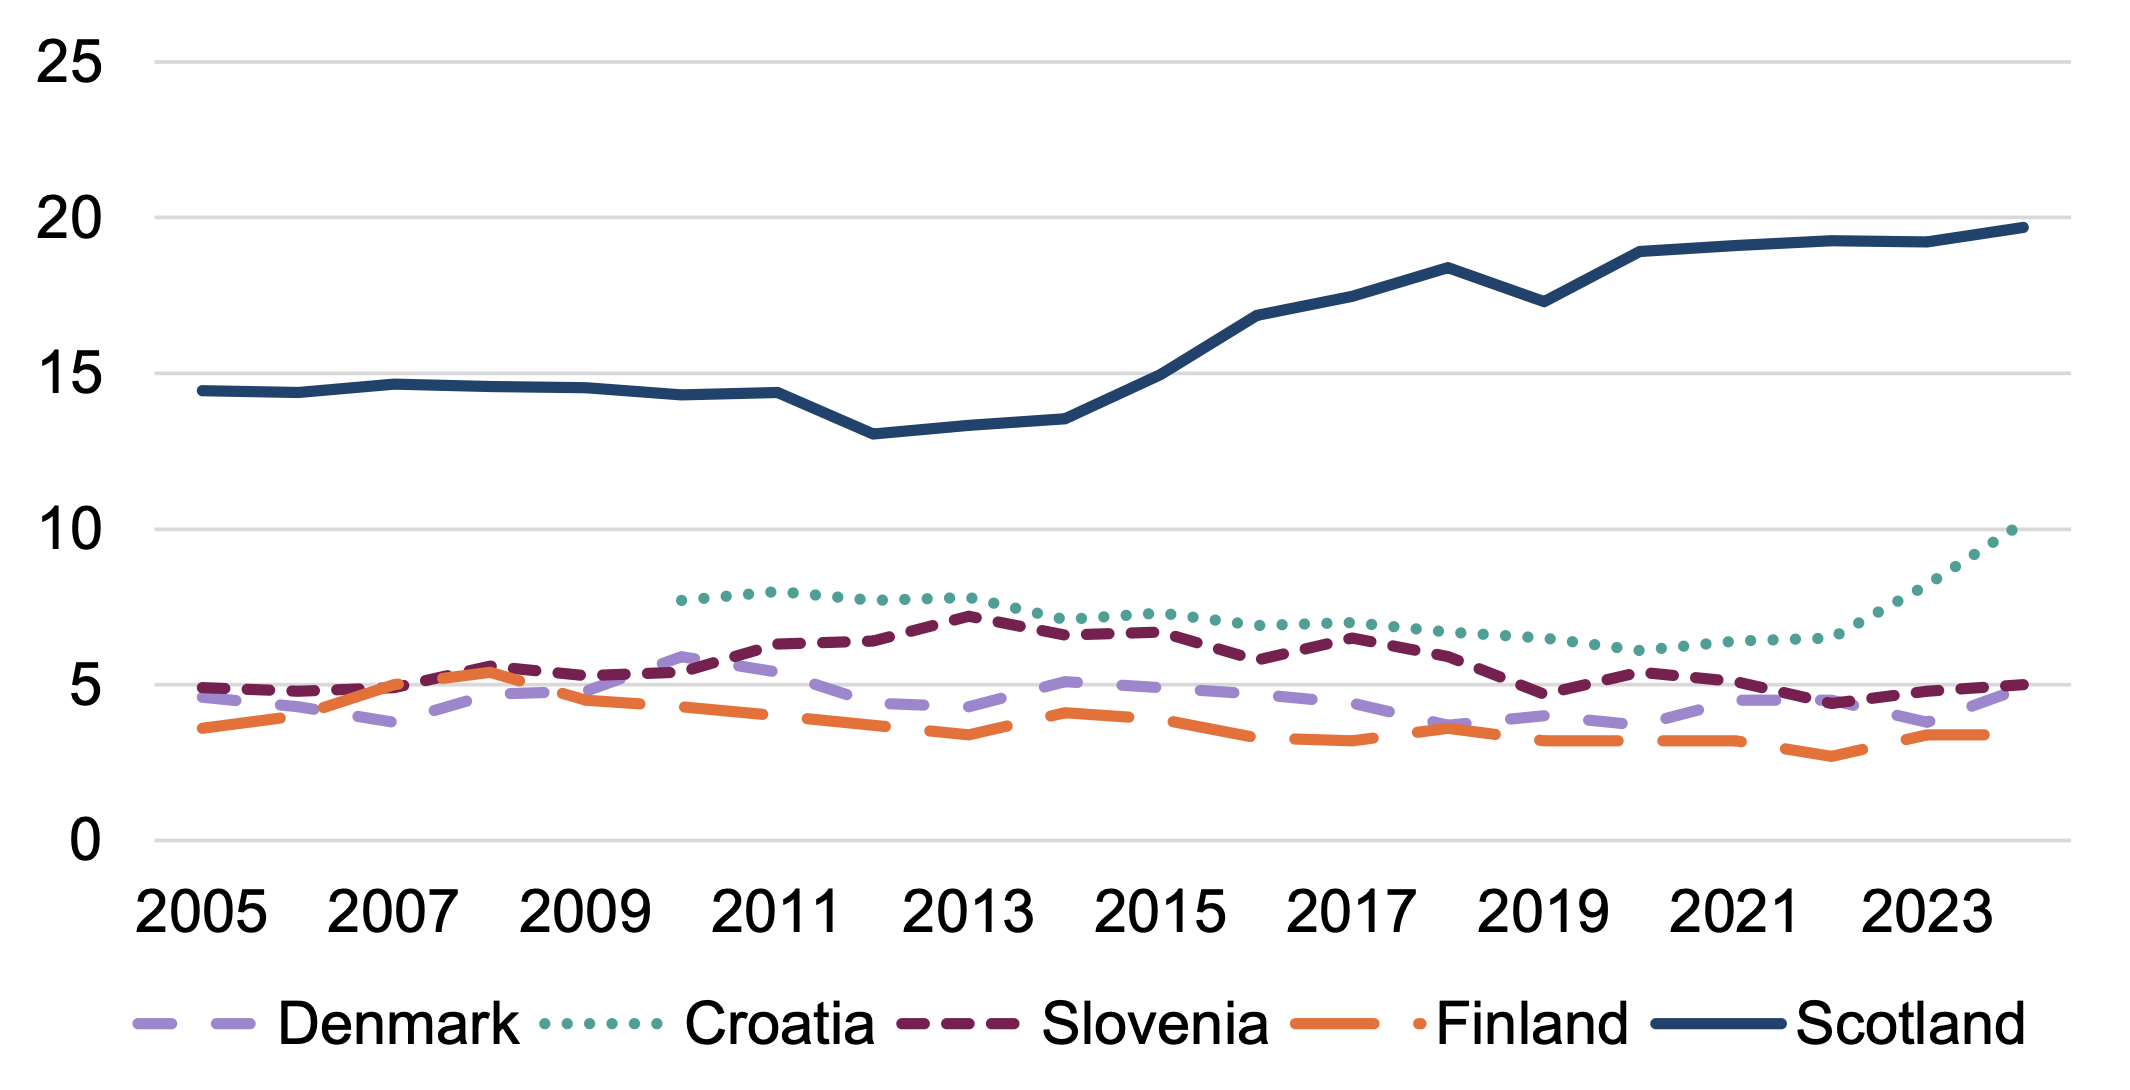
Source: Eurostat, In-work at-risk-of-poverty rate by household type, 2025-2024 (ilc_iw02); Poverty and Income Inequality in Scotland National Statistics report, 2025 (three-year averages, 2002-05–2021-24 )
Contact
Email: TCPU@gov.scot