Improving our understanding of child poverty in rural and island Scotland: research
Building on the "Poverty in rural Scotland: evidence review" (December 2021), SRUC were commissioned to undertake the research project, “Improving our understanding of child poverty in rural and island Scotland”.
3 Understanding the data - what do we already know?
3.1 Child poverty trends and high-level data sources
The four high-level child poverty targets set out in the Child Poverty (Scotland) Act 2017 relate to the percentage of children in relative poverty, absolute poverty, low income and material deprivation, and persistent poverty after housing costs[1]. Data for monitoring progress towards the national targets are derived from the UK-wide Family Resources[2] and Understanding Society[3] surveys, which can only provide statistics at the Scotland level. National child poverty trends and progress are published annually by the Scottish Government, using these data sources[4]. The annual child poverty action reports report against the high-level targets at local authority level.
The Scottish Government’s Local Child Poverty dashboard[5] provides data available at local authority level, enabling analysis of trends at that scale. The dashboard contains a selection of indicators that do not measure child poverty directly, but they can be used to understand the local context and how it might be changing, as well as make comparisons between local authorities.
There is no annual, systematic review of child poverty statistics in rural and island communities, although a recent review of evidence compared the proportion of children in relative poverty after housing costs by urban/rural classification and looked at data related to children living in families with ‘limited resources’ (Scottish Government, 2021a). The limited resources measure identifies children in families that have both low income and cannot afford three or more things from a list of 22 basic necessities (Scottish Government, 2017). Figure 1 shows the percentage of children who live in families with limited resource by urban/rural classification[6]. Although helpful to gain a sense of the differences between rural and urban settings, these experimental statistics are only available at local authority level and use a slightly different measure of low income[7] and a different material deprivation threshold to the national statistics.
| Before housing costs % | After housing costs % | |
|---|---|---|
| Accessible rural | 12.3 | 14.5 |
| Remote rural | 10.6 | 12.5 |
| Urban | 14.8 | 17.8 |
| All areas | 13.9 | 16.6 |
In March 2020, DWP and HMRC produced a helpful new set of indicators of child poverty[8]. These provide the most reliable indicator to date of local child poverty at both local authority and UK parliamentary constituency levels. However, the estimate of the percentage of children living in low-income households (with below 60% of the median income) is before housing costs (BHC) in this dataset. Therefore, these statistics do not consider differences in housing costs and can understate the impact of low incomes in areas where housing costs are high, as is the case for many rural areas (Thomson et al, 2014).
Analysis by Hirsch and Stone (2020) tackled this issue by combining the DWP/HMRC indicators with information about housing costs at the local level to estimate poverty rates after housing costs (AHC) – that is, how many children under the age of 16 are in households with incomes net of housing costs that are below 60% of the median. Combining Hirsch and Stone’s (2020) data with population tables from the 6-fold rural-urban classification (Scottish Government, 2018c), Figure 2 shows the trends in child poverty in predominantly rural/island UK parliamentary constituencies in Scotland. The figure shows an increasing trend in the number of low-income households after housing costs in all these regions between 2014/15 and 2019/20. The highest percentage point increase in this period was in Dumfries and Galloway (3.9%), with an average 2.9% increase across the constituencies in Figure 2.
These increases are similar to the national trend, which has been attributed to UK-wide policies set in place in the 2015 UK summer budget, which included an estimated £12 billion cut in working-age benefits, a four-year freeze in benefit values and the abolition of the ‘family element of tax credits and Universal Credit, which have reduced state support for parents significantly (Corlett, 2019).
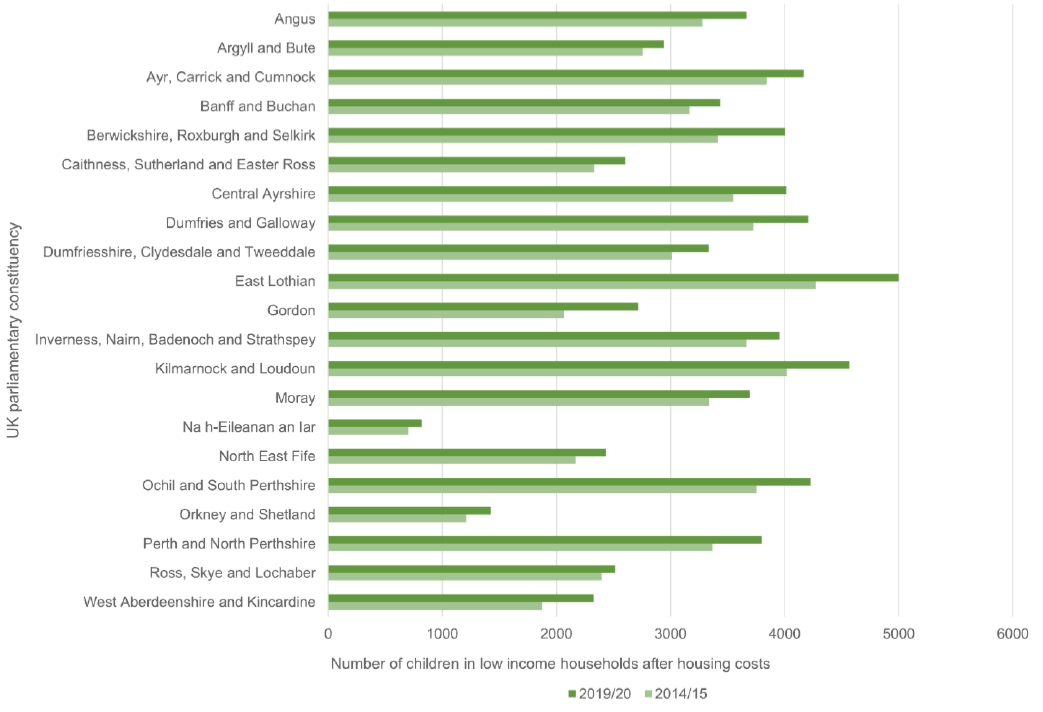
* At least 40% of the population in each of the UK parliamentary constituencies shown in Figure 2 live in either remote small towns, accessible rural areas or remote rural areas. Source data: Hirsch and Stone (2020) – using DWP/HMRC data - and Scottish Government 6-fold urban-rural classification (Scottish Government, 2018d). Note that the Isle of Arran is not included as it sits within the North Ayrshire and Arran constituency, which is predominantly urban.
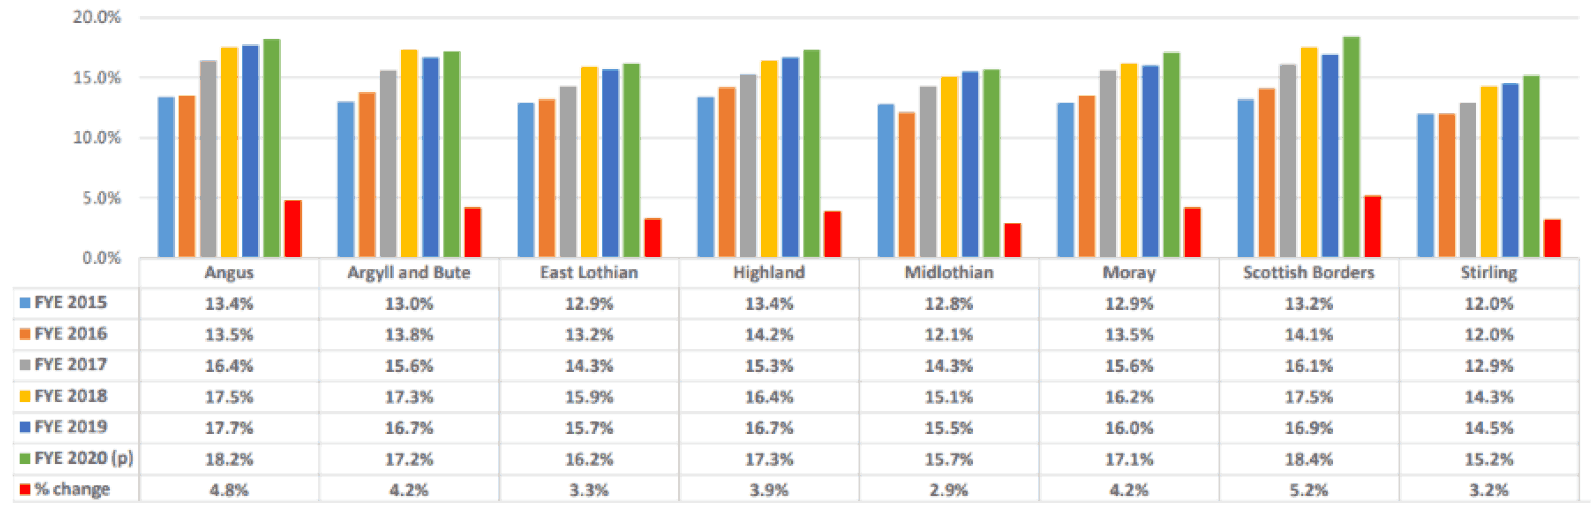
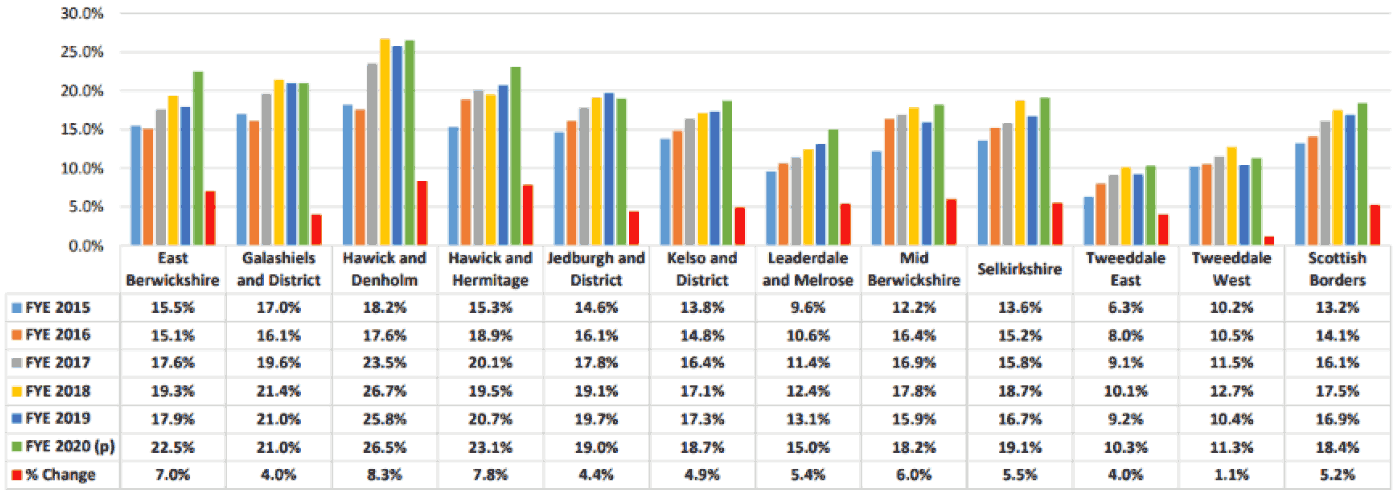
Similar increases in the number of children in low-income households are documented in the annual child poverty action plans, although there is variance within the reports in terms of whether data are presented at local authority or smaller area level. The Scottish Borders Year 3 report confirms the trend shown in Figure 2, comparing annual changes in the percentage of children in relative low-income families with local authorities in its ‘family grouping’[9] for children, social work and housing indicators. These annual trends are shown in Figure 3. Perth and Kinross Council has agreed 26 indicators to measure child poverty across the region, with data presented in the action report at local authority level. Annex 1 shows the data sources used by Perth and Kinross Council to examine change over time at local authority level.
3.2 Local-level data
Gaining an understanding of child poverty below local authority level is important for targeting local action and resources efficiently. The national and regional/constituency trend data is useful for comparing change between areas and over time. However, local authorities and other organisations require local-level data to help them target support for children experiencing poverty.
The SIMD is a very sophisticated tool for identifying and targeting support for deprived areas and populations at the datazone level[10]. However, concerns have been repeatedly raised that these area-based measures may under-represent the experience of rural deprivation, despite improvements on previous indices (e.g. McKendrick et al, 2011; Skerratt and Woolvin, 2014; Gavin, 2021). This is particularly because the access domain of the SIMD receives insufficient weighting, failing to capture the frequency and cost of public transport in rural areas. Another key issue is that the measures do not detect people who experience deprivation but who do not live in deprived areas – deprivation is more widely dispersed in rural areas, in comparison with urban areas. These factors combine to make rural areas less likely to feature amongst those communities ranked as deprived, echoing several pieces of research that note the ‘hidden’ nature of rural poverty in generally affluent places (e.g. Shucksmith et al, 2022). Clelland and Hill (2019) note that if the qualitative experiences of deprivation in rural and urban areas are significantly different, it becomes difficult to make a judgement about the domains and indicators that are equally applicable to both. Therefore, SIMD needs to be used with local context taken into account (see the next section about lived experience data).
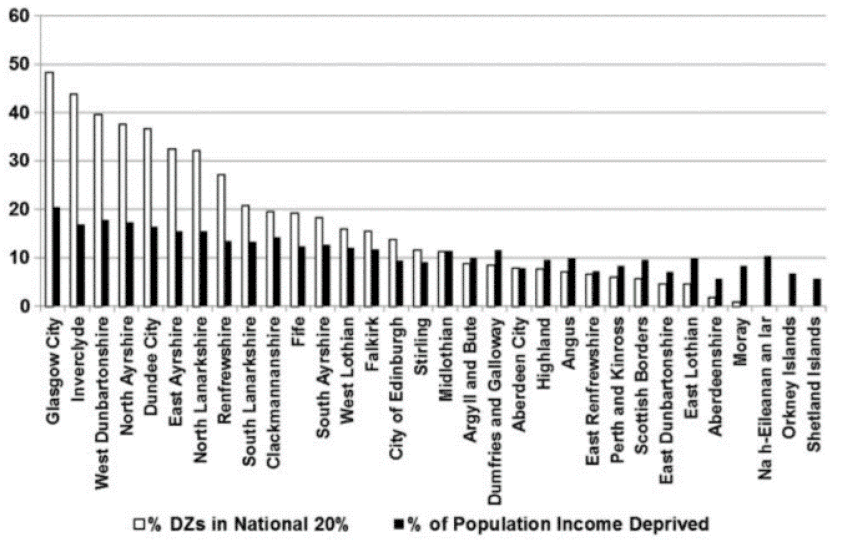
Although nearly half of the ‘most deprived’ areas[11] are in Glasgow, with none in the three island regions, rural datazones that have no or very few areas considered deprived in national terms have significant proportions of the population in income deprivation – see the right hand columns in Figure 3 - even if these levels are lower than the average (Clelland and Hill, 2019). Preliminary work in England by DEFRA[12] has also highlighted that the IMD (the English Index of Multiple Deprivation) cannot equitably identify the same proportions of low income in rural and urban areas, making the IMD unsuitable for targeting rural deprivation without re-standardising to separate out rural and urban areas.
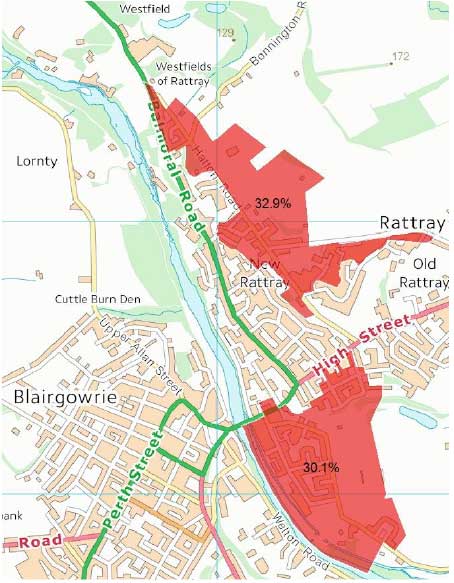
Noting the challenges associated with applying the SIMD in rural areas, other sources of longitudinal microdata might provide more insight. However, a survey of local authorities’ place-based interventions found that the majority still use the SIMD for at least partial (and sometimes the only) justification for targeting support in specific areas (Baczyk et al, 2016). Nonetheless, the SIMD can help in the development of place-based approaches, particularly when the domains are considered individually to reflect local and regional priorities, rather than as a weighted group. Mapping of income deprivation at datazone level in Perth and Kinross, for example, has allowed the Community Planning Partnership to understand differences between areas when targeting support (see Figure 4). A very helpful application of SIMD has been in rural Dumfries and Galloway to inform the region’s poverty strategy. The analysis found that people experiencing income deprivation are spread across the region: 80% of people on low incomes live outside the most deprived places (see Scottish Government, 2020, for a summary and Hill and Clelland, 2015, for the full report).
While this approach is helpful for developing relative rankings for different areas, it does not identify the absolute number of deprived individuals in each area or the extent to which deprived individuals are concentrated into deprived areas. In work in Argyll and Bute (Bailey et al., 2004), none of the wards in the region were found to be in the most deprived decile for Scotland but six appear in the second decile and three in the third decile (and the most deprived are mainly in larger, urban centres). In this case, wards did not appear to be a useful basis on which to identify areas in need of special interventions such as area-based initiatives as, even in the most deprived ward, only one in four people is regarded as income deprived. Even at the scale of output areas, the most deprived output areas still contain only a minority of individuals regarded as income deprived. Targeting the areas identified as poorest missed 86% of people below the poverty line.
This targeting of places has become more common following the requirements for Community Planning Partnerships (CPPs) and the development of Locality Plans, and data from the individual domains of the SIMD can help this approach. With the above challenges in mind, local authorities are increasingly taking more strategic interventions to identify households within the child poverty priority groups[13], supporting them to enter the labour market.
Recognising the importance of a local-level understanding of child poverty, some of the child poverty action plans include data at ward level to inform understanding of where to prioritise resources and of changes in data over time. Of the predominantly rural local authorities that have published a Year 3 child poverty action plan (2021/22), Scottish Borders Council has published trends at a smaller scale, with that data once again painting a similar picture of increases in relative low-income in all wards (see Figure 5). Other rural/island local authorities that have published Year 3 reports – Angus, Argyll & Bute, and Orkney - have considered local authority level data only. The Argyll & Bute report notes challenges of island life, including food insecurity, access to employment, loneliness among young people, and higher food costs[14].
Trend data by ward is available in some of the Year 2 child poverty action reports to describe the number and/or percentage of children living in relative low-income families, including Aberdeenshire and Dumfries & Galloway. Other local authorities have focussed on local authority/UK parliamentary constituency data on relative low-income households. However, using low income as an indicator of child poverty can also be challenging in rural areas because of the considerable variation in living costs (Glass et al., 2020). It should be noted that the Scottish Poverty and Inequality Research Unit at Glasgow Caledonian University is currently conducting a systematic review of all the child poverty action reports and this work will consider the extent to which national priorities are being implemented locally[15].
Public Health Scotland (PHS) recently conducted a pilot project with Inverclyde Council to identify available local datasets that can help local authorities and partners implement local actions targeted at the priority groups (see the Box below). The data sources identified in the work can be used alongside the local child poverty dashboard to inform local actions targeted at the priority groups[16].
Case study
Child Poverty Data Source (Public Health Scotland)
This pilot project, co-produced with Inverclyde Council, used a public health needs assessment approach to build a better picture of what the local child poverty support ‘system’ looks like in Inverclyde. The project identified available local level data and how this could be used more effectively to shape local child poverty priorities.
The project focused on:
- mapping local services that low-income families might use;
- understanding the experience of the journey through those services and what families might need from them; and
- the data those services collect about families.
The project used participatory workshops with stakeholders to understand the journey of a fictional low-income family through the support system, and the pathways between services. This allowed the development of system maps and the identification of knowledge and data gaps.
Based on the themes identified at the workshops, they developed a ‘child poverty data source’ that provides a ‘go-to’ source of information about a range of local and national sources of data that local authorities and partners can use to understand child poverty in their region.
For more information, see: Prioritise child poverty: a data and systems approach (Public Health Scotland, 2021)
The resulting ‘child poverty data source’ provides a comprehensive overview of all the datasets available to local authorities developing policies and actions related to child poverty (see Annex 2 for a full list). The data source predominantly notes information from a few key providers, including: the Annual Survey of Hours and Earnings, Annual Population Survey, DWP, HMRC, Scottish Government, Scottish Social Security Agency, Skills Development Scotland and the Scottish Housing Regulator. The accompanying spreadsheet is organised by population profile (and divided into the priority groups) and the three drivers of child poverty, and highlights gaps in knowledge.
Looking at the results of this work through a rural/island lens, there are several datasets noted within the data resource spreadsheet that could be analysed to provide sub-local authority data to inform rural and island responses. These are included in Annex 3. Some of the indicators in Annex 3 rely on analysis of census data which is now quite dated. It is also important to note the lack of any indicators in the PHS data source below local authority level relating to cost of living (including housing costs), private childcare availability and access to advice services.
Feedback on this work has been positive and PHS has alerted other local authorities to the approach, with positive feedback received from some rural/island authorities. As a representative working on child poverty in one rural/island local authority noted in their written feedback on the work to PHS:
“One of the difficulties we have is around the search for easily usable, up to date and meaningful data so this approach is very handy, and I think would help improve our use of data across the partnership to better inform planned outcomes and the actions required to achieve these.”
Very positive comments were also received by PHS about the use of participatory workshops with stakeholders and how the methodology could be rolled out to help local authorities to develop process maps that chart the journey of individuals/families needing support. This process could be tailored to suit the specific needs/priorities in an area.
Crucially, the PHS work outlined in the previous section highlights the importance of what local knowledge can tell local authorities and partners about child poverty, as well as what gaps there are in our understanding. Local knowledge not captured in statistical datasets includes the points shown in Figure 6.
In all local authority regions, the child poverty action reports provide a very helpful insight into the different needs and priorities in each local authority area, and the extent to which local knowledge informs the local approach. However, it can be difficult to isolate child poverty from the wider partnership work being undertaken by predominantly rural/island local authorities to address poverty and inequality. For example, in the Highland region, child poverty is considered in the Highland Outcome Improvement Plan, the Highland Council Corporate Plan and Strategic Priorities, the For Highland’s Children children’s services plan, the Regional Improvement Collaborative Plan[17], and the Highland Economic Forum and Collaborative Action Plan. Nonetheless, the Highland action report describes how the CPP looks beyond income-based drivers to consider wider socio-economic inequalities[18] and recognises how a range of factors have a significant impact on poverty: lack of equality of opportunity, barriers to accessing services, transport, etc. This local authority also recognises the rural dimension of the experience of poverty in its action report – the ‘poverty of opportunity’.
Figure 6: Local knowledge that can help to target local action effectively (extracted from Public Health Scotland, 2021)
Income from employment
- The availability of flexible (family-friendly) job opportunities offered by anchor institutions (including in advertised positions)
- The combined contribution of UK, Scotland and local employability programmes at a local level (including data from the Parental Employability Support Fund*)
- The contribution of DWP and Jobcentre Plus to employability
- Uptake of free childcare places (including for eligible two-year-olds)
- Number of private childcare providers
Income from social security
- Number of people supported by advice services
- Total value of income maximised through advice services
- Total value of debt managed
- Number of people supported with debt advice
- Number of people supported with budgeting
- Number of referrals to support services
- Number of pregnant women supported
- Income generated for pregnant women
- Number of referral pathways established
- Number of public sector staff trained in welfare advice/awareness
- Number of financial education sessions delivered to schools
- Social Security Scotland engagement with schools
- Free school meals/clothing grants
- Local data on families with children receiving Scottish Welfare Fund
Costs of living
- Private rental costs (at local authority level)**
* To be meaningful, employability data needs to be compared against scale of need. Data on personal tax credits allow for out-of-work and in-work families with children to be identified at a small area level, but Universal Credit household statistics do not currently allow this distinction to be made for families.
** Official statistics are not currently published at local authority level. This gap could be filled by local knowledge or through data from private sources such as Gumtree/Citylets.
3.3 Lived experience data
In the expert interviews conducted for this briefing, the importance of ‘lived experience data’ was repeatedly noted. Understanding the experiences of children and their families is seen as important not only for providing efficient and effective support but also to raise awareness of the daily hardship that people must deal with.[19] In a rural/island context, this type of data is particularly important when considering the data challenges highlighted above, alongside the hidden nature of rural poverty.
This type of approach was central to the PHS stakeholder workshops that considered the journeys of a ‘pen portrait’ family through the support system. At the 2021 National Child Poverty Conference hosted by the Improvement Service[20], the importance of lived experience data was repeatedly emphasised by participants as being central to effective, targeted local action.
Several pieces of work have recognised the importance of this type of data in a rural/island context. Recent research conducted for Transport Scotland (McHardy and Robertson, 2021) explored the public transport experiences of individuals. Importantly, this work reinforced how transport is a key cost in daily life that is difficult to balance against other essential living costs. There are specific issues experienced by rural residents, as well as people feeling stigma and discrimination when using public transport. These issues are amplified by challenges related to limited access to public transport and the availability of services.
When considering progress in relation to closing the poverty-related attainment gap in Scotland, work has revealed that schools in rural areas are less likely to include a specific focus on those affected by disadvantage (Scottish Government, 2021d). In a survey of headteachers, those based in rural areas were less likely to feel that they understood the challenges faced by pupils affected by poverty. Similarly, headteachers of rural schools that are not in receipt of the Attainment Scotland Fund were less aware of the range of potential range of approaches to help to close the poverty-related attainment gap. This type of local knowledge is important, particularly when skills/attainment levels are not the best proxies for wage levels in a rural context.
Nonetheless, progress is being made overall in relation to addressing the poverty-related attainment gap (Scottish Government, 2021d) and the recent refresh of the Scottish Attainment Challenge programme (backed by £1bn of investment in this Parliament) presents an opportunity to continue this progress and consider how rural headteachers can be supported to invest Pupil Equity Funding in a way that helps disadvantaged pupils in their schools.
It remains to be seen what the full extent of the impacts of school closures will be on the educational attainment gap in rural/island communities, although the investment by Scottish Government in the distribution of devices and internet connectivity packages was welcomed by support organisations and families. With a ‘new poverty’ emerging as a result of changing circumstances associated with the pandemic, connectivity provision for young people living in disadvantaged settings in remote/rural communities has been highlighted as a particular issue that requires more investigation to understand experiences (Scottish Government, 2021e).
In 2021, the Northern Alliance held workshops in which participants were asked to reflect on possible pathways that link poverty and attainment in the Alliance area. Themes included distance to school, seasonality of work, physical isolation, cost of living, lack of/distance to services, minority ethnic groups, cultural aspirations, digital infrastructure, small schools and limited resources. Several challenges that are not currently documented in mainstream literature were discussed, including lack of extracurricular activities and limited resources in rural schools, both of which were cited by participants as crucial areas affecting children. The next steps of this project involve mapping both large-scale data and more informal evidence held locally, emphasising the importance of the lived experience data to develop a robust modelling framework that can be used to better understand the links between poverty and attainment in the region (Congreve and McFayden, 2021).
3.4 What are the gaps in our understanding?
Progress towards the national child poverty reduction targets in Scotland is subject to rigorous evaluation, drawing on detailed statistics on:
- employment (hours worked, pay, employment and underemployment, skills under-utilisation, skills and qualification levels);
- childcare (availability, affordability and access);
- transport;
- costs of living (housing, energy and food);
- ‘enablers’ of wellbeing (debt, access to affordable credit, savings levels and internet access); and
- benefits ‘reach’, levels, and take-up (Round and Longlands, 2020).
However, progress against targets is generally measured at the national level and the research and data analysis outlined so far reinforces concerns about the pitfalls of data used to measure and monitor poverty in a rural/island context. The national data cannot tell local authorities and partners whether local actions are effective.
National data can be disaggregated locally and can perhaps be used more effectively to track changes through time. This was highlighted above using the DWP/HMRC after housing costs analysis and there are clearly opportunities for more local-level analysis using SIMD, the Local Child Poverty Dashboard and other data identified in the PHS project that is available below local authority level. However, some of the experts interviewed for this briefing noted challenges with small rural/island samples within national datasets, as well as the limited capacity within some local authorities to analyse data at sub-local authority level for the child poverty action reports (and additional data analysis can become a distraction for local leads who are otherwise focussed on local actions and evaluation). For those able to carry out additional data analysis, the PHS child poverty data source provides an excellent entry point into the various datasets available at different scales.
Comparisons between local authorities tend to focus on relative position and can provide misleading evidence of local impact of actions. Nonetheless, local data can be used to evidence the scale of the problem locally, help to understand the nature of the problem at a given time, inform priority local actions, and build a case for funding. Crucially, local leads need to focus on local issues, with energy best spent on targeted evaluation, programme assessment, budget development, outcome monitoring and implementation oversight. That way, it would become easier for local leads to understand ‘what works’ and target future resources accordingly.
The PHS work identified key knowledge gaps, derived from extensive workshop discussions with stakeholders. These included: a more detailed understanding of barriers to work for parents; childcare capacity at a local level[21]; a review of the contribution of economic planning to child poverty (and what indicators might be used to monitor this); local impacts of the two-child benefit limit; fuel poverty costs for families at a local level; and the quality of local relationships between local, UK and Scotland-wide social security programmes (tested against experiences of those who use the system). The experts interviewed for this briefing also suggested that key data gaps exist in relation to the following aspects in rural/island communities: benefits take-up; cost of living; fuel poverty; childcare; the cost of doing business in rural areas; and the lived experience of support for those in poverty.
It has already been noted that benefits uptake is typically lower in rural areas than in urban areas. For example, work in rural England by the Commission for Rural Communities (2007) used administrative data to calculate uptake as a proportion of those eligible for benefits and revealed a systematic relationship between settlement size and take-up of pension credit. In Scotland, official published statistics on welfare benefits show the number of applications received, decisions made, and payments issued (by local authority). However, there is no published information on eligible populations and therefore it is not possible to calculate uptake rates at the local level. The Scottish Government publishes estimates of uptake of the Scottish Child Payment and Best Start Payments, but these are only at the national level[22].
Recent research has highlighted the need to combine person-centred and place-based measures in tackling rural poverty and social exclusion, noting the importance of voluntary and community organisations in making people aware of their welfare entitlements:
“It is striking how often people’s awareness of, and application for, national person-based measures, such as welfare entitlements, has been facilitated by local place-based measures, such as advice and support from CABs and other VCSEs, or through local partnership working. It is also evident that national policies are designed and implemented without the benefit of local place-based knowledge.” (Shucksmith et al., 2021, p.27).
Increased understanding of the role and importance of these organisations in a rural and island context is likely to help target support for VCSEs to continue to tackle the challenge of lower benefits uptake in rural and island communities. This research also drew attention to the need for rural and island proofing of the welfare system by DWP with support from Scottish Government. Rural challenges which potentially impinge on child poverty include distances to travel for work capability assessments or the wait for an assessment, the lack of face-to-face information and advice provision locally, and feelings of stigma which are amplified in rural localities. Again, understanding lived experiences of these challenges will help to design suitable interventions.
In relation to cost of living, while the Minimum Income Standards work provides a very clear picture of the additional rural/island living costs, there is potential to consider these costs at a more local level, using the qualitative and deliberative methodologies more widely to understand how families allocate their living costs and what individual coping strategies they use. This would enable local support organisations to provide more targeted and informed support, as well as capture the variation of people’s experiences. Importantly, this type of approach would support work underway on Community Wealth Building, putting people’s lived experiences at the heart of decisions about the economy and supporting local authorities to work with the private, third and community sectors to deliver a wellbeing economy[23].
There is also potential to consider broader work on food prices that is not always framed from a poverty perspective, or which analyses commercial data. For example, recent work by Revoredo-Giha and Russo (2020) analysed whether remote rural areas in Scotland suffer from food prices that are higher than the country’s average prices, using ‘expensiveness indexes’ for a basket of food calculated from commercial data in the Kantar Worldpanel consumer database.
The higher cost of living in remote rural, remote small town and island areas has been recognised in an amendment to Scottish Fuel Poverty legislation[24] which raised the Minimum Income Standard used in the measurement of fuel poverty (Gavin, 2021). However, current local level fuel poverty data is deemed less reliable than for urban contexts due to being based on small sample sizes in the Scottish Household Survey. In the Highland Council region, for example, small sample sizes mean that the data often skews to Inverness. The small sample sizes also make it challenging to monitor change over time (Wilson, 2016).
Several gaps in our understanding remain in relation to uptake and provision of early learning and childcare in rural and island contexts. Factors preventing uptake include additional travel burdens (Scottish Government, 2019b) and the cost/practicalities of childcare delivery, particularly in island communities (Scottish Government, 2021f).
There is also the potential to understand the impact of employability and skills development initiatives[25] in rural/island contexts and the extent to which these are contributing to local action on child poverty. Skills development plays an important role in underpinning inclusive rural economic growth, with a range of important interdependencies that can enhance or constrain progress (e.g. availability of affordable housing, digital connectivity). As noted in the PHS child poverty project, it would be helpful to unpack the combined contribution of UK, Scotland and local employability programmes at a local level (including data from the Parental Employability Support Fund).
3.5 Recommendations for improving understanding of child poverty in rural and island communities
Recommendations
1. Recognise lived experiences as valid and important qualitative data for informing place-based decisions and actions in rural and island communities.
2. Support the Improvement Service to continue its work on sharing good practice, particularly in relation to local data analysis and other available evidence to inform action in rural and island communities.
3. Enable Public Health Scotland to support the roll out of the child poverty data sourceand associated workshops to all local authorities (in collaboration with the Improvement Service when implementing recommendation 2).
4. Use the child poverty action reports strategically to understand and share best practice and provide additional support to those local authorities with less capacity to undertake local level data collection and analysis.
5. Set up a Rural and Island Child Poverty Network (or similar) that places a strong emphasis on sharing knowledge and best practice between local leads (across sectors – health, education, transport, etc.), including the Improvement Service, PHS, Social Security Scotland, SPIRU and other researchers.
6. Recognise lived experiences as valid and important qualitative data for informing place-based decisions and actions in rural and island communities.
Recognising the local context is of great importance when tackling child poverty in rural and island communities. Therefore, there is a need to underpin any new initiatives with local consultation and understanding of lived experiences. This emphasis on ‘local intelligence for local actions’ was supported by many of the expert interviewees, as well as the need to listen to the voices and experiences of children in rural and island communities[26].
There is potential to use existing community levers to collect and interpret this type of data, as well as implement actions to respond to the findings. Existing community-level institutions, such as Local Action Groups and other place-based voluntary and community organisations should be supported to improve understanding of the issues and related actions that can help to address child poverty at the local level.
7. Support the Improvement Service to continue its work on sharing good practice, particularly in relation to local data analysis and other available evidence to inform action in rural and island communities.
The co-ordination role of the Improvement Service in Scotland has been praised by those looking to improve child poverty actions both within Scotland and also in England (Round and Longlands, 2020). The Improvement Service’s proactive work with stakeholders provides formal linkages between local leads and a platform for sharing good practice, learning, local intelligence and data (quantitative and qualitative). With sufficient resources, the Improvement Service, in partnership with Public Health Scotland, has a role to play going forwards in identifying important knowledge and data gaps – particularly in relation to lived experiences – and working with rural/island local leads and other appropriate partners to support local action.
8. Enable Public Health Scotland to support the roll out of the child poverty data source and associated workshops to all local authorities (in collaboration with the Improvement Service when implementing recommendation 2).
In a rural/island context it is vital to develop local understanding of how well financial inclusion/referral pathways are working. The PHS child poverty data source and accompanying family-centred workshop methodology provide a robust approach for understanding how local services might better help children in need of support. The combination of guidance on data that can be analysed at a sub-local authority level and the participatory discussion of lived experiences of the local child poverty ‘system’ provides an excellent opportunity for any local authority with rural/island communities to improve how it helps low-income families.
This approach would support local authorities and other partners to evaluate and evidence progress without determining this by league table positions and trends in local authority level data.
9. Use the child poverty action reports strategically to understand and share best practice and provide additional support to those local authorities with less capacity to undertake local level data collection and analysis.
There is an opportunity to use the child poverty action reports more strategically to inform learning within and between local authorities, as well as to highlight the difference experiences of child poverty in rural/island contexts as compared to urban.
The results of the ongoing systematic review of the action reports by the SPIRU research team at Glasgow Caledonian University could be used to provide a cross-cutting basis for an overarching rural and island child poverty plan that is rooted in local knowledge and local action in these communities. The experiences documented in the local action reports provide a wealth of qualitative data on local initiatives and impacts, which will provide crucial evidence going forwards about ‘what works’ (this is also the focus of our second briefing). However, the existence of such a plan should not reduce the attention paid to rural and island experiences of child poverty in the second tackling child poverty delivery plan.
10. Set up a Rural and Island Child Poverty Unit (or similar) that places a strong emphasis on sharing knowledge and best practice between local leads (across sectors – health, education, transport, etc.), including the Improvement Service, PHS, SPIRU and other researchers.
The reduction of child poverty in rural Scotland requires both coordination (between departments and levels of government and with partners) and diversity (to reflect localised contexts and to develop place-based approaches). Therefore, the most notable opportunity in terms of addressing knowledge gaps is supporting continued working across government, agencies and partners to ensure a joined-up approach while also enabling action and knowledge exchange across a network of community planning partnerships at the local level.
A Rural and Island Child Poverty Unit (or similar) may provide the vehicle to promote a systematic, joined-up approach to working across government and with national and local partners to address any data gaps needed to support the reduction child poverty in rural and island areas. A joined-up group like this would be able to continue to work on key data challenges, including: the lack of information about welfare benefits eligibility and uptake in rural and island communities; the need for more meaningful rural/island population samples to be collected within national survey data; and encouraging and supporting lived experience data collection and mapping existing service provision/children’s journeys through support routes.
Based on the evidence and recommendations presented in this briefing, Figure 7 also suggests some opportunities for improving evidence/knowledge to support the delivery of current commitments in the Programme for Government.
Figure 7: Key points to consider going forwards (linked with current Programme for Government commitments)
A Land of Opportunity
Programme for Government commitment 2021-2022
Extend Scottish Child Payment to children under 16 by the end of 2022, and double it to £20 per week, per child as quickly as possible thereafter.
Provide immediate support to children and young people through Scottish Child Payment bridging payments of £520 in both 2021 and 2022.
Opportunities for improved evidence to support child poverty action in rural and island communities
The success of the Scottish Child Payment in reducing child poverty will depend on uptake of other benefits (Congreve, 2019). Applicants need to be in receipt of one or more welfare benefit to receive the SCP.
Receipt of the payment could help to strengthen the impact of planned and existing measures to reduce child poverty in rural and island areas by using it as a ‘gateway’ to other payments and services, and by ensuring that recipients are making full use of those which are in place.
This would need to be driven by effective design and rigorous monitoring, with additional arrangements for collaboration and data sharing about welfare eligibility and uptake to inform local partners.
Programme for Government commitment 2021-2022
Begin work on a Minimum Income Guarantee
Opportunities for improved evidence to support child poverty action in rural and island communities
The proposed Minimum Income Guarantee work needs to include a rural and island lens in its development.
Important considerations include the role that taxation could play (see Eiser, 2019) and the potential for Social Security Scotland to consider tax changes/nudges for employers offering flexible working hours, skills development, etc. in a rural/island context.
Interactions between child poverty and fiscal arrangements have complicated impacts on welfare eligibility that are also important to consider. The cost of living also needs to be factored in.
Programme for Government commitment 2021-2022
Invest £1 billion over this Parliament to tackle the poverty-related attainment gap.
Opportunities for improved evidence to support child poverty action in rural and island communities
Encourage those working on the poverty-related attainment gap to look beyond education and forge strong partnerships with health, transport and other local partners.
Recognising the lower level of understanding in rural schools of the challenges faced by pupils affected by poverty, there is potential to monitor and encourage new relationships between schools and other local organisations offering support to families experiencing financial hardship.
Programme for Government commitment 2021-2022
Deliver a package of support to tackle the cost of the school day, and ensure all children have access to the same opportunities.
Opportunities for improved evidence to support child poverty action in rural and island communities
Although there has been work on ‘the cost of the school day’ (see the CPAG toolkit, for example), there is scope to understand ‘the cost of the rural/island school day’ in more detail.
Programme for Government commitment 2021-2022
Work to expand funded early learning and childcare for children aged 1 and 2, starting with low-income households within this Parliament.
Build a system of wraparound school age childcare.
Opportunities for improved evidence to support child poverty action in rural and island communities
Although the broad challenges of rural/island childcare provision are quite well-documented, local childcare needs surveys are likely to help to design appropriate services in rural and island communities.
For example, a survey of local childcare need conducted by the Mull and Iona Community Trust in 2016 revealed a large proportion of respondents looking for childcare (53 of 117 responses).
An economy that works for all of Scotland’s people and places
Programme for Government commitment 2021-2022
Invest an additional £500 million to support the new, good and green jobs of the future, including upskilling and reskilling people to access those.
Help people get the skills they need to access the green jobs of the future.
Opportunities for improved evidence to support child poverty action in rural and island communities
Understand the combined contribution of UK, Scotland and local employability programmes at a rural and island local level (including data from the Parental Employability Support Fund).
Also understand and address any challenges related to delivery of these programmes in a rural/island setting (these are considered in the subsequent briefing).
Living better
Programme for Government commitment 2021-2022
Deliver 110,000 affordable homes across Scotland by 2032, with at least 70% in the social rented sector and 10% in our remote, rural and island communities supported by a Remote, Rural & Islands Action Plan.
Opportunities for improved evidence to support child poverty action in rural and island communities
Document the views/experiences of local leads about the impact of second homes/holiday lets in rural and island communities and how that distorts house prices in rural and island communities, leading to impacts on child poverty.
Opportunities for improved evidence to support child poverty action in rural and island communities
Start rolling out the £325 million Place Based Investment Programme, supporting community led regeneration.
Opportunities for improved evidence to support child poverty action in rural and island communities
An audit of community spaces in rural and island communities would help to inform an appropriate targeting of this fund.
Families experiencing disadvantage require access to support services that often use community meeting spaces, libraries, churches, etc. How best to engage these families in the development of these services is important but should also be mindful of the day-to-day pressures that may limit their capacity to engage.
Opportunities for improved evidence to support child poverty action in rural and island communities
Make sure our communities are well connected, investing in new and better public transport links and keeping ferry travel affordable for our islands.
Opportunities for improved evidence to support child poverty action in rural and island communities
Several interviewees noted that transport is the biggest barrier to increasing income from employment (the first driver of child poverty).
Continue to understand people’s experiences in relation to rural/island transport and invite suggestions for solutions (as in McHardy and Richardson, 2021).
Contact
Email: info@islandsteam.scot