Housing Statistics for Scotland Quarterly Update: New Housebuilding and Affordable Housing Supply (published 04 October 2022)
A summary of activity in new build housing, affordable housing and long term empty properties and second homes in Scotland.
6. Affordable housing supply
Affordable Housing Supply Programme statistics reflect the broader supply of affordable homes (i.e. for social rent, affordable rent and affordable home ownership), and include off the shelf purchases and rehabilitations as well as new builds. Latest statistics are available up to the end of June 2022.
The statistics reflect the number of affordable homes delivered that have received some form of government support through loans, grant or guarantees.
Approvals, starts and completions are all measured for the Affordable Housing Supply Programme. Approval is the point at which funding is granted. Starts are recorded when an on-site presence is established to progress site work. Completion measures when the units are delivered and ready for occupation.
- Social Rent includes Housing Association Rent, Council House Rent as well as Home Owner Support Fund Rent.
- Affordable Rent includes Mid-Market Rent (MMR), National Housing Trust (NHT) Rent as well as other programmes such as the Empty Homes Loan Fund (EHLF) and Rural Homes for Rent (RHfR).
- Affordable Home Ownership includes Open Market Shared Equity (OMSE), New Supply Shared Equity (NSSE), Shared Ownership (LCHO) as well as other programmes such as Home Owner Support Fund Shared Equity.
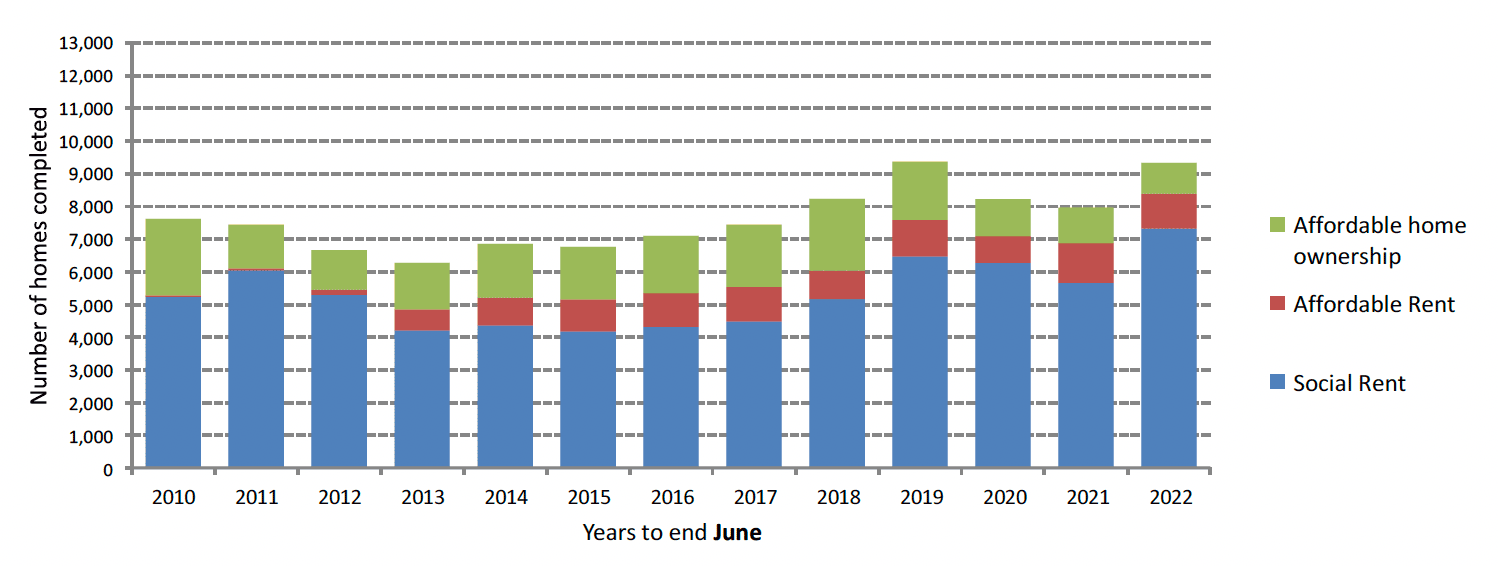
Chart 11 below shows that the numbers of affordable homes completed has increased on an annual basis over the latest year to end June 2022, whilst the number of home approved has dropped slightly and the number of homes started has decreased significantly. In the year to end June 2022, 7,775 affordable homes were approved, a slight decrease of 3% (202 homes) on the previous year, and 7,287 homes were started, a decrease of 35% (3,881 homes). A total of 9,334 homes were completed, an increase of 17% (1,365 homes).
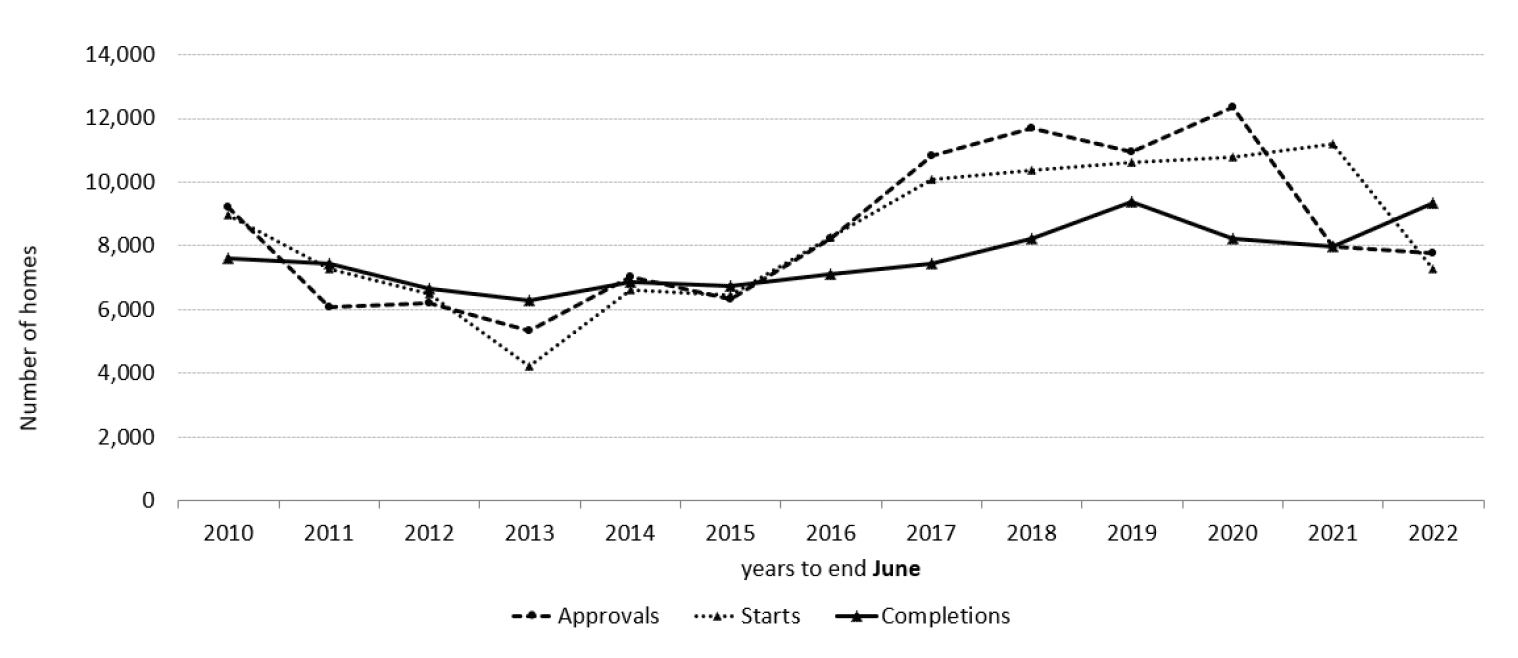
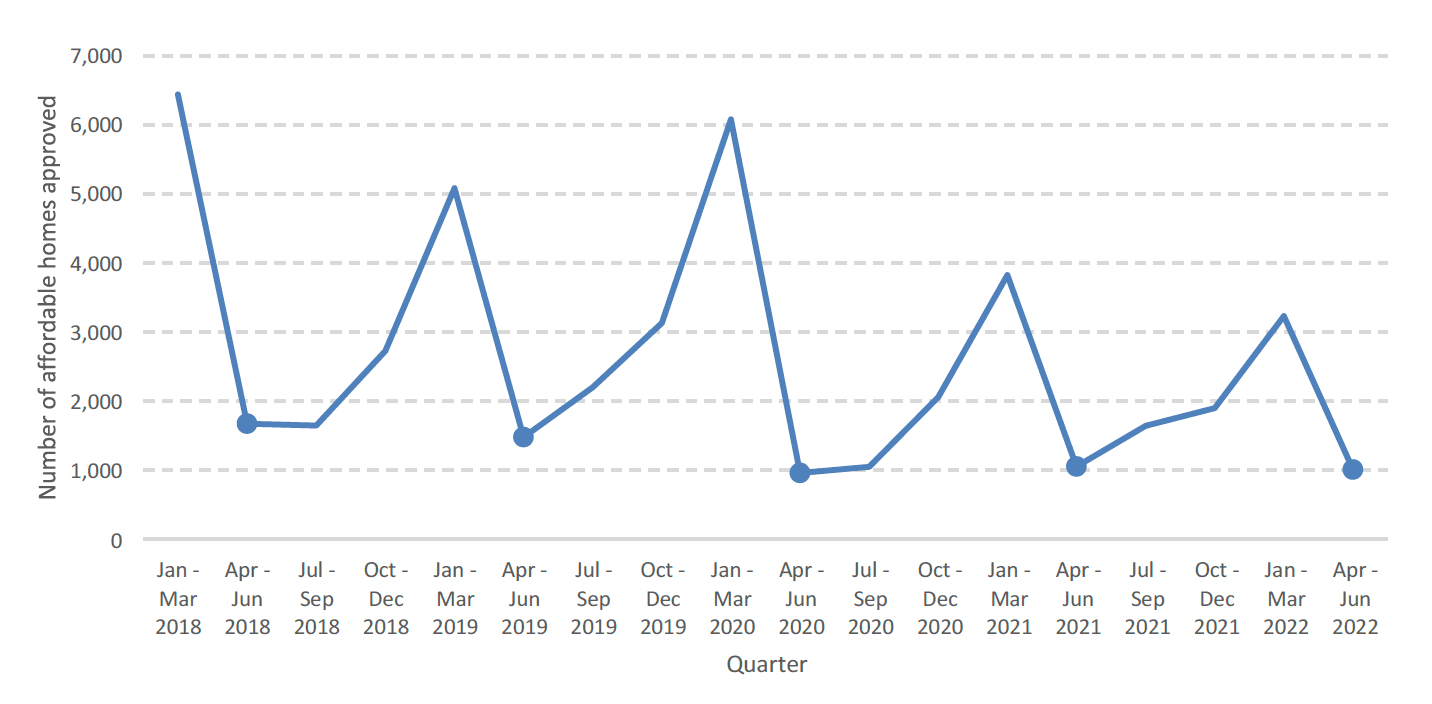
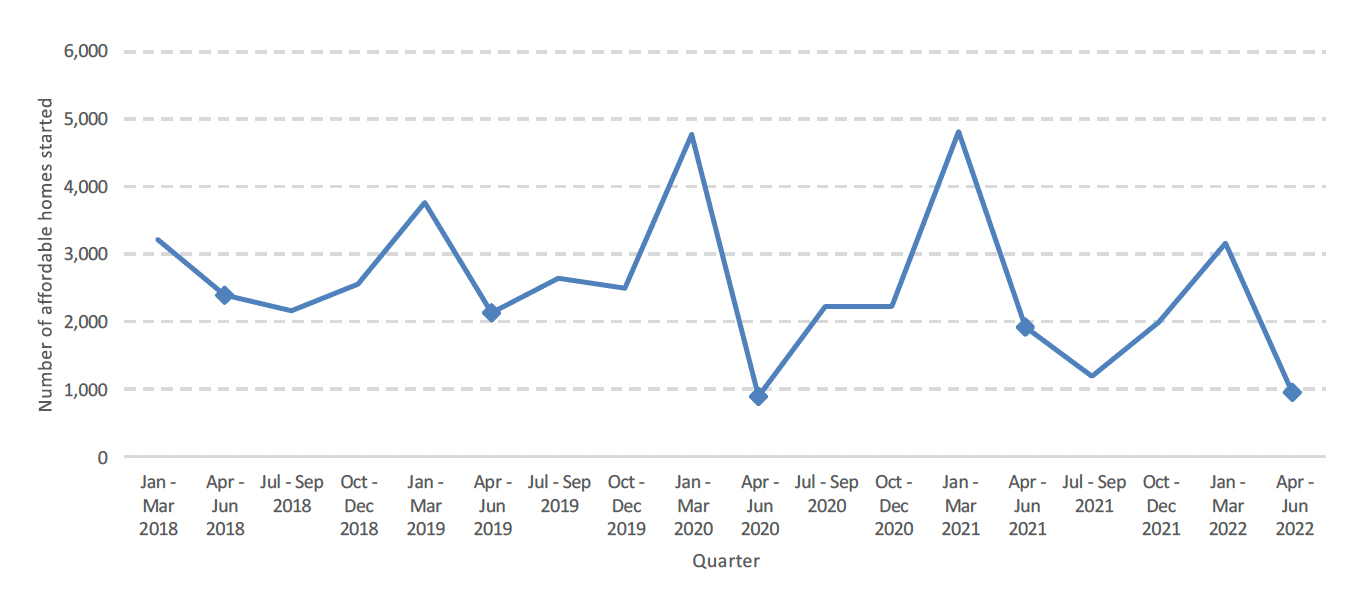
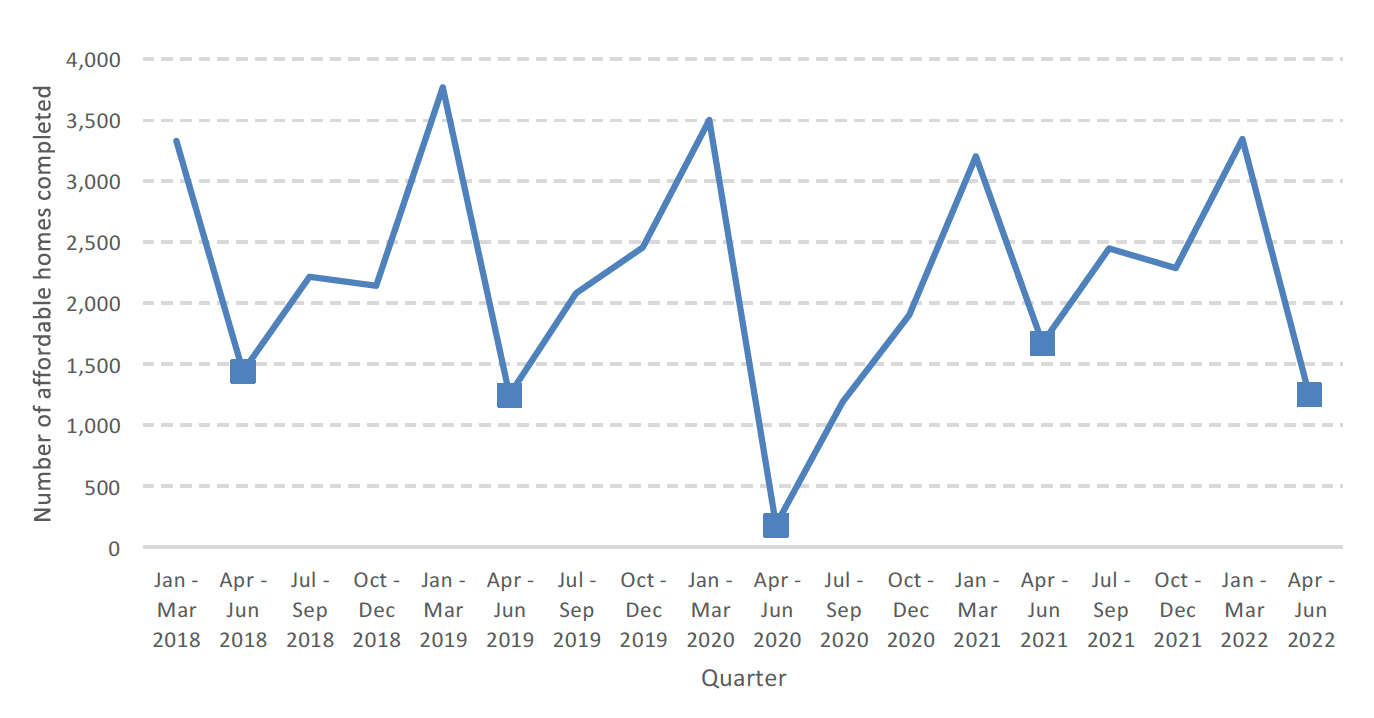
Table 6 below shows that in the latest quarter April to June 2022, 1,005 homes were approved, 951 homes were started, and 1,250 homes were completed. The levels of approvals, starts and completions are all lower than in the same period in the previous year, with approvals being 4% (46 homes) lower and starts being 50% (966 homes) lower, and completions being 25% (423 homes) lower than in April to June 2021.
Over the latest 12 months to end June 2022, the number of homes approved dropped slightly by 3% (203 homes) to 7,775 approvals, the number of homes started decreased by 35% (3,881 homes) to 7,287 starts, whilst completions increased by 17% (1,365 homes) compared to the previous year.
| Affordable housing supply homes | Approvals | Starts | Completions |
|---|---|---|---|
| Quarter Apr to Jun 2016 | 1,192 | 1,886 | 1,783 |
| Quarter Apr to Jun 2017 | 1,286 | 2,523 | 909 |
| Quarter Apr to Jun 2018 | 1,675 | 2,394 | 1,443 |
| Quarter Apr to Jun 2019 | 1,476 | 2,128 | 1,248 |
| Quarter Apr to Jun 2020 | 958 | 890 | 182 |
| Quarter Apr to Jun 2021 | 1,051 | 1,907 | 1,673 |
| Quarter Apr to Jun 2022 | 1,005 | 951 | 1,250 |
| Change over latest year | -46 | -956 | -423 |
| Change (%) over latest year | -4% | -50% | -25% |
| Year to Jun 2016 | 8,214 | 8,251 | 7,102 |
| Year to Jun 2017 | 10,814 | 10,079 | 7,447 |
| Year to Jun 2018 | 11,705 | 10,389 | 8,233 |
| Year to Jun 2019 | 10,928 | 10,603 | 9,371 |
| Year to Jun 2020 | 12,362 | 10,801 | 8,224 |
| Year to Jun 2021 | 7,978 | 11,168 | 7,970 |
| Year to Jun 2022 | 7,775 | 7,287 | 9,334 |
| Change over latest year | -203 | -3,881 | 1,364 |
| Change (%) over latest year | -3% | -35% | 17% |
Charts 12a to 12c below present quarterly trends in the number of approvals, starts and completions from January 2018 up to end June 2022.
Charts 13 to 15 below present information on trends in affordable housing supply by type.
Chart 13 shows that total affordable housing supply programme approvals decreased slightly by 3% between 2021 and 2022 (years to end June). In the latest year 2022, social rent approvals accounted for 78% of all approvals, with affordable rent and affordable home ownership making up 12% and 11%, respectively.
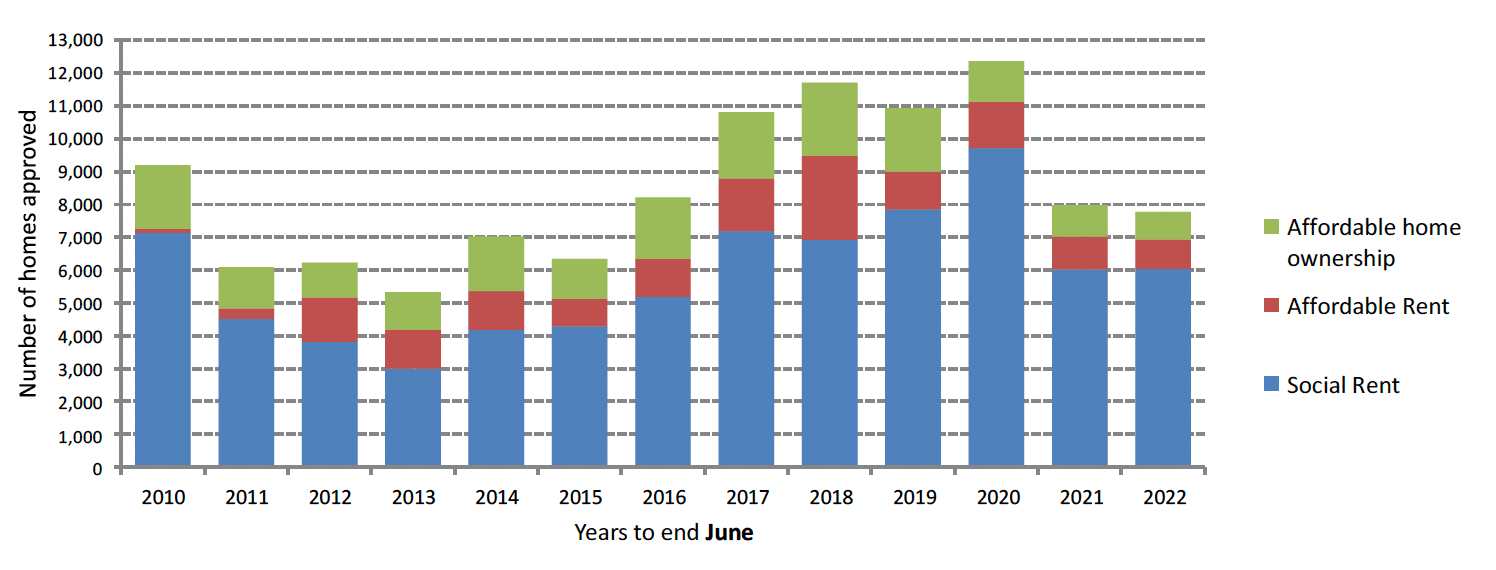
Chart 14 shows that total affordable housing supply programme starts decreased by 35% (3,881 homes) between 2021 and 2022 (years to end June). In the latest year 2022, social rent approvals accounted for 80% of all approvals, with affordable rent and affordable home ownership making up 9% and 11%, respectively
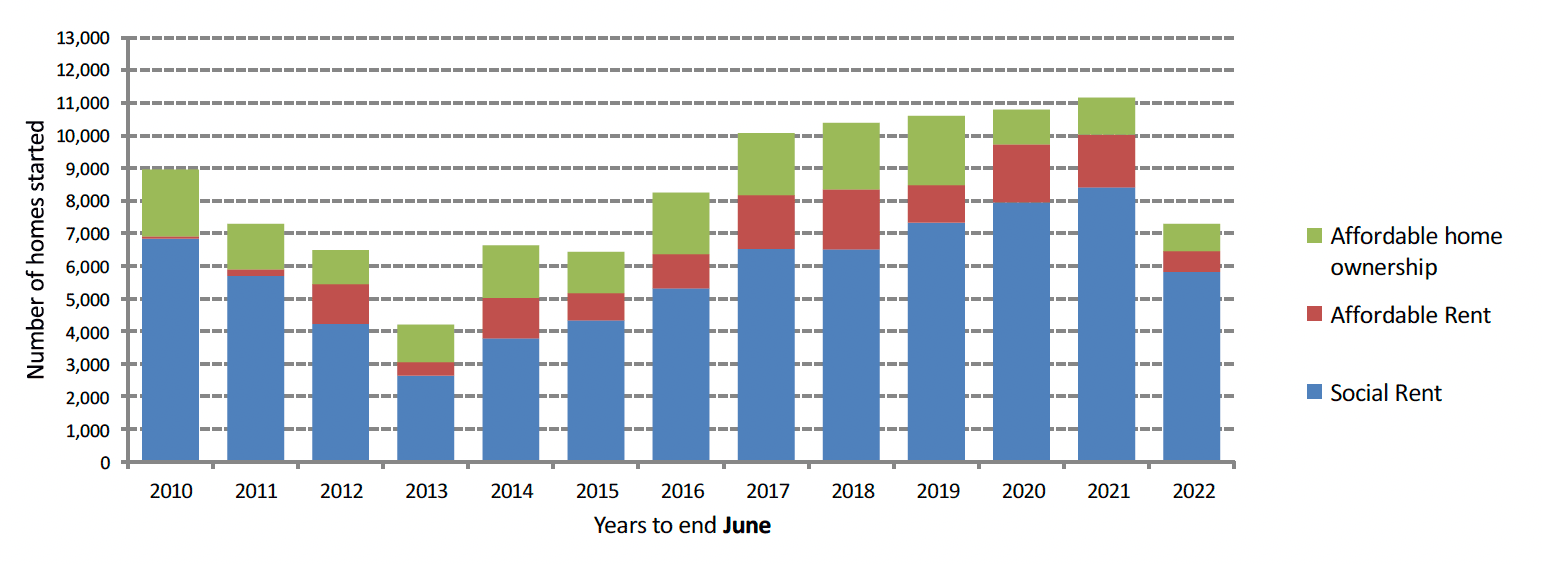
Chart 15 shows that total affordable housing supply programme completions increased by 17% (1,364 homes) between 2021 and 2022 (years to end June). In the latest year, social rent completions accounted for 78% of all completions, with affordable rent and affordable home ownership making up 12% and 10% of the total.
Quarterly affordable housing supply statistics are used to inform progress against Scottish Government affordable housing delivery targets, in which the ambition is to deliver 110,000 affordable homes by 2032, of which at least 70% will be for social rent and 10% will be in remote, rural and island communities.
There have been a total of 2,362 completions so far against the 110,000 target, across the period 23 March 2022 to 30 June 2022, consisting of 2,068 homes for social rent, 127 for affordable rent, and 167 for affordable home ownership.
The Scottish Government Affordable Housing Supply Programme policy area webpages also include annual Out-Turn Reports, which provide further detailed programme information for each financial year. The 2021-22 Out-Turn Report will be published towards the end of this year.
Figures on the remote, rural and island communities element of the 110,000 target are planned to be reported on as part of future annual out-turn reports, although we are considering whether it is feasible for these figures to be reported on a quarterly basis in addition to this.
Affordable housing supply across UK countries
Chart 16 below illustrates how affordable housing supply figures per 10,000 population have varied on a financial year basis across the 2007/08 to 2020/21 period for England, Wales and Northern Ireland, and 2021/22 for Scotland.
Across the 14 years between 2007/08 and 2020/21, the annual average supply of affordable housing per head of population in Scotland has been 13.9 homes per 10,000 population, higher than England (9.7 homes per 10,000 population), Wales (8.0 homes per 10,000 population), and Northern Ireland (13.0 homes per 10,000 population – average across the years 2010/11 to 2020/21).
Scotland has had a higher rate of supply than all other UK countries across each year 2015/16 to 2019/20, although the rate dropped below the rate for Northern Ireland in the year 2020/21.
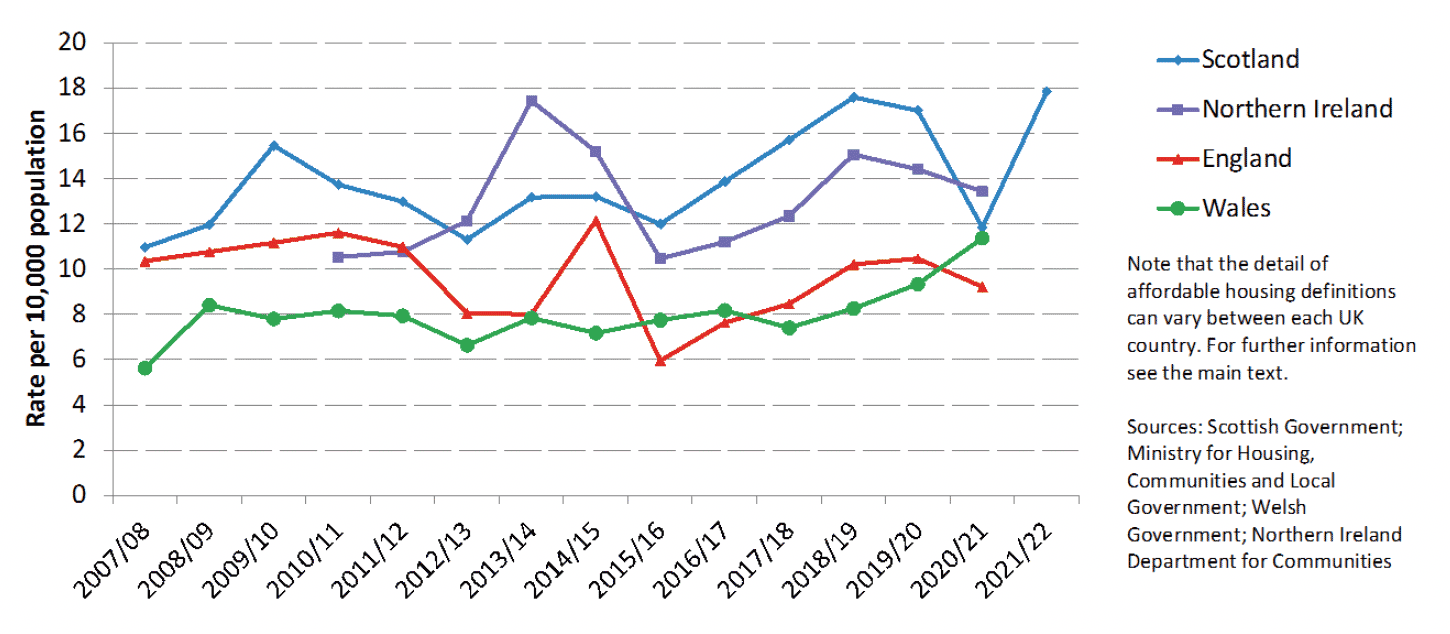
In addition to the differences in total affordable supply between each country, there are also some differences in the use of different affordable housing products within the mix of overall affordable housing in each country. For example, in England in recent years there has been a greater use of affordable / intermediate rent compared to social rent. Therefore when looking over the four years to 2020/21, in England there have been on average 5.1 affordable / intermediate rent homes completed per 10,000 head of population and 1.2 social rented homes completed 10,000 per-head of population. This compares to a rate of 1.8 for affordable rent homes and a rate of 10.8 for social rented homes in Scotland.
Note that the statistics for England and Wales both include developer-funded Section 106 supply, although for England it is thought that some will be missed as local authorities are not aware of it all. Northern Ireland does not currently have an equivalent mechanism. Data for Scotland include Section 75 units receiving some form of government funding. Data are not available to estimate the number of affordable homes delivered without central government funding in Scotland, but it is thought that the numbers of these homes may be relatively low based on current estimates of the number of funded Affordable and Section 75 homes being delivered.