Housing Statistics for Scotland Quarterly Update: New Housebuilding and Affordable Housing Supply (published 04 October 2022)
A summary of activity in new build housing, affordable housing and long term empty properties and second homes in Scotland.
2. All-sector new housebuilding
Chart 1 on page 1 shows that annual all-sector new build starts and completions in the years to end March both showed a broadly decreasing direction of trend following the financial crisis in 2008. Starts fell to a low in 2011 and completions reached their lowest point in 2013. Following this, starts and completions have then generally increased year on year, reaching a peak in the year ending March 2020, before dropping in the year to end March 2021 due to the impact of COVID-19 lockdown measures.
Starts and completions have since picked up in the year to end March 2022 following the easing of these restrictions, with starts up by 5% and completions up by 40%, to stand at 18,672 and 20,767 homes respectively. Private-led completions rose by 29% (3,157 homes), local authority completions increased by 87% (1,256 homes), and housing association completions rose by 63% (1,488 homes). Increases were seen across private-led starts (3% or 430 homes) and local authority starts (43% or 585 homes), whilst housing association approvals fell by 4% or 101 homes).
Chart 2 below presents the latest quarterly trends in completions to end March 2022, in which there were 5,226 all-sector completions in the latest quarter January to March 2022. This is an increase of 6% (319 homes) on the 4,907 completions in the same quarter in 2021.
The 3,241 private sector led completions in January to March 2022 is a decrease of 5% (165 homes) on the 3,406 completions in the same quarter in 2021.
The 870 local authority completions in January to March 2022 is more than double (456 homes) the 414 completions in the same quarter in 2021.
Meanwhile the 1,115 housing association completions in January to March 2022 is an increase of 3% (28 homes) on the 1,087 completions in the same quarter in 2021.
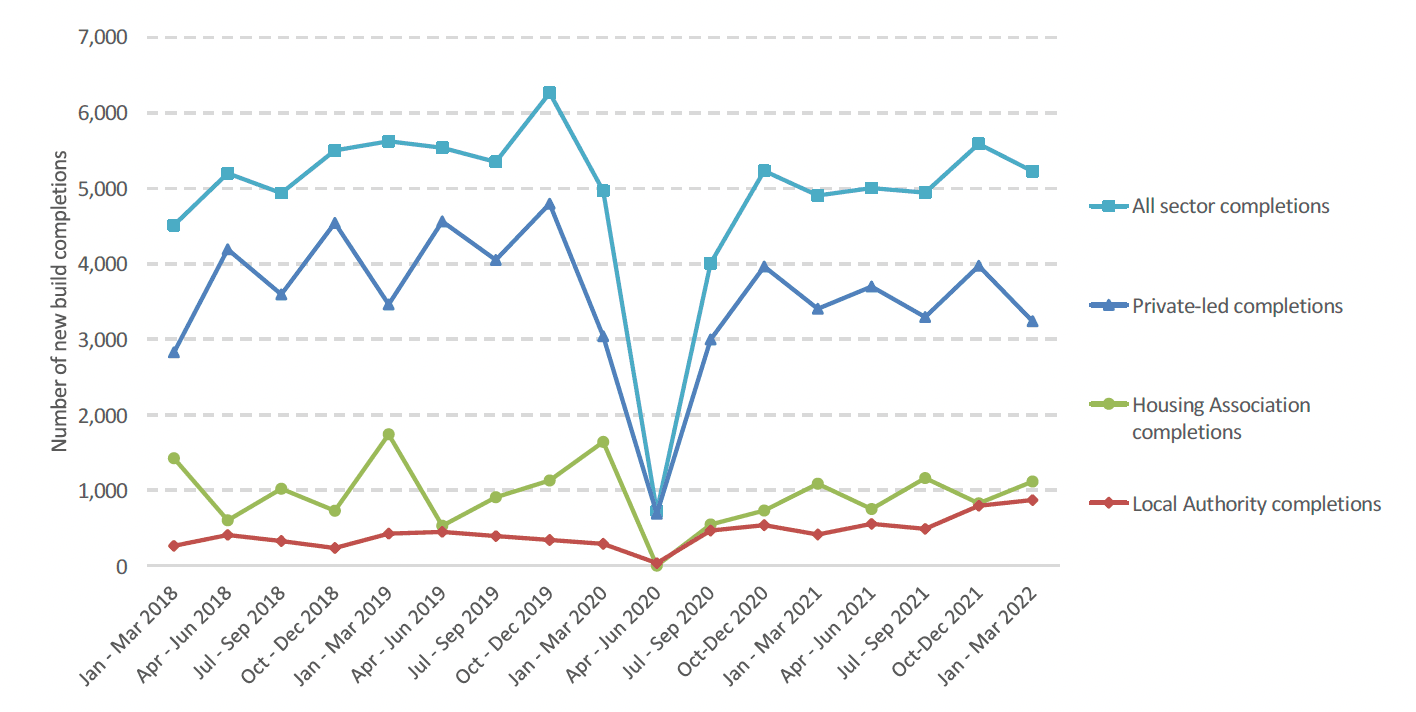
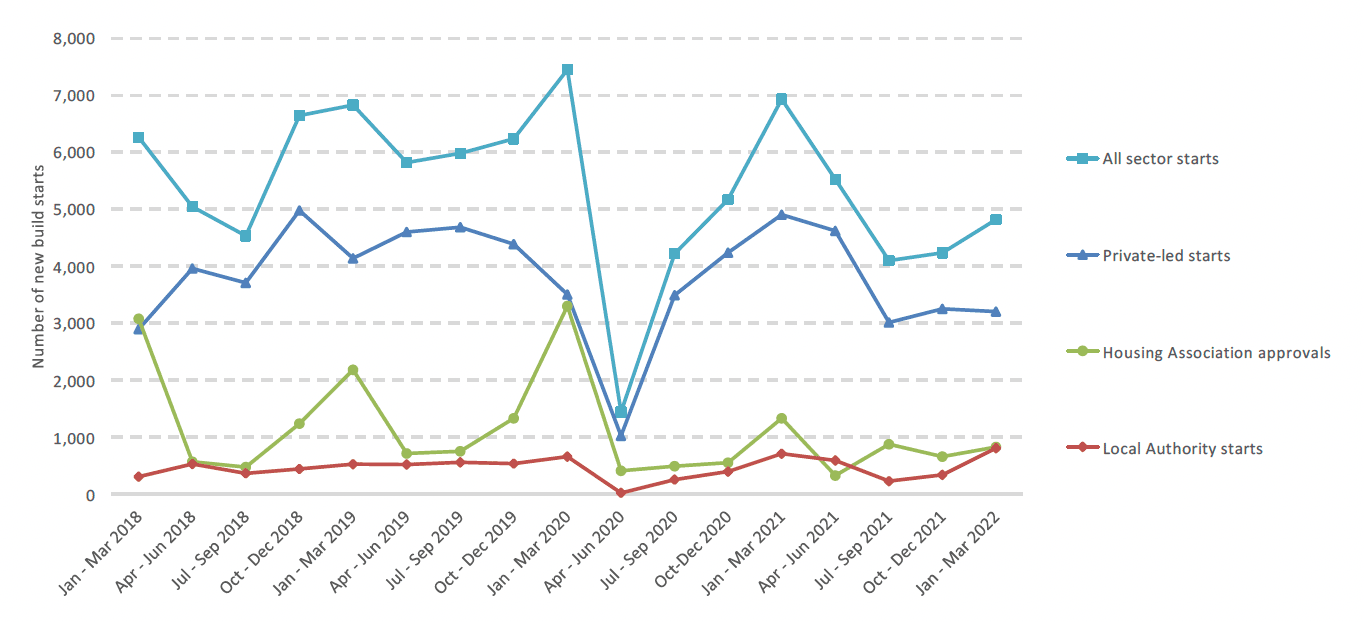
Chart 3 shows the quarterly trends in starts, in which there were 4,820 all-sector starts in the latest quarter January to March 2022. This is a decrease of 30% (2,114 homes) on the 6,934 starts in the same quarter in 2021.
The 3,199 private sector led starts in January to March 2022 is a decrease of 35% (1,704 homes) on the 4,903 starts in the same quarter in 2021.
The 802 local authority starts in January to March 2022 is an increase of 14% (98 homes) on the 704 starts in the same quarter in 2021.
Meanwhile the 819 housing association approvals in January to March 2022 is a decrease of 38% (508 homes) on the 1,327 approvals in the same quarter in 2021.
| All sector homes | Starts | Completions |
|---|---|---|
| Quarter Jan to Mar 2019 | 6,829 | 5,626 |
| Quarter Jan to Mar 2020 | 7,452 | 4,968 |
| Quarter Jan to Mar 2021 | 6,934 | 4,907 |
| Quarter Jan to Mar 2022 | 4,820 | 5,226 |
| Change from Q1 2021 to Q1 2022 | -2,114 | 319 |
| Change from 2021 to 2022 (%) | -30% | 6% |
| Year to Mar 2019 | 23,047 | 21,267 |
| Year to Mar 2020 | 25,491 | 22,124 |
| Year to Mar 2021 | 17,758 | 14,867 |
| Year to Mar 2022 | 18,672 | 20,767 |
| Change from 2021 to 2022 (%) | 914 | 5,900 |
| Change from 2021 to 2022 (%) | 5% | 40% |
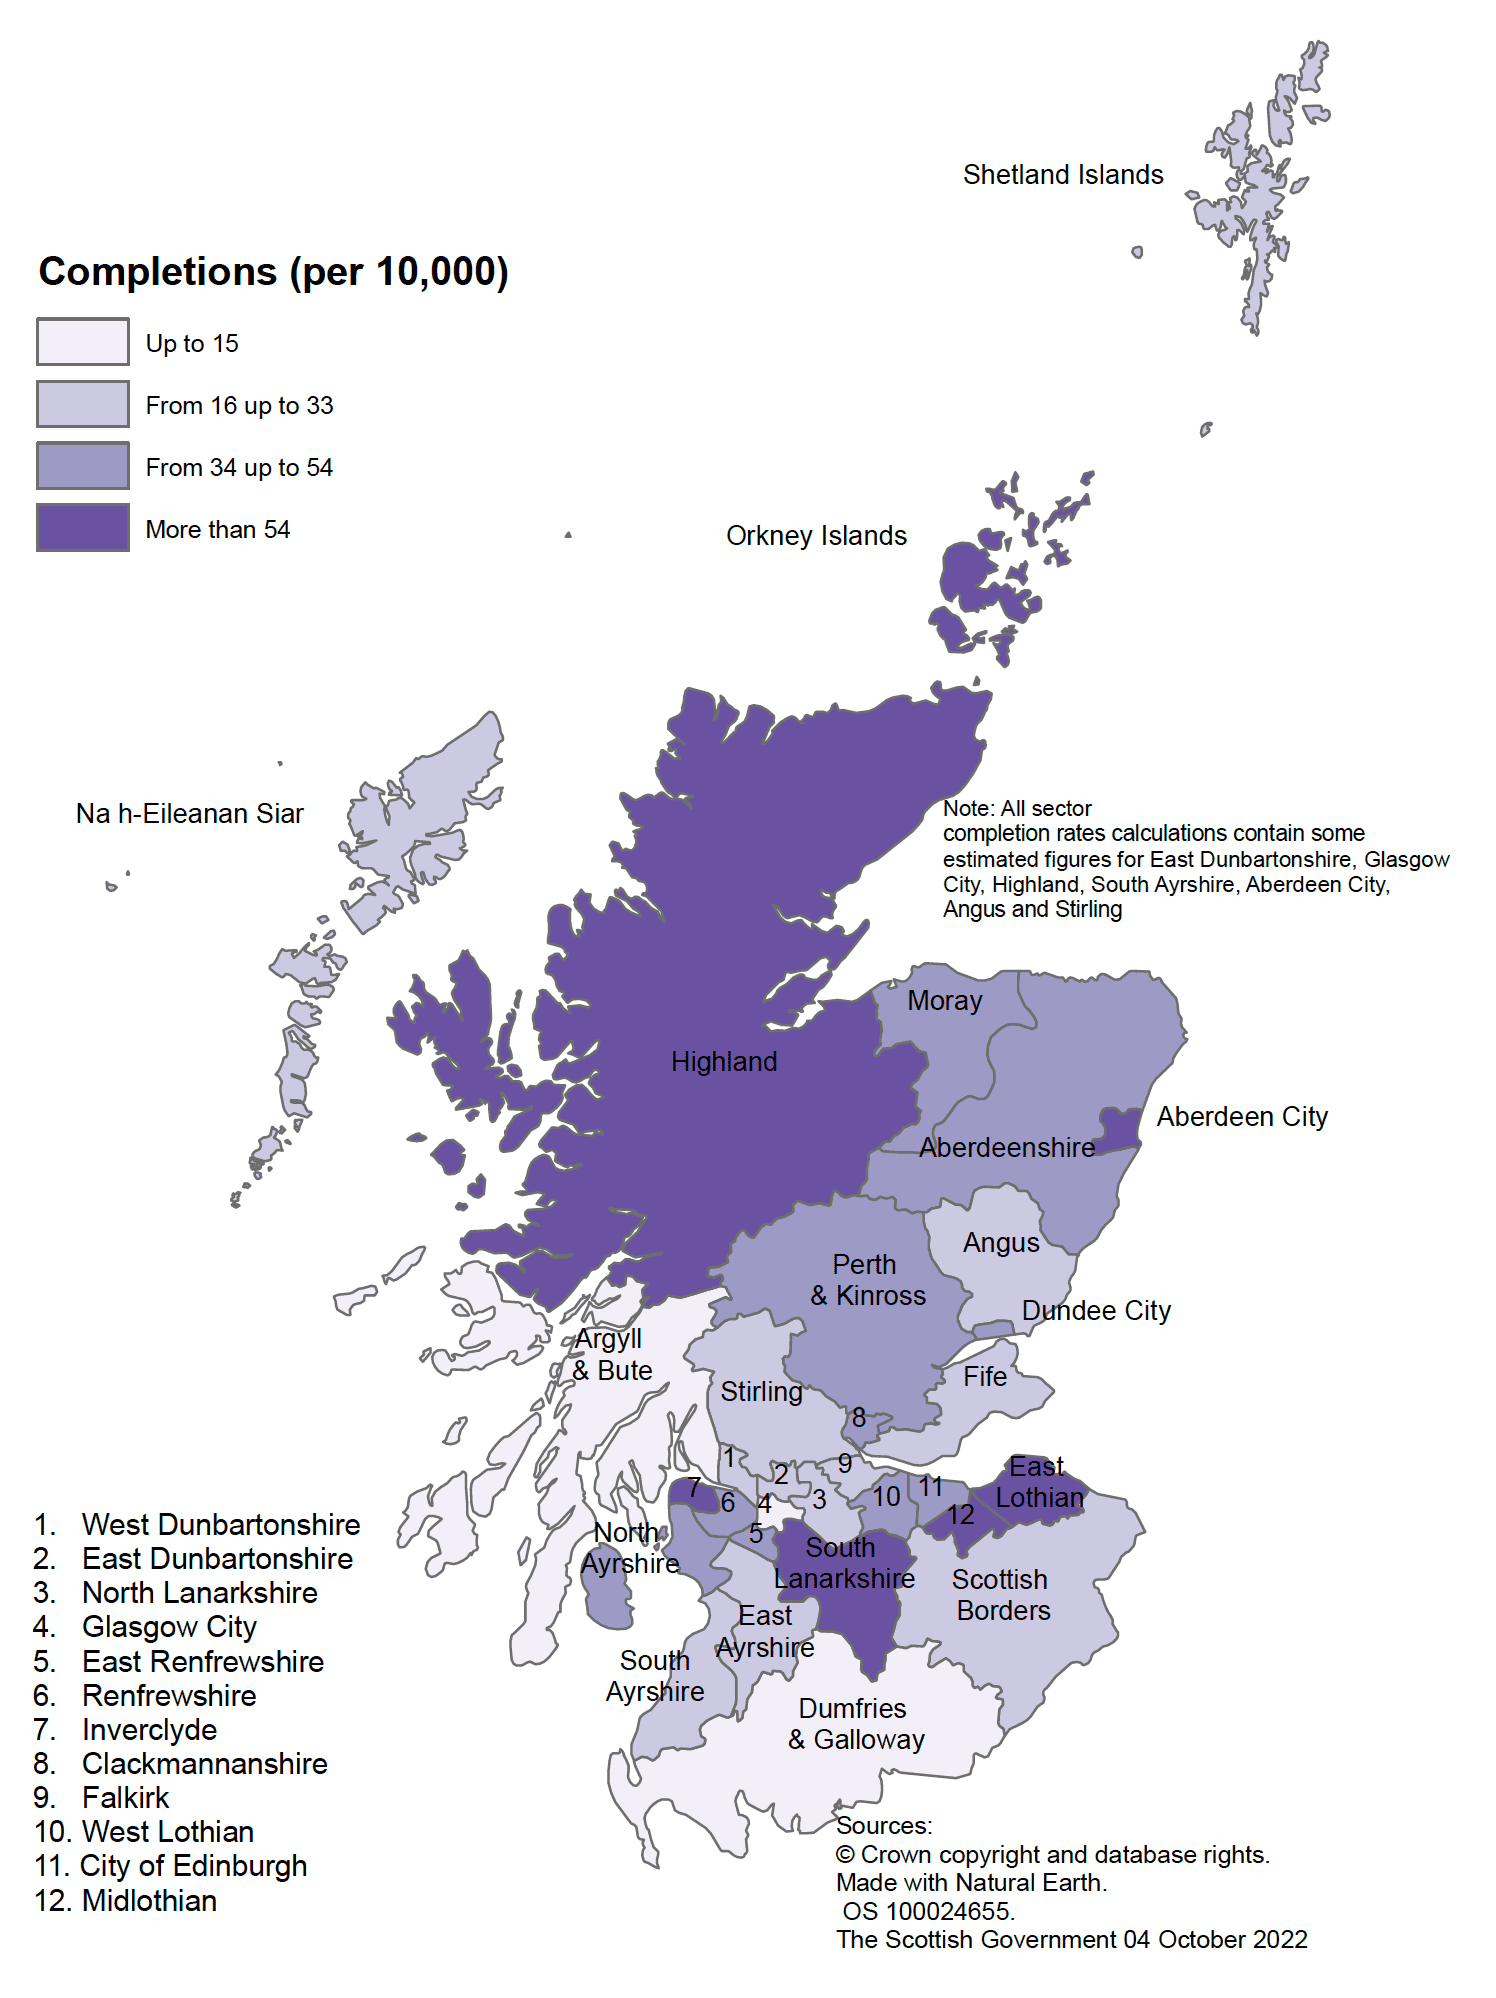
Map A below shows that in the year to end March 2022, the highest new build rates were observed in the local authority areas of Midlothian, Aberdeen City, Highland, East Lothian, South Lanarkshire, Orkney Islands, Inverclyde, and Perth & Kinross, which had rates of more than 54 homes per 10,000 population.
The lowest rates were observed in Dumfries & Galloway and Glasgow City,which had rates of 15 homes or fewer per 10,000 population.
Note that the all-sector completion rates calculations contain some estimated figures. Estimated figures have been used for private sector completions for Glasgow City Council from April to June 2021, East Dunbartonshire and South Ayrshire from October to December 2021, and Angus and West Dunbartonshire for January to March 2022.. Local authority completions are estimated for Highland from April to June 2021, and East Dunbartonshire for January to March 2022.
New housebuilding across UK countries
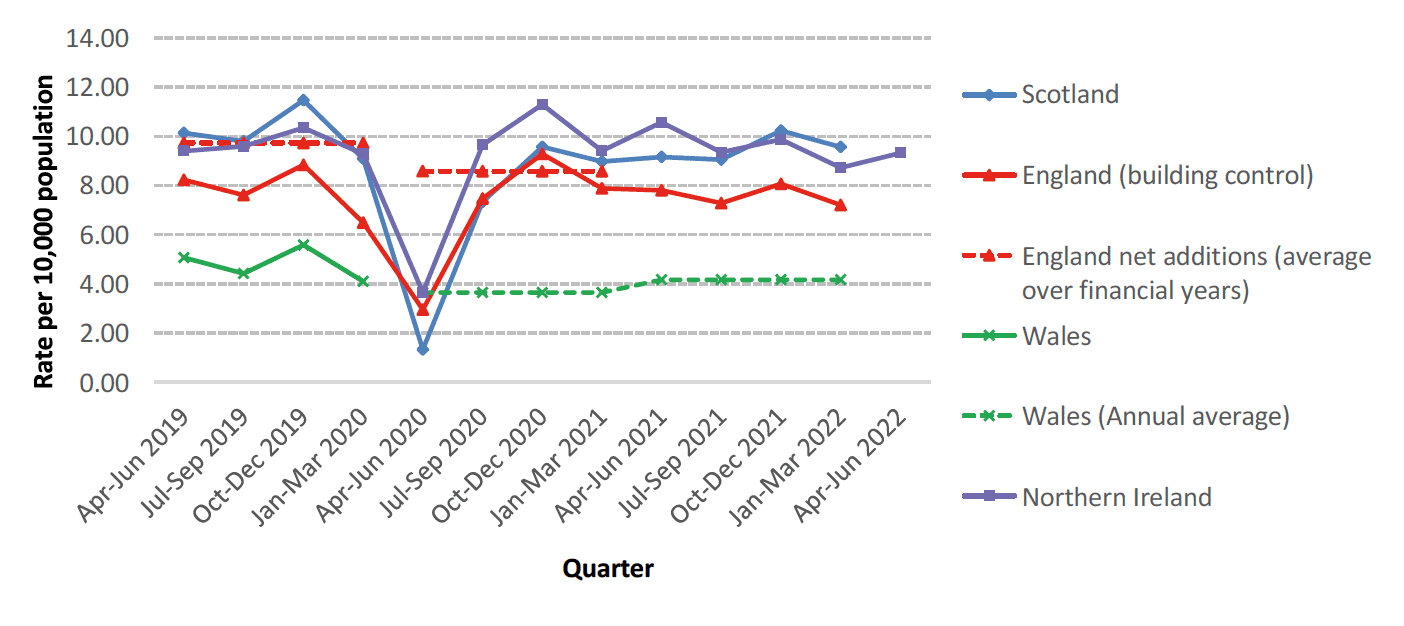
Chart 4a presents trends in the rates of new housebuilding completions per 10,000 population across each of the UK countries on a financial year basis (years to end March) to allow for comparisons with both the England financial year 'net additional dwelling' statistics and financial year rates derived from each of the quarterly UK series.
The England financial year 'net additional dwellings' series is considered the primary and most comprehensive measure of housing supply in England. However, this is not yet available for the latest financial year, with latest figures expected in November 2022. The quarterly new build statistical collection for England is not currently capturing all new build activity, and so is seen more as a leading indicator of activity throughout the year.
The chart shows that whilst Scotland had a higher rate of completions per 10,000 head of population than England over the period 2006/07 to 2013/14, that Scotland and England have seen broadly similar rates of housebuilding each year across the period 2014/15 to 2019/20, when comparing the Scotland figures to the England net addition figures. Whilst all four countries have seen a decrease from 2019/20 to 2020/21 due to the impacts of COVID-19, Scotland has seen a sharper fall in 2020/21, down to a rate of 27 homes per 10,000 population, which may be due to the stricter lockdown restrictions that were in place for housing building in Scotland.
Figures for 2021/22 show that in Scotland, Northern Ireland, and Wales, the completions rate increased from the previous year, with Scotland having the largest increase, up to 38 homes per 10,000 population. This is slightly below Northern Ireland's rate of 39 per 10,000, and above the rate of 17 for Wales. The building control based figures for new housebuilding in England show an increase from the previous financial year as well.
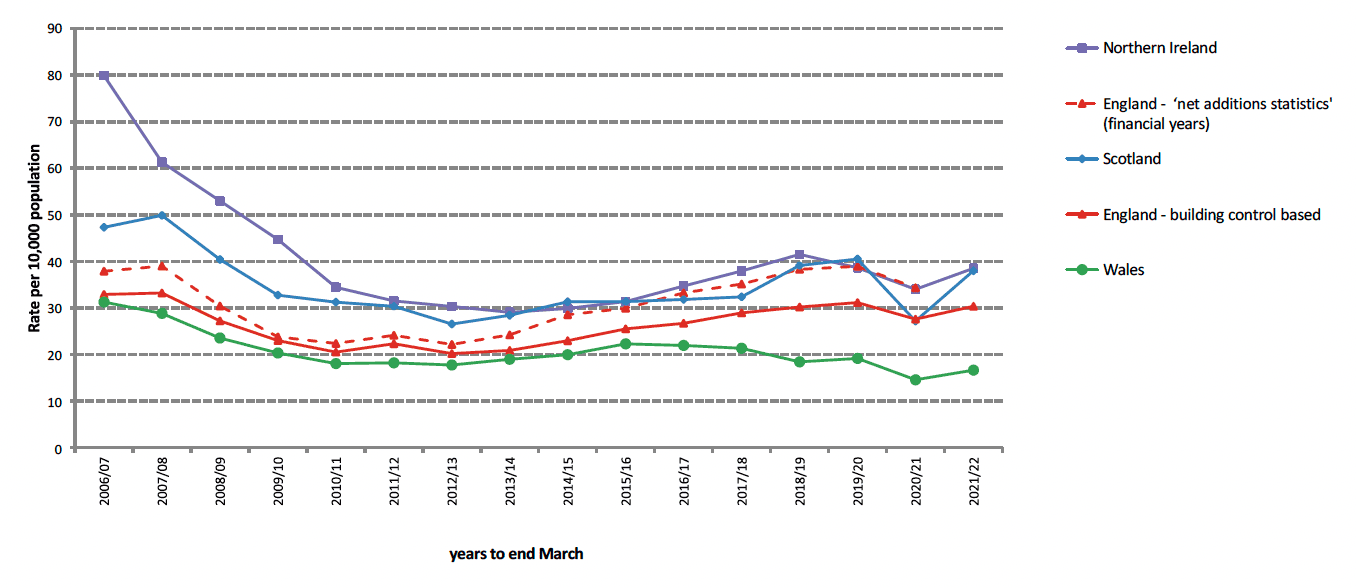
Chart 4b presents more recent trends in the rates of new housebuilding completions per 10,000 population across each of the UK countries on a quarterly basis1, based on the latest published information available for each country. The England 'net additional dwelling' figures for the financial years 2019/20 and 2020/21 are also included as averages across each of the quarters within these years, to help demonstrate the difference in the relative level between this figure and the separate quarterly England building control based figures.
The chart shows the clear impact of COVID-19 lockdown restrictions on construction activity in the quarter April to June 2020, with the rates of new housebuilding per 10,000 population dropping compared to the same in quarter in the previous year by 87% in Scotland, 64% in England (building control based figures), and 61% in Northern Ireland, which may reflect stricter lockdown restrictions for Scottish housing building compared to England and Northern Ireland.
Following this, the rates of new housebuilding in each of these countries subsequently increased back up to higher levels, although the available quarterly rates for England and Northern Ireland have shown a slight downward trend over the quarters following the October to December 2020 quarter, whilst the rate in Scotland has shown a more steady trend, although is at a slightly lower level than in 2019.