Housing Statistics for Scotland Quarterly Update: New Housebuilding and Affordable Housing Supply (published 04 October 2022)
A summary of activity in new build housing, affordable housing and long term empty properties and second homes in Scotland.
4. UK House Price Index (HPI) new build sales transactions, as a measure of private-led housebuilding activity to end May 2022
This section sets out the latest quarterly and monthly trends in the number of new build sales transactions in Scotland to end May 2022, based on residential property transaction figures published as part of the UK House Price Index (HPI) .
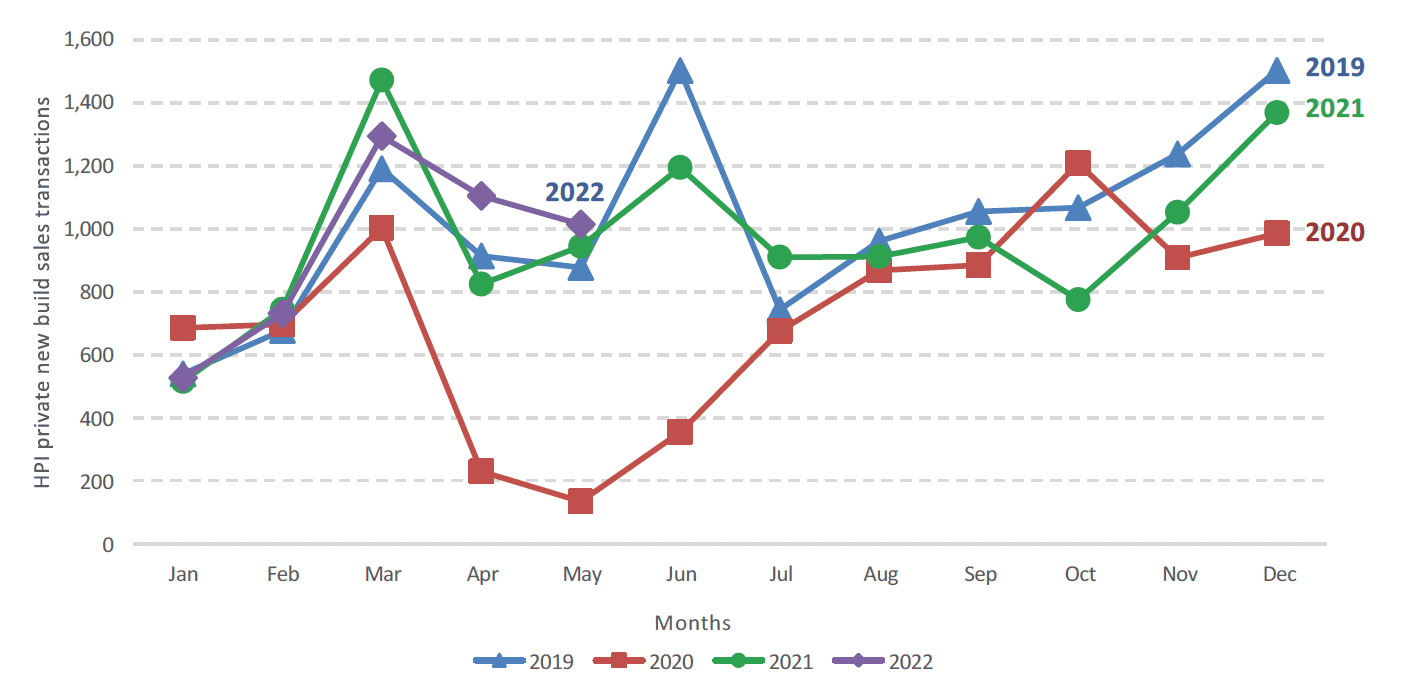
The HPI figures show that there were 2,551 new build sales transactions in Scotland in the latest quarter January to March 2022, a decrease of 7% (180 transactions) on the 2,731 transactions seen in the same quarter in 2021.
More recent HPI figures for the month of May 2022 show a total of 1,014 transactions for this month (see Chart 7a). This brings the total transactions in the year to end May 2022 to 11,850, an increase of 14% (1,473 transactions) on the 10,382 transactions recorded in the year to end April 2021.
It should be noted that the HPI-based figures are not directly comparable to the Scottish Government time series on private-led new build starts and completion, due to some differences in how the two sets of figures are constructed. For example, the UK HPI new build sales transaction figures are based on the date of the completed sales transaction rather than the date of completion, and will also not include self-build dwellings or homes built privately for tenures other than private sales.
Further information on the quality of the HPI data for Scotland, which is sourced from Registers of Scotland, is available in the UK HPI Quality Assurance section of the UK House Price Index web page.
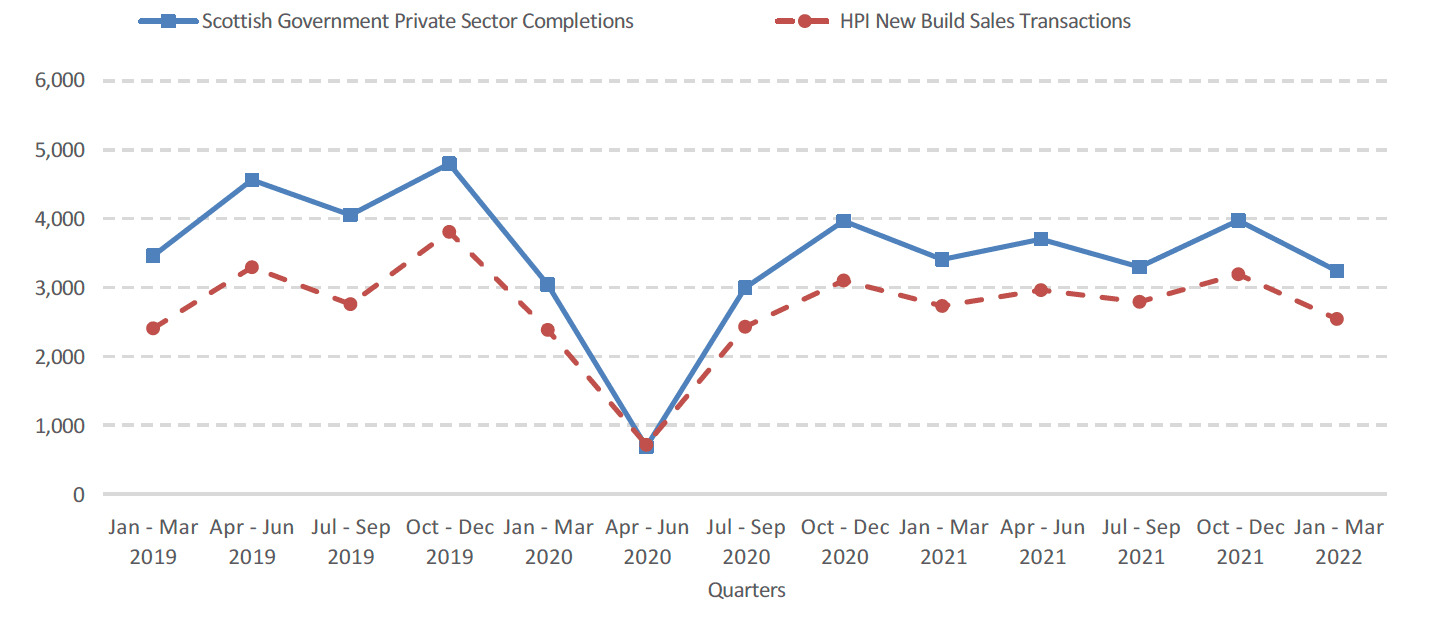
Table 3 and Chart 7b below illustrate how the UK HPI figures compare to Scottish Government Private sector-led completion figures in each quarter from January to March 2019 onwards.
It can be seen across the period January to March 2019 to January to March 2022 that both data series follow broadly similar trends in respect of increases or decreases compared to the previous quarter. The Scottish Government figures are higher in most quarters, but this is likely to be explained by differences in how the figures are constructed, given that some self-build dwellings or dwellings built privately for tenures other than private sales will be included, whereas the HPI figures are based on private sale transactions only.
| Quarter or year | HPI New Build Sales Transactions Volume | Scottish Government Private-led completions |
|---|---|---|
| Jan – Mar 2019 | 2,407 | 3,461 |
| Apr – Jun 2019 | 3,293 | 4,563 |
| Jul – Sep 2019 | 2,759 | 4,052 |
| Oct – Dec 2019 | 3,807 | 4,797 |
| Jan – Mar 2020 | 2,385 | 3,040 |
| Apr – Jun 2020 | 717 | 687 |
| Jul – Sep 2020 | 2,428 | 2,996 |
| Oct – Dec 2020 | 3101 | 3,965 |
| Jan – Mar 2021 | 2,731 | 3,406 |
| Apr - Jun 2021 | 2,963 | 3,700 |
| Jul – Sep 2021 | 2,795 | 3,296 |
| Oct – Dec 2021 | 3,196 | 3,974 |
| Jan – Mar 2022 | 2,551 | 3,241 |
| Change from previous quarter | -645 | -733 |
| Change (%) from previous quarter | -20% | -18% |
| Change from same quarter in previous year | -180 | -165 |
| Change (%) from same quarter in previous year | -7% | -5% |