Housing Statistics for Scotland Quarterly Update: New Housebuilding and Affordable Housing Supply (published 04 October 2022)
A summary of activity in new build housing, affordable housing and long term empty properties and second homes in Scotland.
5. Social sector new housebuilding
Social sector housing consists of local authority and housing association housing, and has accounted for around a third (32%) of all new build homes completed over the 12 months to the end of March 2022.
Chart 8a shows the number of local authority and housing association homes started and completed each year to end March. Between 2009 and 2010 the number of housing association completions increased from almost 4,600 to nearly 5,700, after which the number of homes completed dropped most years until reaching a low of around 2,300 in 2016. Following this, housing association completions increased after 2017, to just over 4,200 in 2020. Housing association completions then dropped to around 2,400 in 2021, with completions in this year being affected by COVID-19 lockdown measures, before increasing again to over 3,800 in the year to end March 2022.
Housing association new build approvals fell between 2009 and 2013, to a low of around 1,600, before trending up to over 6,000 in 2020. This then fell to almost 2,800 in 2021, and then in the 12 months ending March 2022, fell again slightly to under 2,700.
The number of local authority homes built gradually increased from around 300 homes in 2009 up to just over 1,100 in 2012 (years to end March). Completions then dropped slightly to just over 1,000 in 2011, after which they rose to almost 1,500 in 2020. Completions stayed around this level in 2021, before rising to just over 2,700 in the year to end March 2022. Local authority new build starts have followed a generally similar pattern to that of completions, starting around 250 in 2009, and reaching around 1,900 in 2022.
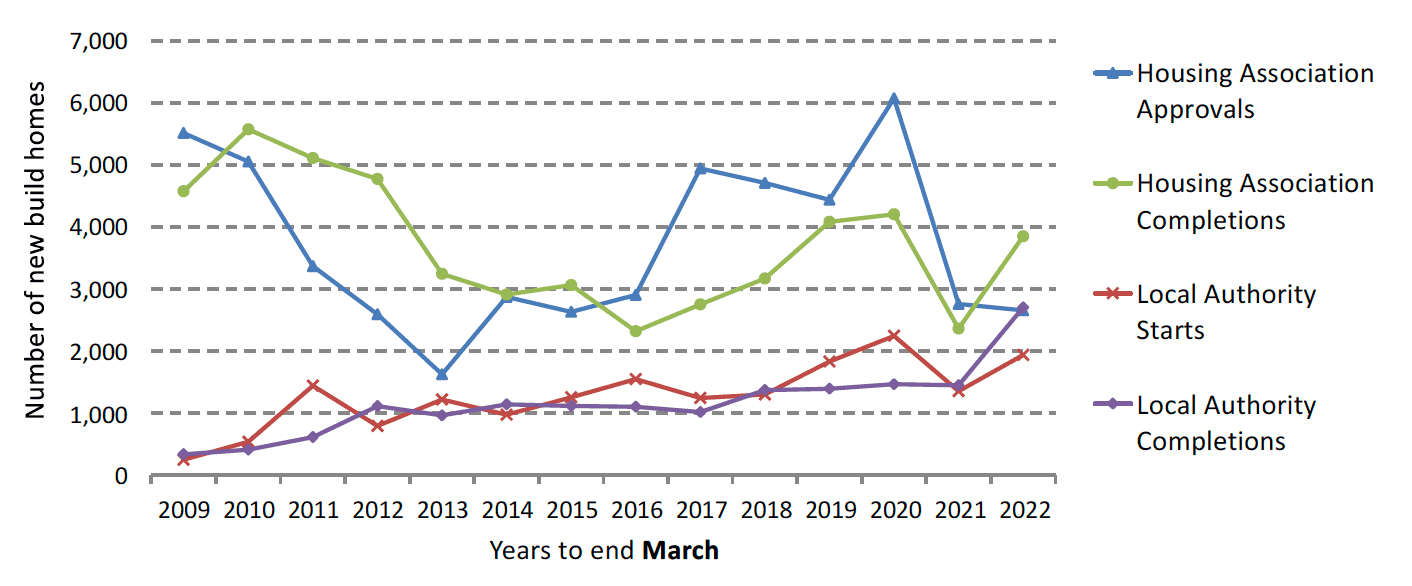
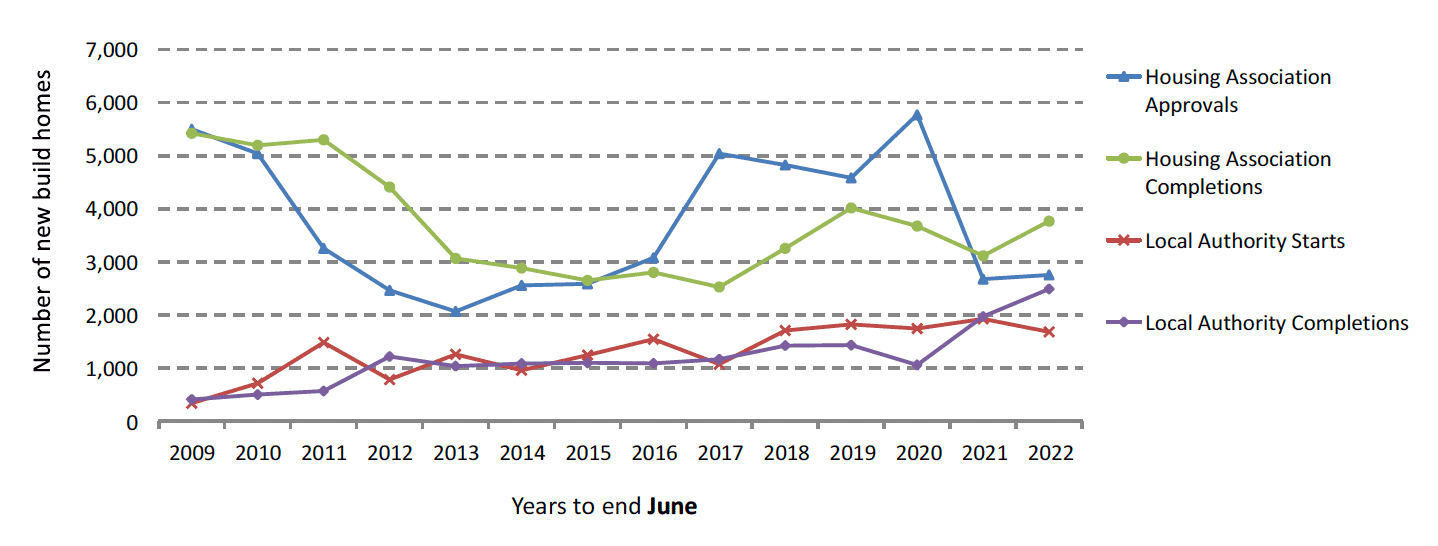
Chart 8b below shows the same figures but for years to end June.
| Social sector homes | Total Social starts | Total Social completions | Local authority starts | Local authority completions | Housing association approvals | Housing association completions |
|---|---|---|---|---|---|---|
| Jan - Mar 2019 | 2,694 | 2,165 | 518 | 425 | 2,176 | 1,740 |
| Jan - Mar 2020 | 3,949 | 1,928 | 651 | 289 | 3,298 | 1,639 |
| Jan - Mar 2021 | 2,031 | 1,501 | 704 | 414 | 1,327 | 1,087 |
| Jan - Mar 2022 | 1,621 | 1,985 | 802 | 870 | 819 | 1115 |
| Change | -410 | 484 | 98 | 456 | -508 | 28 |
| Change (%) | -20% | 32% | 14% | 110% | -38% | 3% |
| Year to Mar-19 | 6,273 | 5,478 | 1,833 | 1,392 | 4,440 | 4,086 |
| Year to Mar-20 | 8,321 | 5,672 | 2,245 | 1,468 | 6,076 | 4,204 |
| Year to Mar-21 | 4,113 | 3,813 | 1,354 | 1,449 | 2,759 | 2,364 |
| Year to Mar-22 | 4,597 | 6,557 | 1,939 | 2,705 | 2,658 | 3,852 |
| Change | 484 | 2,744 | 585 | 1,256 | -101 | 1,488 |
| Change (%) | 12% | 72% | 43% | 87% | -4% | 63% |
A total of 1,985 social sector new build homes were completed between January to March 2022, an increase of 32% (484 homes) on the same quarter in 2021. This brings the total completions for the 12 months to end March 2022 to 6,557, an increase of 72% (2,744 homes) on the 3,813 social sector new build homes completed in the previous year.
Meanwhile, 1,621 social sector new build homes were started between January to March 2022. This is 20% (410 homes) lower than the same quarter the previous year. This brings the total for the 12 months to end March 2022 to 4,597, an increase of 12% (484 homes) on the 4,113 social sector homes started in the same period in 2021.
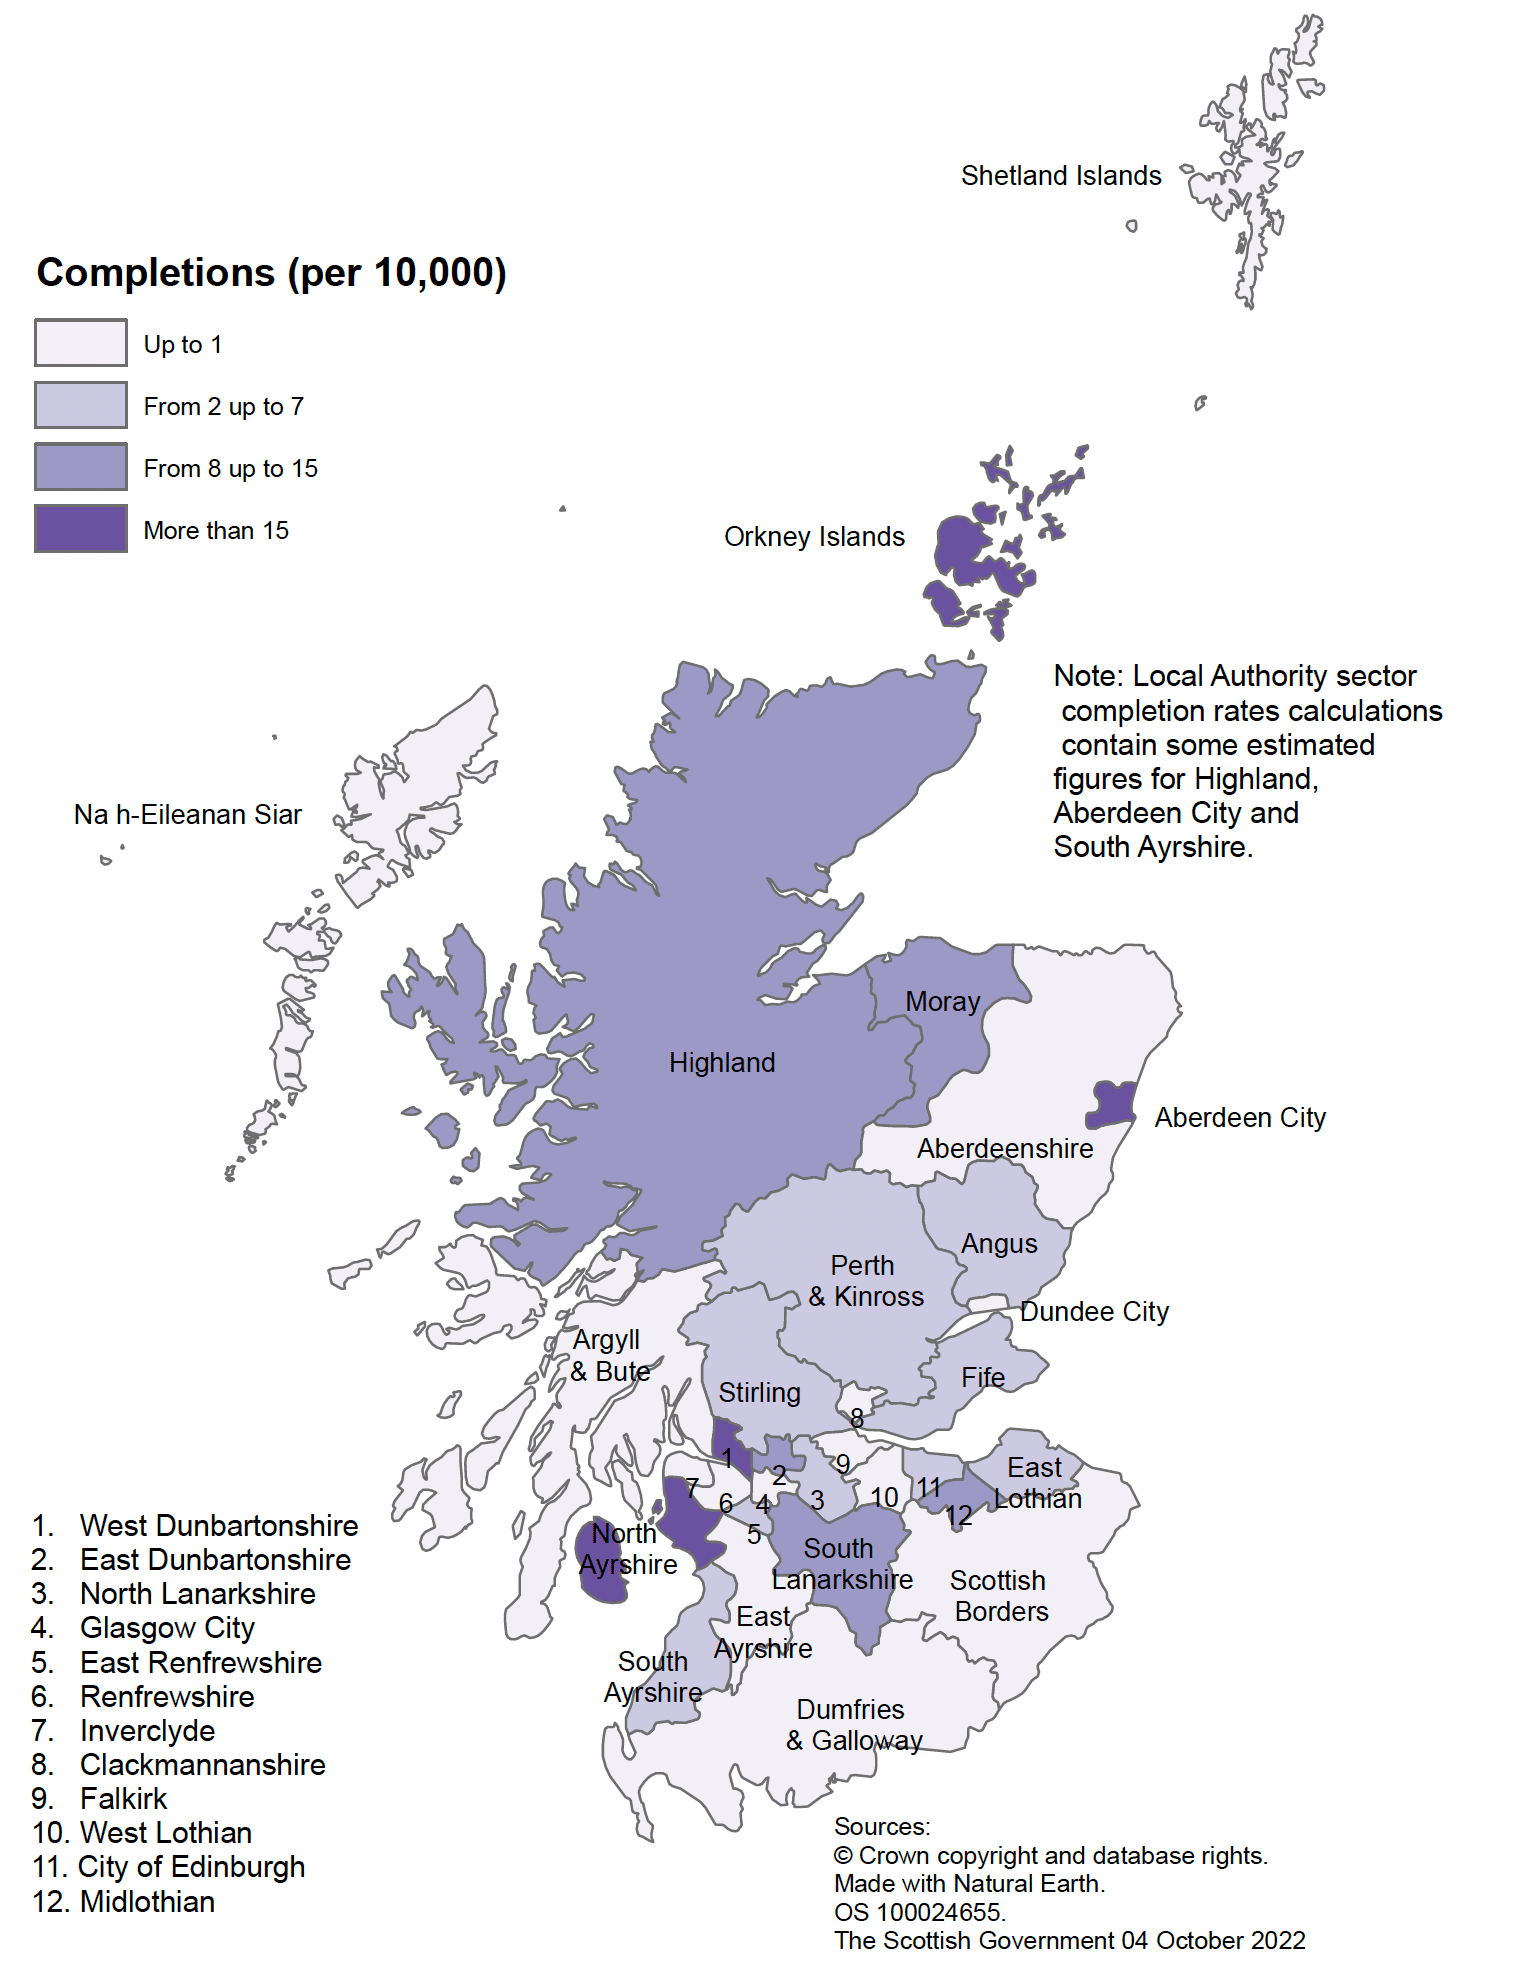
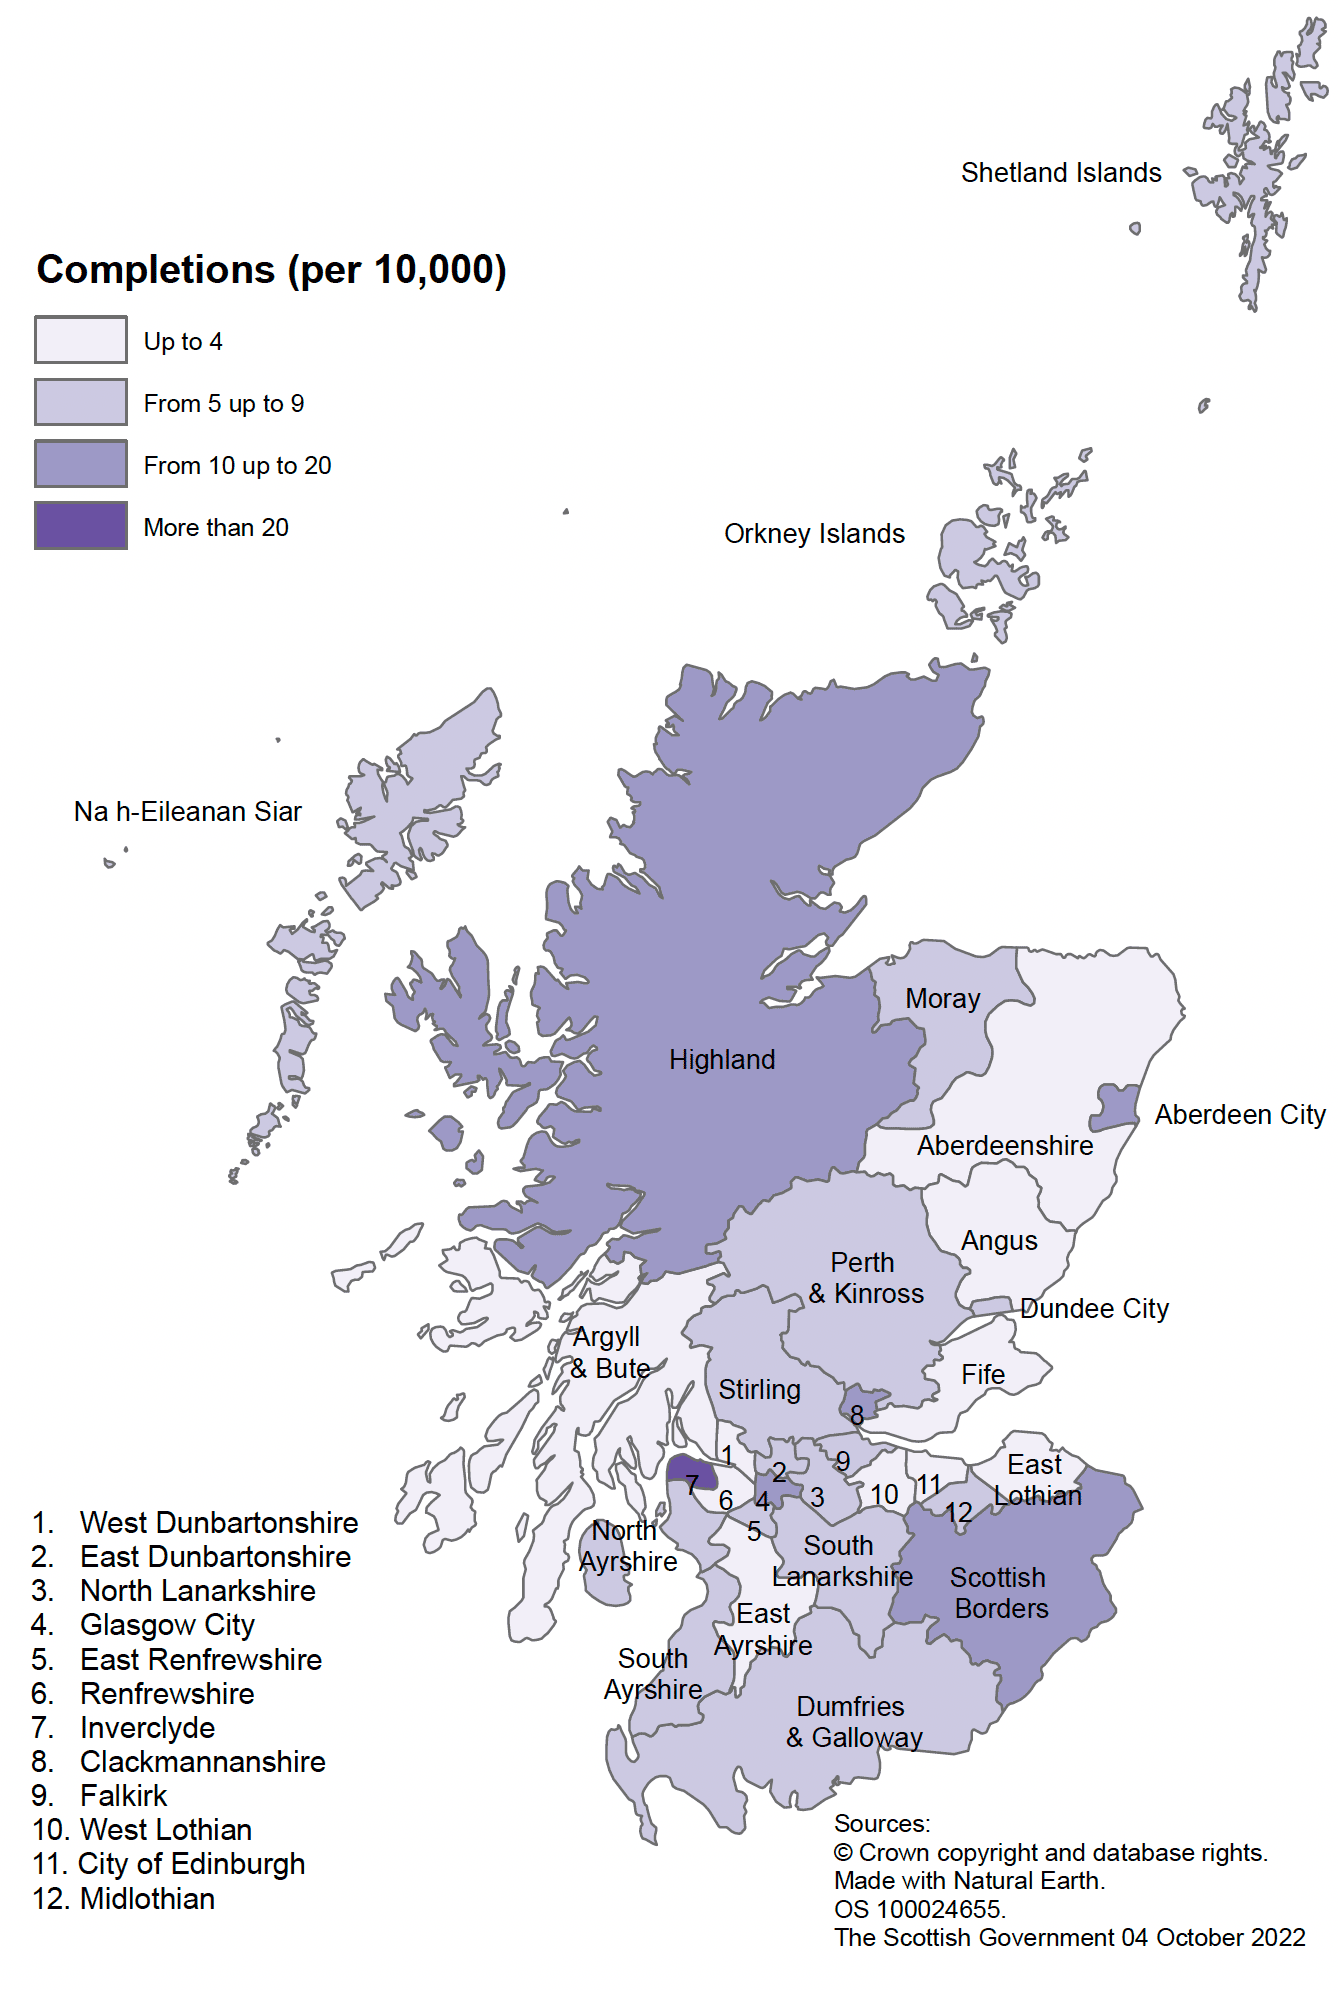
Maps C and D show the rates of housing association and local authority new build completions in each local authority for the year to end March 2022 per 10,000 of the population. The housing stock of 6 local authorities (Argyll & Bute, Dumfries & Galloway, Glasgow, Inverclyde, Na h-Eileanan Siar and Scottish Borders) has been transferred to housing associations and so these areas do not build new local authority houses.
In the year to end March 2022 local authority new build rates were highest in West Dunbartonshire, Aberdeen City, Orkney Islands, and North Ayrshire, with rates over 15 homes per 10,000 households. As well as the 6 stock transfer authorities mentioned above, Aberdeenshire, Clackmannanshire, Dundee City, East Ayrshire, Falkirk, Renfrewshire, and the Shetland Islands built no new local authority homes in the year ending March 2022. West Lothian had a rate of less than 1 house built per 10,000 households.
Meanwhile rates of housing association new build completions were highest in Inverclyde and Scottish Borders, with rates of over 20 homes per 10,000 households. There were no completions in West Dunbartonshire, and East Ayrshire, Argyll & Bute, Edinburgh City, Fife, East Lothian, Angus, and Aberdeenshire had a rate less than 4 homes per 10,000 households.
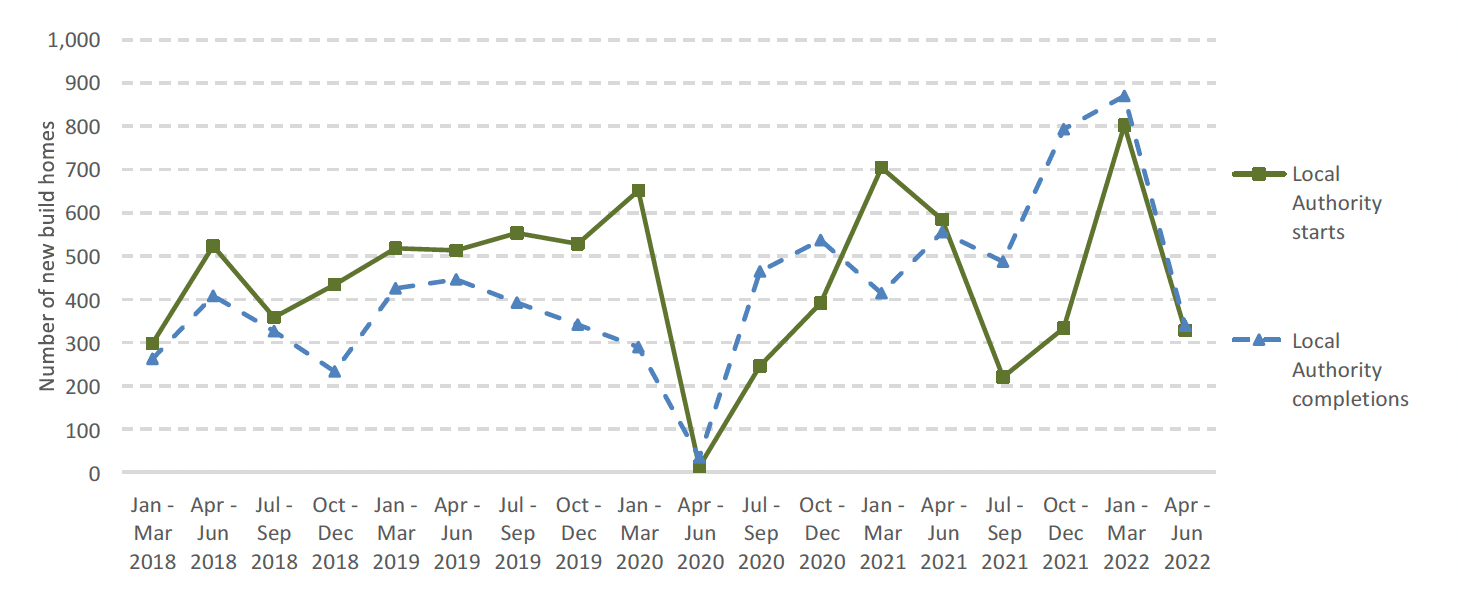
Charts 9 and 10 along with Table 5 show the latest quarterly figures for housing associations and local authorities to end June 2022.
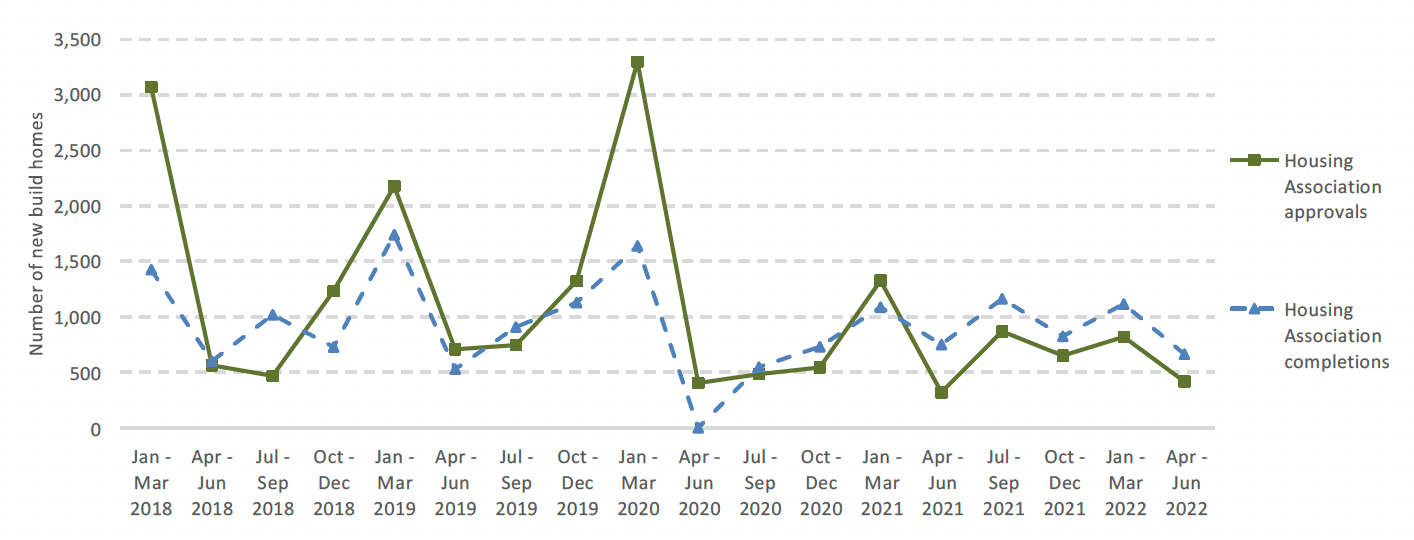
A total of 1,002 social sector new build homes were completed between April to June 2022, a decrease of 23% (303 homes) on the 1,305 completions in the same quarter in 2021. This brings the total completions for the 12 months to end June 2022 to 6,254, an increase of 23% (1,170 homes) on the 5,084 social sector new build homes completed in the previous year.
Meanwhile, 744 social sector new build homes were started between April to June 2022. This is a decrease of 18% (160 homes) compared to the same quarter in the previous year. This brings the total for the 12 months to end June 2022 to 4,437, a decrease of 4% (163 homes) on the 4,600 social sector homes started in the same period in 2021.
In the year to end June 2022, housing association new build completions are up by 21% (651 homes), local authority new build completions are up by 26% (519 homes) and housing association new build approvals are up by 3% (80 homes). Local authority new build starts have however fallen by 13% (243 homes).
| Social sector homes | Total Social starts | Total Social completions | Local authority starts | Local authority completions | Housing association approvals | Housing association completions |
|---|---|---|---|---|---|---|
| Apr - Jun 2019 | 1,220 | 975 | 513 | 446 | 707 | 529 |
| Apr - Jun 2020 | 417 | 34 | 13 | 34 | 404 | 0 |
| Apr - Jun 2021 | 904 | 1,305 | 584 | 555 | 320 | 750 |
| Apr - Jun 2022 | 744 | 1,002 | 327 | 339 | 417 | 663 |
| Change | -160 | -303 | -257 | -216 | 97 | -87 |
| Change (%) | -18% | -23% | -44% | -39% | 30% | -12% |
| Year to Jun-19 | 6,407 | 5,445 | 1,823 | 1,430 | 4,584 | 4,015 |
| Year to Jun-20 | 7,518 | 4,731 | 1,745 | 1,056 | 5,773 | 3,675 |
| Year to Jun-21 | 4,600 | 5,084 | 1,925 | 1,970 | 2,675 | 3,114 |
| Year to Jun-22 | 4,437 | 6,254 | 1,682 | 2,489 | 2,755 | 3,765 |
| Change | -163 | 1,170 | -243 | 519 | 80 | 651 |
| Change (%) | -4% | 23% | -13% | 26% | 3% | 21% |