Homelessness in Scotland: 2021/22
This statistics bulletin provides information on homelessness in Scotland in the period from 1 April 2021 to 31 March 2022, alongside historical data.
Part of
Temporary accommodation
Key Points in 2021/22
- 58% of temporary accommodation used is social sector for all households compared to 67% for households with children
- ↑ The average time in temporary accommodation has increased to 207 days
- Households with children spend longer in temporary accommodation than those without - 47% of households with children spent seven months or more in temporary accommodation compared to 38% of households without children
- There were 690 cases of households not being offered temporary accommodation
- There were 2,015 breaches of the unsuitable accommodation order (to be treated with caution – see notes below)
Sources of temporary accommodation data
Since 2002, local authorities have provided aggregate snapshot information relating to households in temporary accommodation. While this allows trends to be explored over time, understanding around individual placements and how these relate to assessed households is not possible from the snapshot data. Therefore, since 1 April 2016 placement level information on households in temporary accommodation has been provided to enable a more rounded picture of the use of temporary accommodation.
The snapshot data shows 13,945 households in temporary accommodation as at 31 March 2022. The placement level returns show that there were 14,527 temporary accommodation placements open at 31 March 2022 – higher (582, 4%) than the snapshot returns. Differences may be explained by the returns including different types of temporary accommodation and the placement level returns experiencing a lag in cases being closed.
Both of these figures show households in temporary accommodation at a point in time and, as such, will include those who have recently entered temporary accommodation as well as those who have been in temporary accommodation for a longer period of time (including prior to the reporting year).
Reporting of temporary accommodation
When considering certain aspects of temporary accommodation such as number of placements, average time spent in temporary accommodation etc., the true extent of this can only be fully understood once a household has exited temporary accommodation. A household is considered to have ‘exited’ temporary accommodation in a reporting year only if their homelessness case has closed.
How many people entered temporary accommodation? How many exited?
In 2021/22, 21,589 households entered a first temporary accommodation placement. This will include households who made a homelessness application prior to this year. At the same time in 2021/22, 18,974 households exited their final temporary accommodation placement.
These figures give a net difference of 2,615 more households entering temporary accommodation than exiting. This ties in with the increase in the number of households in temporary accommodation which can be seen in the snapshot figures. Although the numbers will not match given the differences outlined above.
The largest increases are seen in Edinburgh, 870 more households entering than exiting, and Glasgow, 836 more households entering than exiting.
Most homelessness applicants have one or no temporary accommodation placements
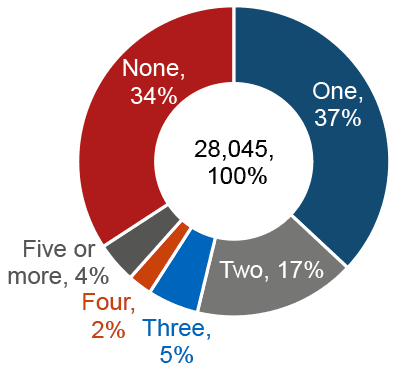
There is variation in the number of placements between local authorities. All homeless households in Shetland had at least one temporary accommodation placement. This contrasts with 70% of homeless households in Scottish Borders that had no temporary accommodation placement. Although caution should be applied for local authorities with small numbers of households. In Edinburgh, 28% of homeless households had five placements or more, higher than any other local authority.
Social sector accommodation is the most common type of temporary accommodation, in particular for households with children
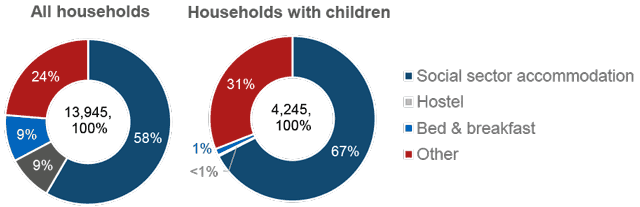
The use of bed & breakfast accommodation as at 31 March 2022 was similar to the previous year after having increased (from 7% in 2020). Local authorities face a backlog of cases in bed & breakfast accommodation that built up during COVID-19 which they are attempting to move to other temporary or settled accommodation. Issues accessing accommodation are ongoing due to the supply and cost of building materials, and the availability of tradespeople to turn around empty properties.
The use of hostel accommodation decreased slightly (from 12% at 31 March 2020 and 10% at 31 March 2021).
Data from the placement level data collection can provide further insight into the total use of temporary accommodation over the lifecycle of homelessness cases. However, it is difficult to make direct comparisons with the snapshot data as different categories of temporary accommodation are used between the two returns.
There were 39,340 temporary accommodation placements taken up in 2021/22. 41% of temporary accommodation placements were in local authority or housing association/registered social landlord (RSL) accommodation; 23% of placements were in hostel accommodation; and 22% of placements were in bed & breakfast accommodation.
The higher proportion of hostel and bed & breakfast accommodation in the placement level returns (45% vs 18%) indicates that these types of temporary accommodation are more frequently used than the snapshot data suggests. However, this can be explained by the fact that the average duration for stays in these types of accommodation is much shorter - for example, 36 days in bed and breakfast compared to an average of 107 days for all temporary accommodation – and therefore they account for a much smaller proportion of the overall use of temporary accommodation.
Data on the number of placements and average length of time will help improve understanding of the ways in which different types of temporary accommodation are used.
Average total time in temporary accommodation is increasing year on year
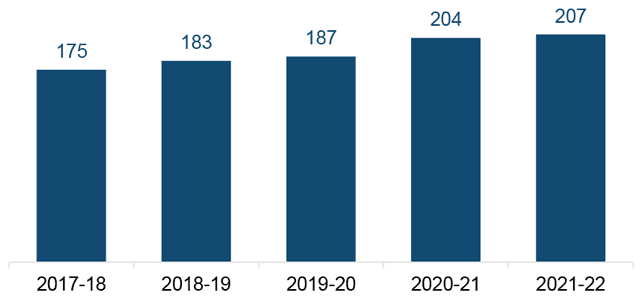
This is a continued increase to 207 days spent in temporary accommodation on average in 2021/22 from 204 days last year. This is likely related to the fact more people are staying in temporary accommodation for longer as a result of the previously mentioned backlog of cases and difficulties providing settled accommodation due to issues with materials and tradespeople.
Note that total duration is calculated by summing the time a household spends in individual placements, excluding time between placements when a household is not in temporary accommodation. As a result the time a household spends in temporary accommodation may not be continuous.
Average total time spent in temporary accommodation varies by local authority. In Midlothian, the average total time is 524 days, a reduction of 87 days from 2020/21. East Dunbartonshire has an average of 340 days which is above the national average (207), but is a reduction of 126 days from 2020/21.
The largest increases in average total time spent in temporary accommodation were in Edinburgh (increase of 85, from 364 to 449 days) and Stirling (increase of 83 from 239 to 322 days).
Average total time spent in temporary accommodation also varies by household type.
Households with children spend longer in temporary accommodation
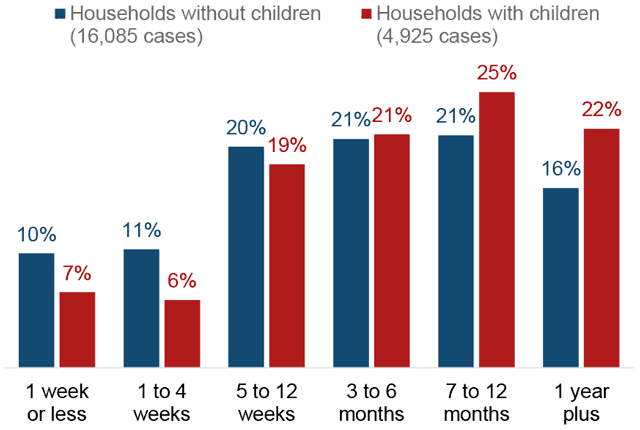
[To note: information about individuals within temporary accommodation placements is not available from the placement level data. Household type has therefore been derived from the information provided on the homelessness application. This accounts for the difference in the number of households with children compared to the snapshot data return.]
Households spend the longest, on average, in housing association accommodation and accommodation with a private sector lease
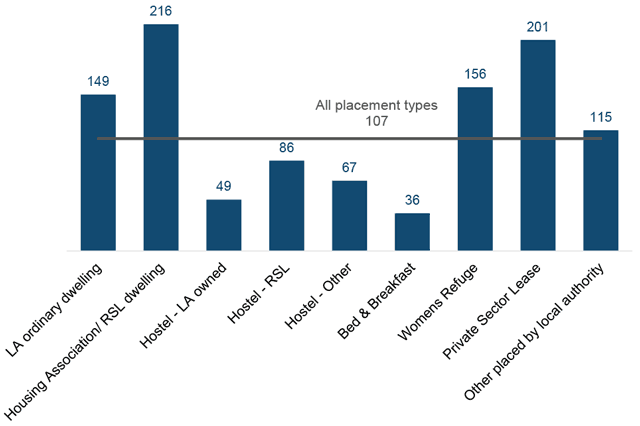
This confirms the expected shorter-term use of bed & breakfast and hostel accommodation.
How often do applicants refuse temporary accommodation?
A household can choose to refuse an offer of temporary accommodation made by the local authority. However, a household that has refused an offer of temporary accommodation may accept a subsequent offer.
In 2021/22, there were 6,920 cases of households refusing offers of temporary accommodation. This is a decrease of 385 (5%) compared to 2020/21, following a previously large increase of 30% between 2019/20 and 2020/21.
Just under half of all local authorities recorded less refusals of temporary accommodation in 2021/22 compared to 2020/21. Particularly large reductions were seen in Aberdeenshire (reduction of 435, from 680 to 245) and Glasgow (reduction of 320, from 3,205 to 2,885).
How often do local authorities fail to provide temporary accommodation?
A local authority is required to indicate when they do not offer temporary accommodation to a household and are therefore acting unlawfully. During 2021/22, there were 690 instances of households not being offered temporary accommodation. This is a 16% increase compared to 2020/21 (from 595 to 690). The majority of these cases were in Edinburgh (670). However, overall this is an 85% decrease compared to 2019/20, mainly due to a reduction in Glasgow from 3,830 to less than 5 in the most recent year.
How often do local authorities breach unsuitable accommodation legislation?
Important! These figures should be treated with caution due to:
a) reporting anomalies and inconsistencies;
b) uncertainty caused by the extension of the Unsuitable Accommodation Order (UAO) legislation in May 2020; and
c) the existence of COVID-19 exceptions between May 2020 and September 2021.
See below for further details on all of these.
Between April 2021 and March 2022 there were 2,015 reported breaches of the unsuitable accommodation order (UAO). There were 370 in the first six months and 1,645 in the last six months. This is an increase of 1,505 breaches from 2020/21. The stark increase is very likely due to the ceasing of the COVID-19 exceptions on 30 September 2021.
These figures being the largest in the series is likely also due to the extension of the legislation to all households. Prior to May 2020, this only applied to households with a pregnant member and/or children.
Edinburgh accounts for the largest number of breaches, 850 (out of the 2,015) with a noticeable increase from October 2021. Fife accounts for 425, West Lothian for 325, Glasgow for 220 and East Lothian for 135.
Reporting anomalies and inconsistencies
Increased scrutiny of the data brought about by changes in legislation and the introduction of COVID-19 exceptions has uncovered some anomalies and inconsistences in the reporting of breaches.
- 115 (6%) of the breaches recorded related to temporary accommodation placements less than 8 days. 35 (2% of the 2,015) do not have any other associated placements/or other placements still have the cumulative total less than 8 days. This implies these 35 cases may have been marked as a breach in error.
- 85 (5%) placements which started between 1 October 2021 and 31 March 2022 that were more than 7 days were not recorded as a breach. For 25 of these, it does appear that they have associate placements which were recorded as a breach. This implies that 60 (4%) were not marked as a breach when they should have been.
In addition, it has become evident that not all local authorities approach the reporting of breaches in the same way. Although the majority of local authorities reported a breach against individual placements only (i.e. if one placement was greater than seven days a breach was recorded: if not, no breach was recorded), some local authorities reported breaches if the cumulative total of all placements associated with the same homelessness application was greater than seven days. This also highlighted that the majority of local authorities were recording breaches at placement level and not application level, in line with the wording used in the legislation, which states “…in total in respect of that person’s application”.
Enhanced guidance as to how to accurately and consistently record breaches, in line with legislation, has now been issued to local authorities. However, this did not come into effect until 1 April 2022 and therefore is beyond the scope of this publication. From 1 April 2022 there will also be increased scrutiny and additional quality assurance processes built in to ensure accurate and consistent data recording.
Changes in legislation
Prior to 5 May 2020, a breach was encountered when a household with a pregnant member and/or child is in unsuitable temporary accommodation for more than 7 days. From 5 May 2020, this was extended to all households. Therefore, breaches figures before and from the 5 May 2020 are not comparable. To also note, this falls in the middle of a reporting quarter.
COVID-19 exceptions
Temporary exceptions were put in place to allow local authorities to provide households with accommodation in response to COVID-19. The legislation noted that a placement was not considered unsuitable if:
- a person in the household has symptoms of coronavirus and the household requires to isolate; or
- the accommodation is required to provide temporary accommodation to ensure that a distance of 2 metres can be maintained between a member of the household and a person who is not a member of the household in order to prevent the spread of coronavirus; or
- the local authority is unable to place the household in suitable accommodation as a result of the impacts of coronavirus on temporary accommodation supply in the area, provided that where a household includes a child or a pregnant woman, the household is not placed in unsuitable accommodation for more than 7 days.
The first two of these came into effect in May 2020 and the third came into effect on 30 September 2020. All ceased on 30 September 2021. Again, this means that data will not be comparable across the series.
A household placed in unsuitable accommodation for longer than 7 days where an exception did not apply must still be recorded as a breach.