Homelessness in Scotland: 2021/22
This statistics bulletin provides information on homelessness in Scotland in the period from 1 April 2021 to 31 March 2022, alongside historical data.
Part of
Reasons for homelessness and prior circumstances
Key Points in 2021/22
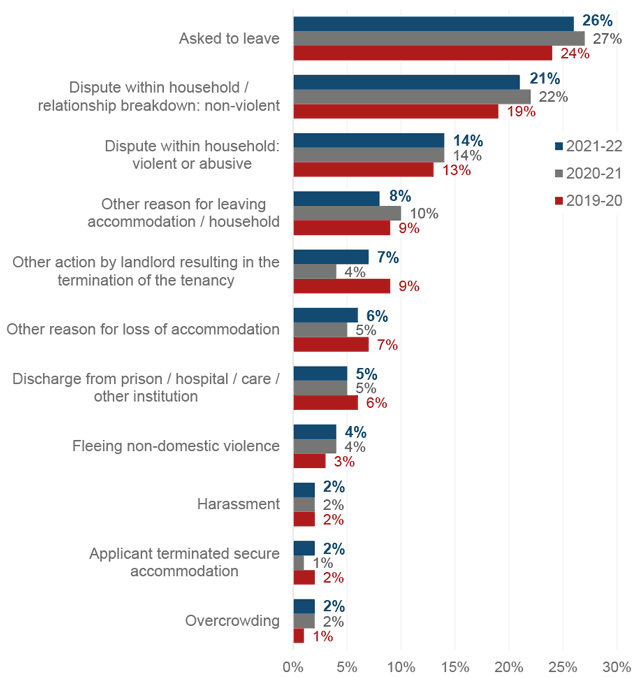
- ↓ Household disputes (35%) and asked to leave (26%) remain the most common reasons for homelessness. Although lower in proportion than last year (36% and 27% respectively in 2020/21), they are still higher than pre-pandemic (32% and 24% respectively in 2019/20).
- ↓ The proportions of applicants that became homeless from a family home (28%) or friends/partners (20%) were also lower than last year (30% and 22% respectively in 2020/21), but are still higher than pre-pandemic (24% and 18% respectively in 2019/20).
- ↑ Increase in homelessness from private rented tenancies (from 11% In 2020/21 to 15% in 2021/22)
- ↓ Rough sleeping prior to making a homelessness application continues to decrease; 6% reported rough sleeping in the three months prior and 4% the night before (compared to 7% and 4% of applicants in 2020/21)
Why do households make a homelessness application?
‘Asked to leave’ and ‘household disputes’ remain the most common reasons given for making a homelessness application. Although the proportions of applications that state these as reasons decreased in the latest year, they are still higher than pre-pandemic proportions.
The reason of ‘other action by landlord resulting in the termination of the tenancy’ increased in the latest year, following a reduction between 2019/20 and 2020/21. This may be due to the temporary measures introduced to protect renters over the COVID-19 period being lifted. Measures included the use of extended notice periods for eviction proceedings.
‘Fleeing non-domestic violence’ has increased over the past five years to reach the highest number of applications stating this as a reason since 2009/10 (1,564 in 2021/22). At the same time, ‘discharge from prison / hospital / care / other institution’ has decreased to reach its lowest number since the start of the data collection in 2007/08 (1,809 in 2021/22).
Asked to leave and household disputes remain most common reasons for homelessness
Some applicants (76%) also provide additional reasons for homelessness. ‘Not to do with the applicant household’ and ‘mental health reasons’ are increasing compared to 2020/21 (from 33% to 37% and 17% to 20% respectively) to reach their highest levels in the time series. In contrast, ‘lack of support from friends and family’ has decreased, although still higher than pre-pandemic proportions (16% in 2021/22 compared to 18% in 2020/21 and 14% in 2019/20).
What are the prior circumstances of the homeless population?
As part of the application process information is gathered on the following: where the household became homeless from; whether anyone in the household had slept rough; whether anyone in the household was former armed forces; whether anyone in the household had been previously looked after by their local authority as a child; and any existing support needs.
Increase in the proportion becoming homeless from private rented tenancies and a decrease from family, friends and partners
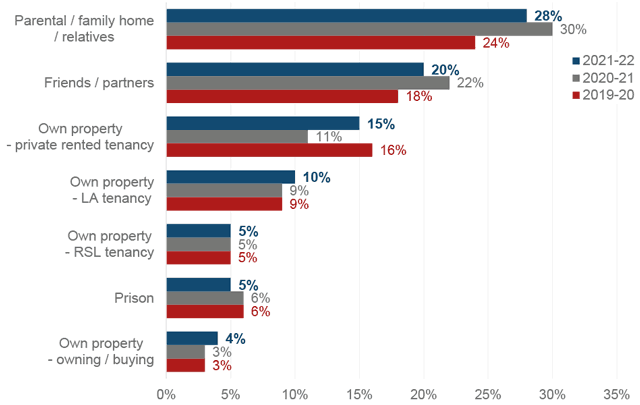
The proportions becoming homeless from a family home or friends/partners still remain above pre-pandemic proportions. The decline in proportion from 2020/21 mirrors the decreases in those becoming homeless following a household dispute.
Those becoming homeless from a private rented tenancy are now much closer to pre-pandemic proportions. The increase here, as well as from a local authority tenancy and from own property, may be due to the ceasing of the ban on evictions, home repossesions and mortgage deferrals, as part of the easing of COVID-19 restrictions.
Rough sleeping prior to making a homelessness application continues to decrease
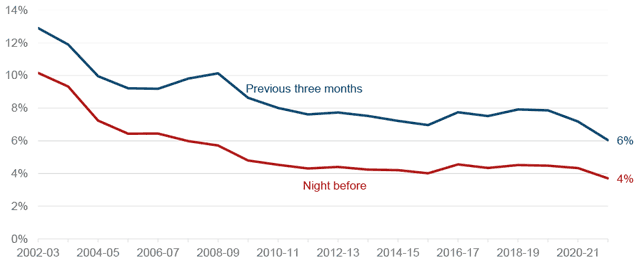
There were 1,304 households that included at least one household member who experienced rough sleeping the night before their application. A total of 2,129 households reported at least one household member experiencing rough sleeping in the three months prior to their application.
The numbers reporting rough sleeping increase and decrease to reflect the trends in applications. The proportions reporting rough sleeping have remained fairly constant since 2010/11. However, over the past two years the proportions reporting rough sleeping in the three months prior to their application have decreased (from 8% of all applications in 2019/20). This may be related to the efforts made by local authorities to house those in need, which included, but not restricted to, the accommodating of rough sleepers.
There is notable variation between local authorities, with a high of 13% of all applications in Dumfries & Galloway compared to a low of 0% of applications in Fife and Midlothian reporting rough sleeping in the previous three months.
The majority of local authorities report decreases, most notably Dundee and West Lothian (54% and 32% reduction in rough sleeping in the previous three months respectively compared to 2020/21). Some notable increases include Clackmannanshire (33%), East Lothian (25%) and Dumfries & Galloway (19%), who recorded more applications where at least one member of the household had slept rough in the previous three months compared to 2021/22. Note that these proportions represent relatively small numerical changes.
There were 639 households assessed as homeless or threatened with homelessness that had a household member that was previously a member of the armed forces. This is a 7% fall compared to 2020/21, and accounts for 2% of all homeless households. There was also 963 households that contained a household member aged under 25 that had been looked after by their local authority as a child. This accounts for 5% of all households with a household member under the age of 25.
The proportion of homeless households reporting a support need has increased over time – from 33% in 2007/08 to 52% in 2021/22. The biggest increases have been experienced for support needs for mental health (from 12% to 29%) and basic housing management (10% to 24%).