Homelessness in Scotland: 2021/22
This statistics bulletin provides information on homelessness in Scotland in the period from 1 April 2021 to 31 March 2022, alongside historical data.
Part of
The extent of homelessness in Scotland
Key Points in 2021/22
- ↑ Homelessness applications and assessments increased but are still below pre-pandemic levels
- ↑ There were 28,882 homeless households comprising 32,592 adults and 14,372 children
- ↑ Open applications and households in temporary accommodation increased
- ↑ Sharper increase in the number of children in temporary accommodation
Applications, assessments and households in temporary accommodation
| Measure | 2019/20 | 2020/21 | 2021/22 | Change 2020/21 to 2021/22 | |
|---|---|---|---|---|---|
| Number | Percent | ||||
| Applications | 37,060 | 34,286 | 35,230 | 944 | 3% |
| Assessed as homeless | 31,612 | 28,042 | 28,882 | 840 | 3% |
| Households in temporary accommodation at 31 March | 11,665 | 13,359 | 13,945 | 586 | 4% |
| Open homelessness applications at 31 March | 22,906 | 24,834 | 26,166 | 1,332 | 5% |
Table A shows that there is an increase in the number of applications and households assessed as homeless or threatened with homelessness in 2021/22 compared to 2020/21. This follows a marked reduction between 2019/20 and 2020/21, largely explained by changes in service use as a result of the COVID-19 pandemic, emergency COVID-19 legislation and a temporary ban on home reposessions. The number of homelessness applications and assessments in 2021/22 are still lower than pre-pandemic (2019/20).
Households in temporary accommodation and open homelessness applications continued to increase between March 2021 and March 2022, although not as steeply as between March 2020 and March 2021. This is likely the result of the backlog of cases that built up during COVID-19 and the on-going cost and supply issues for materials and lack of tradespeople which are required to provide settled accommodation.
To note that the national temporary accommodation and open homelessness applications figures are impacted by updated data supplied by Edinburgh Council. Prior to 1 April 2020, Private Sector Lease (PSL) accommodation was not counted as part of Edinburgh’s temporary accommodation stock. From a recording perspective, this meant that the homelessness applications associated with these cases were closed and new ones opened if those households re-presented.
The new PSL contract which started on 1 April 2020 allows Edinburgh council to use PSL accommodation for immediate access temporary accommodation placements. This has resulted in cases remaining open with associated PSL temporary accommodation placements. This explains the noticeable increase in the number of temporary accommodation placements within Edinburgh from 1,868 at 31 March 2020 to 2,430 at 31 March 2021 to 3,048 at 31 March 2022. Edinburgh have included Private Sector Leasing in their temporary accommodation statistics for the first time and data has been backdated to 1 April 2020 so figures are on a consistent basis and allowing a meaningful comparison with the previous year.
Number of households vs number of people
While data is provided and reported at a household level, local authorities record the number of people attached to applications. It is therefore possible to understand how many people are affected by homelessness.
The 28,882 homeless households in 2021/22 contained a total of 46,964 people, comprising 32,592 adults and 14,372 children. The number of adults increased by 6%, while the number of children increased by 17% compared to 2020/21.
This finding is also reflected in the data on temporary accommodation.
Sharper increase in the number of children in temporary accommodation than all households in the latest year
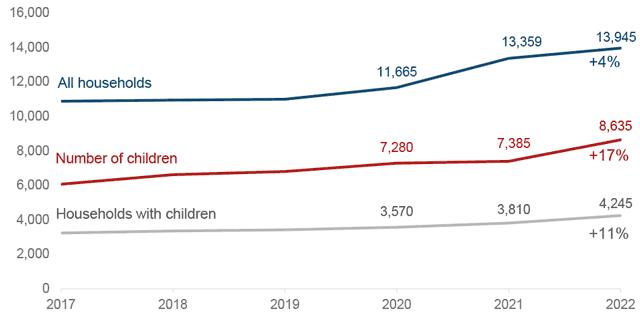
[To note: data is collected through aggregate snapshot temporary accommodation returns for the number of children in temporary accommodation, but not the number of adults.]
The sharper increases in the number of children is a result of the proportion of homeless households with children returning to those similar to what they were pre-pandemic. In 2021/22, 28% of homeless households contained children, which is much more in line with the 29% in 2019/20, both of which were higher than the 25% in 2020/21.
Intentionality
Of the 28,882 homeless households in 2021/22, 28,513 (99%) were assessed as unintentionally homeless, with the remaining 369 assessed as intentionally homeless.
The small proportion of, and continued numerical decrease in, those assessed as intentionally homeless are due to the changes in legislation from November 2019 which give local authorities the power to assess for intentionality, rather than it being a legal duty to do so.
Longer term trends
Longer term trends in homelessness in Scotland are impacted by previous legislation, policy and practice
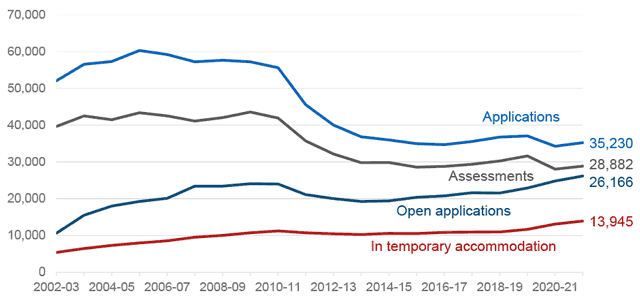
Chart 2 provides a view of the longer-term trends which have been experienced in homelessness. This shows the impact of previous legislation, policy and practice, as well as the impact of the COVID-19 pandemic in 2020/21.
In 2001, Scottish homelessness legislation extended councils’ duties to non-priority need homeless households. Before 2002, the majority of homeless households in priority need were households with children. Following the 2001 extension duty there was a notable increase in the number of single people applying for homelessness assistance. These single people were also eligible for temporary accommodation. This can, at least in part, explain the increases from 2002/03. The priority need test was abolished on 31 December 2012.
The sharper decrease shown from 2009/10 is likely due to the impact of the introduction of Housing Options services in Scottish local authorities, with a focus on prevention.
From 2015/16, applications and assessments increased year on year but were markedly lower in 2020/21 as a result of the pandemic. In contrast, open applications and households in termporary accommodation were also increasing but continued to do so during the pandemic. They have now reached the highest levels covered by the data collection.
How does homelessness vary across Scotland?
Following the reduction in homeless households across most local authorities between 2019/20 and 2020/21 as a results of the pandemic, roughly half recorded increases in 2021/22 compared to the previous year.
Most homeless households are in Glasgow
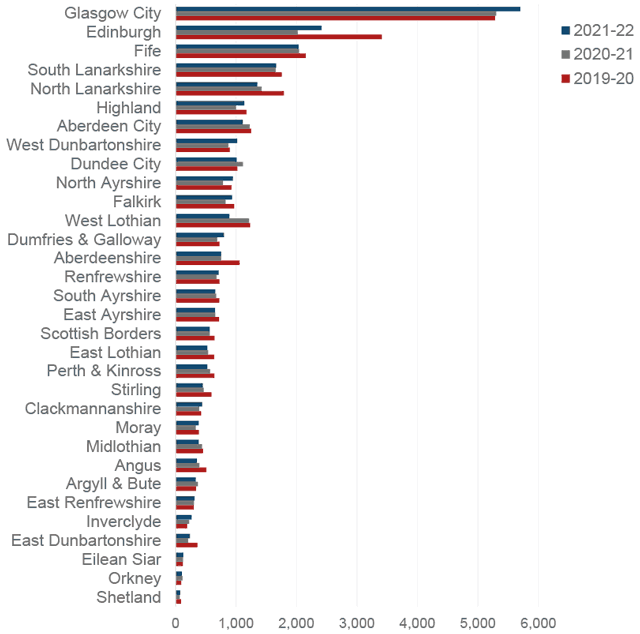
Glasgow recorded the largest numerical increase of 399 more homeless households compared to 2020/21 (from 5,302 to 5,701). This is the highest number of homeless households in Glasgow since 2012/13.
This may be partly due to the higher number of applications from refugees who have been granted ‘Leave to Remain’ status that Glasgow receive compared to other local authorities. For some time Glasgow was the only Scottish local authority the Home Office directed asylum seekers to while their claim was being processed. However, in the last year there have been some placements in other local authorities, albeit not in the same concentration as in Glasgow.
Edinburgh saw a similar increase of 393 homeless households in 2021/22 compared to the previous year (from 2,020 to 2,413). However, this remains well below pre-pandemic figures with 3,412 homeless households recorded in 2019/20. The longer-term trend in Edinburgh has been a reduction in the number of homeless households.
Other notable increases in households assessed as homeless include North Ayrshire (up 166, from 783 to 949), West Dunbartonshire (up 146, from 873 to 1,019) and Highland (up 138, from 999 to 1,137).
A number of local authorities have seen downwards trends of homeslessness over the last few years. West Lothian saw the largest numerical reduction of 326 homeless households in 2021/22 (from 1,217 to 891). This is the lowest number they have recorded since the start of the data collection. Other notable decreases include Aberdeen (down 113, from 1,226 to 1,113) and Dundee (down 104, from 1,114 to 1,010).
Rates of homelessness and households in temporary accommodation
Comparing homelessness figures with the population for each local authority (i.e. rates) provides a useful insight as to how homelessness varies across Scotland.
632 households per 100,000 population in Scotland assessed as homeless
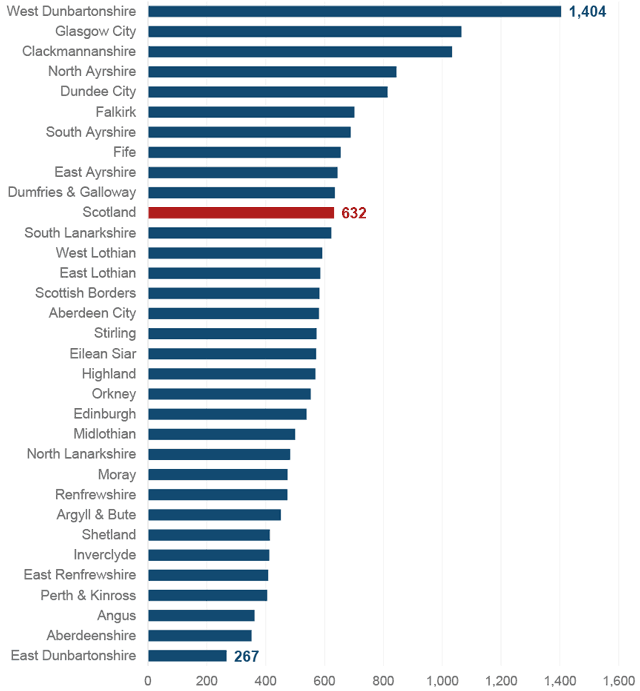
Glasgow has the second highest rate at 1,065 and Edinburgh is below the national average with a rate of 539 households per 100,000 population.
Interestingly, the use of temporary accommodation does not follow the same pattern (in terms of rates) as the number of homeless households at a local authority level. This implies some local authorities have a disproportionately high use of temporary accommodation, while others are disproportionately low.
Edinburgh has twice the national rate of households in temporary accommodation
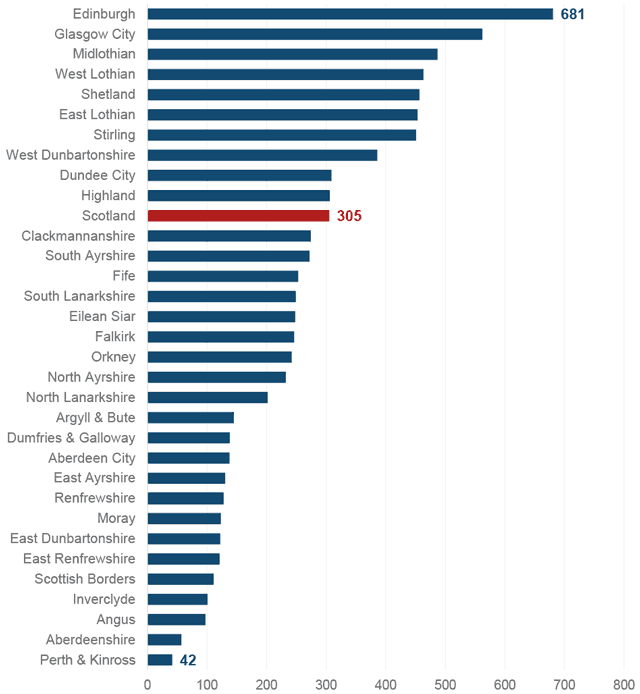
Edinburgh having the highest rate of households in temporary accommodation is in contrast to the rate of homeless households in Edinburgh being below the national average.
Glasgow has the second highest rate of households in temporary accommodation at 562 households per 100,000 population, which is in keeping with their rates of homeless households.