Health and Care Experience Survey 2021 to 2022: national results
The Health and Care Experience Survey asks about people’s experiences of accessing and using their GP practice and Out of Hours services, aspects of care and support provided by local authorities and other organisations; and caring responsibilities and related support.
7. Experiences of Carers
Characteristics of Carers
The contribution of carers in looking after people, including some of the most vulnerable in society, is widely recognised. As the previous section showed, many people who get help and support for everyday living receive it from friends and family instead of, or in addition to, formal services: the survey indicates that 46% of people who received help received informal care from friends and family (see Figure 6.2 in section 6).
People were asked whether they had carried out any regular unpaid caring responsibilities for family members, friends, neighbours or others because of either a long-term physical / mental health / disability or problem relating to old age.
18% of people indicated that they look after or provide regular help or support to others.
Caring Responsibilities
As can be seen in Figure 7.1, 6% of respondents provide up to four hours of care per week and 5% provide 5 to 19 hours of care a week. 4% provide 50 or more hours per week. In general, there is a small increase in the proportion of respondents providing care across all categories, although there is a noticeable increase in the proportion providing less than five hours compared with previous years.
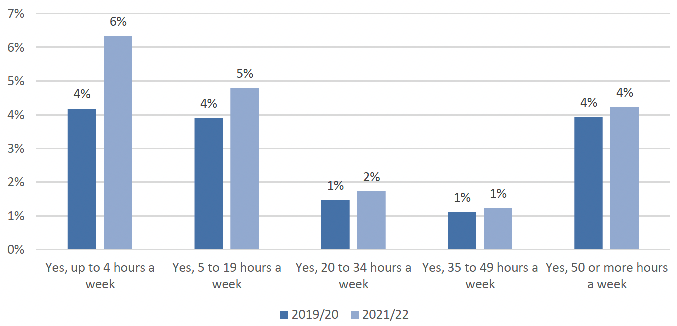
Note that the proportion of respondents who do not provide care is not presented.
This time spent was mostly to care for a parent or grandparent (48%), with 24% saying that they cared for a partner or spouse.
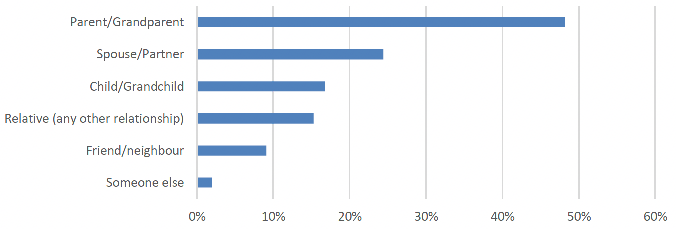
Note that percentages do not sum to 100 as people can care for more than one person.
Experiences of Caring and Impact on Wellbeing
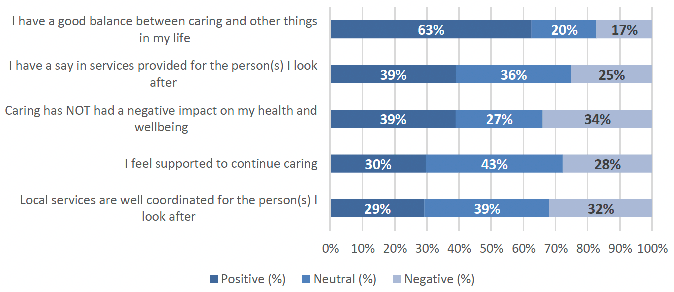
Carers were asked about their experiences of five specific aspects of caring and the impact on their wellbeing. As with the previous survey, the responses in 2021/22 were mixed. However, overall the results were less positive than in previous years. Carers were most positive about the balance between caring and other things in their life with 63% responding positively to this question in 2021/22.
Carers were least positive about local services being well coordinated for the person(s) they look after. Overall, 29% of carers said that they felt supported to continue caring which is a decrease of nine percentage points from 2019/20. 39% said that caring did not have a negative impact on their health and wellbeing, which is also five percentage points less than in 2013/14.
Contact
Email: patientexperience@gov.scot