Health and Care Experience Survey 2021 to 2022: national results
The Health and Care Experience Survey asks about people’s experiences of accessing and using their GP practice and Out of Hours services, aspects of care and support provided by local authorities and other organisations; and caring responsibilities and related support.
4. Recent Treatment or Advice from the GP Practice
Most Recent Treatment or Advice
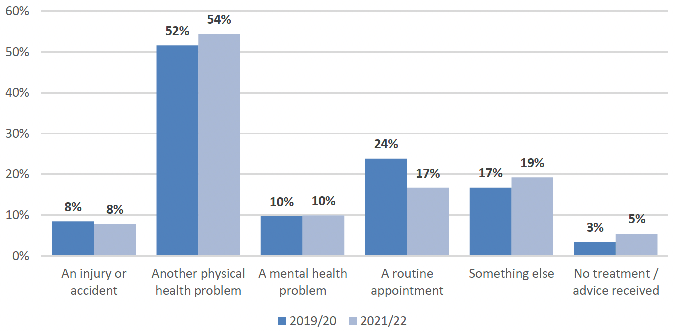
Those who had contacted their GP practice within the last twelve months were asked, if they had received treatment or advice at their GP practice in this time and what they had received treatment or advice for.
Respondents were asked to tick all the reasons for treatment or advice that applied to them and Figure 4.1 details the total proportion of people selecting each reason. Five per cent of people did not receive any treatment or advice.
The vast majority (88%) of those who had received treatment or advice had selected only one reason for seeking treatment or advice. Only 2% of people selected three or more reasons for seeking treatment or advice.
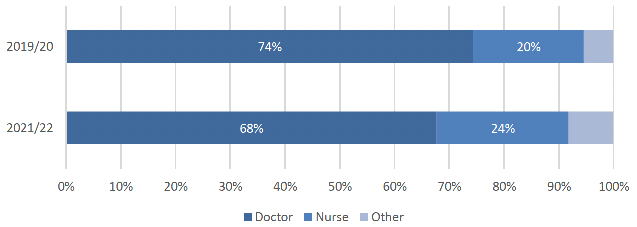
The last time treatment or advice had been received from the GP practice, most of that treatment or advice was provided by a doctor (68%), a nurse (24%) or another healthcare professional (8%). This is a slight decrease in people seeing doctors compared to 2019/20 (74%), with a corresponding increase in patients being see by nurses.
Experience of Care
Respondents were asked whether they agreed or disagreed with twelve statements relating to their experience of care the last time they received treatment or advice at their GP practice.
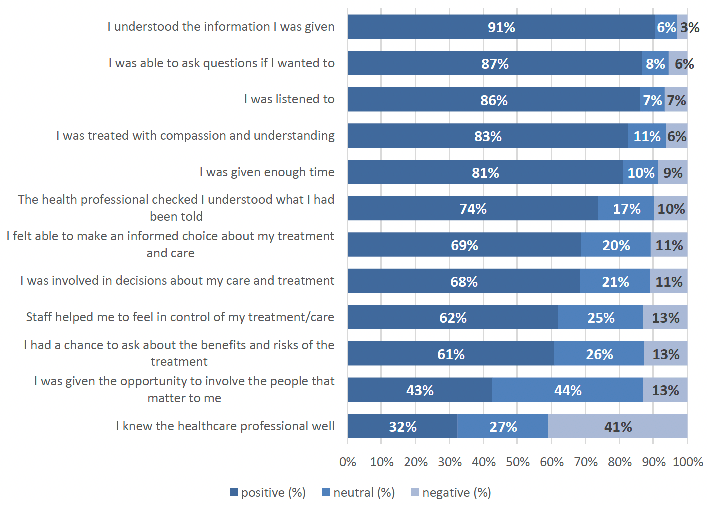
The most positively rated statements were 'I understood the information I was given' with 91% respondents rating it positively.
The statement with the lowest positive rating was 'I knew the healthcare professional well', with less than a third of people (32%) rating it positively. This statement also has a significantly higher negative rating (41%) than the other statements. However, those who had contacted their GP practice more frequently in the last twelve months were more likely to respond positively to this statement.
"It's a different doctor nearly every time I attend, so feel like I have to explain myself over and over again but never get any further with receiving help."
"I am not familiar with the new doctors at the practice and they do not know me apart from written/electronic record."
Looking at the per cent positive ratings based on whether most of the treatment or advice was provided by a doctor or a nurse, these were broadly consistent with the overall ratings as can be seen in Figure 4.3 with doctors consistently scoring slightly more positively than nurses.
"Both Doctor and Nurse were very pleasant and listened to me. They also gave me the chance to ask questions."
"My GP is excellent and involves me in any decisions/actions she takes."
Effects of Treatment or Advice
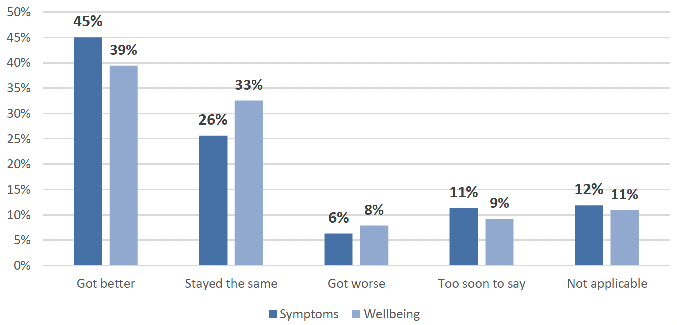
Thinking about the care that they had received from a GP practice, people were asked to describe the effect that the treatment or advice had on both the symptoms they were experiencing and their overall wellbeing. Around a fifth of people either felt that it was too soon to say or that this was not applicable to them.
Of those who were able to describe the effects, most people reported that they had got better with their symptoms more likely to improve than their wellbeing (45% vs. 39%). Very few selected 'Got worse' but around a third reported that their wellbeing had remained about the same and around a quarter reported that their symptoms remained the same. See Figure 4.4.
Overall Experience of Care provided by the GP Practice
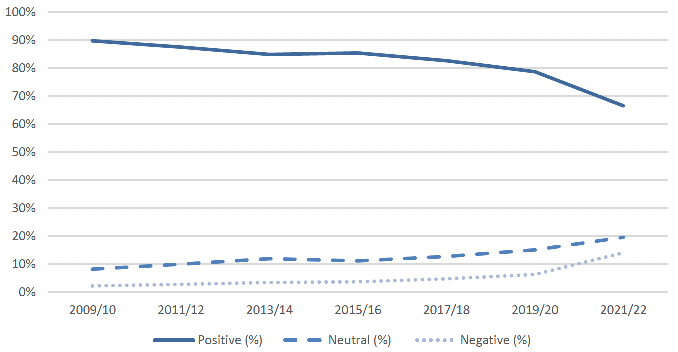
When asked to rate the care provided by their GP practice overall, 67% of people rated it positively. This is a decrease of twelve percentage points compared to the previous survey and a decrease of twenty three percentage points compared to the first Health & Care Experience Survey in 2009/10, as shown in Figure 4.5.
Contact
Email: patientexperience@gov.scot