Fiscal Framework Review: Independent Report
An independent report to consider the Block Grant Adjustment arrangements commissioned by Scottish Government and HM Treasury in June 2022, written by Professor David Bell (University of Stirling), David Eiser (formerly University of Strathclyde) and David Phillips (Institute for Fiscal Studies).
3. The current approaches to calculating block grant adjustments
This chapter assesses the approaches to calculate the BGAs that are cited in the existing Fiscal Framework Agreement reached between the UK and Scottish governments in 2016.
The method that has been used in practice is termed the indexed per capita (IPC) method, which indexes the BGAs according to the percentage change in equivalent revenues or spending per capita in rUK and the change in the Scottish population. However, the comparable model (which is effectively a percentage-based approach, but which does not fully account for differences in population growth) and the Barnett formula (a cash-terms approach, which also does not fully account for differences in population growth) are also referred to in this Agreement.
3.1 The approaches agreed in the 2016 Fiscal Framework agreement
The Fiscal Framework agreement of 2016 stated that, for devolved taxes, the 'initial deduction' – which forms the starting point on which subsequent indexation is applied – would be equal to the UK government's receipts generated from Scotland in the year immediately prior to the devolution of powers.[3] Likewise, for devolved social security benefits, the initial increases in funding were set equal to the UK government's spending on these benefits in Scotland in the year immediately prior to the devolution of powers.[4]
Different indexation methods were then agreed for tax and social security benefit spending. For tax the Fiscal Framework states that the 'block grant adjustment […] should be effected by using the Comparable Model (Scotland's share), whilst achieving the outcome delivered by the Indexed Per Capita (IPC) method'. For social security spending it states that the Barnett formula would be used, whilst again achieving the outcome delivered by the IPC method.
These arrangements were agreed for a transitional period lasting five years. The Fiscal Framework envisages that these arrangements would be reviewed following planned UK and Scottish parliamentary elections in 2020 and 2021. No assumption was made about the form of the BGAs beyond the transitional period.
Using the Barnett Formula to determine social security BGAs would mean indexing these to Scotland's population share of the cash change in spending on equivalent social security benefits in rUK (where rUK in this case refers to England and Wales, see Table 2.1 for detail). Thus, social security BGAs in Scotland in year t would be equal to the BGAs in the previous year plus Scotland's population share of the change in the relevant social security spending (S) in rUK between year t-1 and year t. This is illustrated in formula 1, below:
(1)
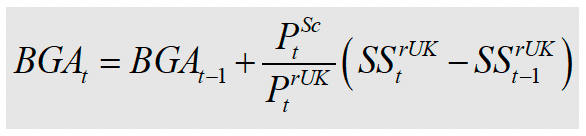
where  and
and  are the population of Scotland and rUK, respectively and
  is aggregate spending in the rest of the UK from the same social security benefit that has been devolved to Scotland.
The Comparable Model (CM) is based on the Barnett Formula but takes account of differences in the pre-devolution levels of revenues per capita in Scotland compared to the UK for the taxes to be devolved. In particular, under this method the BGAs in year t would be equal to the BGAs in year t-1 plus a population and "tax capacity" adjusted share of the change in the relevant tax revenue (T) in rUK between year t-1 and year t. The pre-devolution estimates of relative levels of tax capacity for each tax (termed 'comparability factors') used in the CM method are set out in Table 3.1 below. This is illustrated in formula 2, below:
(2)
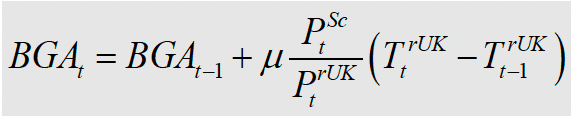
where  is the comparability factor and
  is aggregate revenue in the rest of the UK from the same tax that has been devolved to Scotland. For example, pre-devolution revenues per capita in Scotland for income tax are estimated to have been 79.8% of the level of those in rUK. This means that under the CM method, the BGA for income tax would be changed by 79.8% of Scotland's population share of the change in income tax revenues in rUK.
| Devolved area | Comparability index (%) |
|---|---|
| Income tax | 79.8 |
| Stamp Duty Land Tax | 51.5 |
| Landfill tax | 108.3 |
| VAT | 98.9 |
| Air Passenger Duty | 117.5 |
| Aggregates Levy | 189.1 |
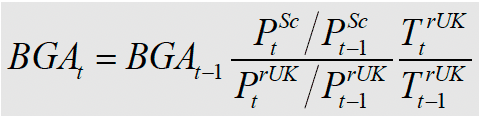
The Indexed Per Capita (IPC method) indexes the change in the BGAs according to the per capita percentage change in equivalent revenues (or spending) in rUK and the change in the Scottish population. Using the percentage instead of cash-terms change in revenues (or spending) in rUK adjusts for the different levels of revenues (or spending) per capita in Scotland relative to rUK, playing the same role as the 'comparability factors' used in the CM method. In addition, using the change in revenues (or spending) per capita rUK and the change in the Scottish population adjusts the change in revenues (or spending) in rUK for differences in the rate of change in population between Scotland and rUK.
The formula used in the IPC method is illustrated in equation 3, below:
(3)
There are thus two main areas of difference between the three different methods:
- First, whereas both the CM and the IPC methods take account of the different initial levels of revenue or spending per capita (via the comparability factors and using percentage as opposed to cash changes, respectively), the Barnett Formula does not do so. In practical terms, whilst the Barnett Formula would allocate Scotland the same per capita cash increase in spending as occurred in rUK for the social security BGAs, the CM and IPC methods both adjust these cash-terms changes up or down to take account of differences in initial levels of spending per capita between Scotland and rUK.
- Second, whereas the IPC method takes full account of any differential population growth (by using the change in revenues per capita in rUK and Scotland's population growth), the CM method and Barnett formula do not do so. In practical terms, whilst the IPC method adjusts the size of the tax BGA to fully take into account relatively faster or slower population growth in Scotland than rUK, the CM method and Barnett formula would not.[5]
In practice, the agreement to achieve the outcome delivered by the IPC method means that it is the IPC method that was agreed and has been used since 2016, irrespective of the references to the Comparable Model and Barnett formula in the 2016 Fiscal Framework Agreement. The other approaches were referenced because of disagreements between the Scottish and UK governments about which approaches best achieved the Smith Commission principles, and were in other ways 'fair' to both the Scottish and UK governments. The convoluted language of using one approach but achieving the outcome of another does not aid transparency and public understanding though – which responses to our call for evidence suggested should be a key aim for the approach agreed beyond the transitional period.
3.2 Consistency with the Smith Commission principles
We now assess the consistency of the IPC method, the Comparable Model and the Barnett Formula with the Smith Commission's principles. We first compare IPC with CM in the case of devolved taxation. We then compare IPC with the Barnett formula in the case of social security spending.
Taxation: comparing the IPC and CM methods
UK shocks
In broad terms both the IPC and CM methods offer significant protection to the Scottish budget from UK-wide revenue shocks. If an adverse economic shock causes tax revenues to fall UK-wide, the BGA will also fall to offset the reduction in Scottish tax revenues.
There is an important difference between the methods however. The effect of IPC is that the UK government bears the risk of UK-wide falls in revenues per capita. The effect of CM is that the UK government bears the risk of UK-wide falls in total revenues.
It could be argued that it makes more sense to think about a 'shock' in the context of how it affects revenues per capita. Primarily this is because revenues per capita are the more relevant variable on which to consider the severity of a shock for the public finances. (A situation where revenues fall only because population has fallen does not necessarily pose a fiscal constraint; equally, a situation where revenues per capita fall but total revenue grows as a result of population growth does likely pose a fiscal constraint). This would suggest the IPC method better satisfies this principle.
Economic responsibility
The Smith Commission's economic responsibility principle states that the Scottish budget should 'benefit in full from policy decisions by the Scottish Government that increase revenues… and should bear the full costs of policy decisions that reduce revenues…'
Both the IPC and CM methods broadly achieve this. If the Scottish government changes tax policy in a way that increases revenues relative to the equivalent revenues in rUK, the Scottish budget will be better off to the extent of the differential growth in revenues compared to BGA. If, on the other hand, the Scottish government introduces a tax policy that reduces Scottish revenues relative to revenues in rUK, the Scottish budget will be worse off.
It can be argued that the CM method better achieves the principle in relation to policies that boost revenue through their effect on population. For example, suppose that the Scottish Government were to undertake a policy that led to an increase in net migration into Scotland, boosting the Scottish Government's income tax revenues. Under the IPC method, this would be offset by an increase in the BGA for income tax, given that its value depends on growth in the Scottish population. The Scottish Government would therefore not benefit fully (and indeed may not benefit at all) from the revenue effects of this policy. In contrast, under the CM method, which does not update the level of the existing BGA for differential population growth, the Scottish Government would benefit from the higher revenue resulting from the larger population. It is worth noting, however that the Scottish Government has few policy levers directly linked to population growth (although social security and higher education policies may affect fertility and net migration).
It is also worth noting that both methods imply that the Scottish budget bears the risk of any divergence in the growth of revenues (CM) or revenues per capita (IPC) compared to rUK, regardless of the cause of that divergence - not just divergences resulting from policy decisions. For example, Scottish revenues might grow more quickly (or more slowly) than the BGA because some aspect of the tax base – such as employment or earnings – grows more quickly or slowly in Scotland than in rUK. In theory, some proportion of any divergence in the relative growth of the tax base is likely to be the result of Scottish Government policy – whether that be policy in relation to taxation, housing, education, transport, etc., recently or further in the past – and some proportion of any divergence in tax base growth is likely to be the result of factors that are wholly outwith the control of the Scottish Government – such as the impact of the international oil price on the offshore economy and onshore supply-chain. But in practice it will never be possible to ascertain what proportion of tax base divergence is attributable to Scottish government policy, and what proportion is attributable to something else.
Strictly speaking the Smith Commission did not say that the Scottish budget should bear the risk of all divergence in tax revenue growth – it only explicitly said that the Scottish budget should bear responsibility for divergence in revenue growth that is the result of 'policy decisions'. In practice however, given the impossibility of identifying the causes of divergent revenue growth, it is inevitable that tax devolution has been designed to imply that the Scottish Government bears all risks associated with divergence in revenue growth once a tax has been devolved.
No detriment
It is worth making a distinction between the no detriment principle in a static sense, and in a longer-term, more dynamic sense.
Both the IPC and CM approaches largely achieve the principle that there should be no detriment from the initial decision to devolve a revenue stream. The fact that the initial deduction is defined as the revenues actually raised in Scotland the year prior to devolution – and not, for example, its population share of UK revenues – means that the Scottish budget is not disadvantaged if a tax is devolved for which Scotland raises relatively less tax per capita than rUK. Similarly, the UK government is not disadvantaged when it devolves a tax for which revenues per capita are somewhat higher in Scotland than in rUK.
In this sense both methods achieve the no detriment principle in its static interpretation.
One possible caveat to this relates to taxes for which there is a degree of volatility in Scotland's share of revenues. In this case basing the initial deduction on a single year of data (rather than averaging over a period of several years) could cause detriment to either the Scottish Government or UK government, depending on whether the year used is one with above or below-average revenues. For this reason, the initial BGA for cold weather payments, a means-tested benefit paid to certain households during periods of particularly cold weather, the number of which varies significantly year-to-year, was based on a 10-year average of spending in Scotland on these payments.
However, averaging over several years is not always appropriate – in particular when underlying economic trends or pre-devolution policy changes are leading to secular changes in Scotland's share of revenues over time, averaging over several years will increase the likelihood of 'detriment' to either the Scottish or UK government at the initial point of devolution. Moving from using one year to averaging over several years could also lead to zero-sum arguments about which set of years to average over.
As well as considering the 'no detriment' principle from the perspective of the initial transfer of revenues, the no detriment principle can also be considered in a longer-term, or 'dynamic' perspective. Indeed, when defining the 'no detriment' principle the Smith Commission Agreement referenced not only the initial BGA, but also the need for an 'appropriate' method for subsequently indexing the BGA. The question is then: 'is a given BGA indexation method expected to cause detriment to either government in the longer term?'
For example, there may be a strong reason to expect particular factors/trends, which neither government have much control over, to lead to slower (or faster) growth in the aggregate tax base being devolved to Scotland, relative to the rUK. In this case it could be argued that failure to take this into account in the design of the BGAs would cause detriment, since the Scottish budget would be disadvantaged (or advantaged) in expectation because of those likely future trends.
Consider the case of differential population trends. The change in population is an important determinant of the change in aggregate tax revenues. Because the Scottish population is expected to fall relative to the population of rUK in the coming decades (continuing a long-run trend) one would reasonably expect aggregate Scottish tax revenues to fall relative to those of rUK too. Conditional on the existing population projections being realised, aggregate revenues in Scotland would only keep pace with those in rUK if revenues per capita consistently increased by more in Scotland.
If one believes that there is little the Scottish Government can do to influence the rate of population change in Scotland relative to that of rUK, not accounting for differential population growth when indexing the BGAs would arguably represent a breach of the 'no detriment' principle. This is because the initial decision to devolve the tax would imply that the Scottish budget would, over time, likely be disadvantaged relative to the 'no devolution' counterfactual as a result of population trends which the Scottish Government has relatively little ability to influence.
In summary then, both the IPC and CM method largely achieve the no detriment principle in its static sense, at the initial point of devolution. However, in subsequent years, while the IPC method would prevent the Scottish budget from suffering detriment as a result of differential population growth rates, the CM method would not do so. If one believes that the no detriment principle applies not only at the initial point of devolution, but also applies dynamically in expectation in subsequent years too, the IPC method better achieves the 'no detriment' principle dynamically, over time.
Taxpayer fairness
Both the IPC and CM methods partially achieve the taxpayer fairness principle, but neither of them achieves it in full.
To see why this is the case, consider what happens if the UK government increases income tax rates in rUK, raising additional revenue. If this additional revenue were spent on services that in Scotland are devolved, the Scottish Government would receive its population share of the increase in spending via the Barnett formula. If it were instead spent on reserved services (such as defence, foreign affairs, debt interest, or the State Pension), Scotland would again receive a share of the extra UK government spending that would, on average, be close to its population share.[6]
If this was all that happened, the taxpayer fairness principle would clearly be violated: Scottish residents would benefit from higher spending without paying the higher taxes paid elsewhere in the rest of the UK. However, the increase in revenues in rUK would lead to a higher BGA under both the IPC and CM methods of indexing the BGAs. This would offset at least part of the higher funding received by Scotland, partially achieving the taxpayer fairness principle.
However, the reason that neither method achieves the taxpayer fairness principle in full is that the changes in the BGAs under these approaches do not exactly match up with the change in UK government funding via the Barnett formula or spending on reserved services. This is because these BGA indexation methods take account of differences in revenues per capita for the devolved taxes at the point of devolution, either by using percentage changes in revenues or tax-capacity-adjusted changes in revenues as opposed to population-adjusted changed in revenues.
For taxes for which revenues per capita were initially lower in Scotland (income tax and stamp duty land tax), the change in the BGA would be smaller than the population-based change in funding. As a result, the net effect of a tax rise in rUK would be to increase overall funding for Scotland, whereas the net effect of a tax cut in rUK would be to decrease overall funding for Scotland.
Conversely, for taxes for which revenues per capita were initially higher in Scotland (such as landfill tax, air passenger duty and aggregates levy), the change in the BGA would be bigger than the population-based change in funding. In this case, the net effect of a tax rise in rUK would be to decrease funding for Scotland, and vice versa for a tax cut. Changes in taxes in rUK could therefore result in higher or lower funding for Scotland despite Scottish residents seeing no changes in the taxes they pay.
A hypothetical example, shown in Table 3.2, can help illustrate this issue. The figures chosen have been rounded to aid in exposition but roughly approximate relative levels of income tax revenues in rUK and Scotland. (In Section 3.3 we use actual tax revenue outturns to show how big a difference using the IPC and CM methods has made since 2016, relative to indexing the BGAs using an approach that would satisfy the taxpayer fairness principle).
Initially, just prior to devolution, income tax revenues in rUK are £200 billion and those in Scotland £15 billion. The population of rUK is 58 million, while that of Scotland is 5.3 million. This means revenues per capita are equal to approximately £3,450 and £2,830, respectively. Scotland's revenues per capita are therefore 82% of those of rUK. This means that whereas a £1 increase in spending in rUK funded by a tax increase in rUK would fund, on average, a £1 increase in spending in Scotland via the Barnett formula or on reserved services, the BGA would increase by only 82p, partially but not fully offsetting this. A £1 increase in revenues per capita in rUK would therefore generate an 18p increase in spending in Scotland despite no change in taxes paid in Scotland. This would violate the taxpayer fairness principle.
| Year 1 | Year 2 | % change | £ change | |
|---|---|---|---|---|
| rUK | ||||
| Revenues | £200bn | £210bn | 5% | £10bn |
| Population | 58mn | 58mn | 0% | |
| Revenues per capita | £3,448 | £3,621 | 5% | £172 |
| Scotland | ||||
| BGA | £15bn | £15.75 | 5% | £0.75bn |
| Population | 5.3mn | 5.3mn | 0% | |
| BGA per capita | £2,830 | £2,972 | 5% | £142 |
| Extra funding under Barnet | £0.914bn | |||
| Change in net funding (Barnett – BGA) | £0.164bn | |||
Source: Authors' calculations.
The sums involved could be substantial. Suppose that immediately following devolution of income tax to Scotland, the UK government enacted a policy raising £10 billion in rUK, equivalent to a 5% increase in revenues. If population was unchanged in both Scotland and rUK then under both the IPC and CM methods, the BGA for income tax would increase by 5%, from £15 billion to £15.75 billion. However, Scotland's population share of the revenue increase in rUK (£10bn*5.3/58) is £0.914 billion.
If the additional UK government revenue were spent on services that were devolved to Scotland, the Scottish Government would receive a net increase in funding of £164 million (£0.914 billion via the Barnett formula, offset by an £0.75 billion increase in the BGA) despite people in Scotland paying no additional income tax. The impact if the UK government's additional tax revenues were spent on reserved services would vary depending on what services were funded, but would again, on average, highly likely outweigh the impact of the higher BGA.
Of course, revenues in rUK may be reduced if the UK government cut income taxes. In this case, Scotland's population share of the reductions in spending (or increase in borrowing) would be bigger than the offsetting reduction in the BGA. A £10 billion tax cut in rUK would, for example, reduce the net funding for the Scottish Government by £164 million, despite people in Scotland paying the same taxes as before.
Scotland would similarly gain from increases and lose from decreases to stamp duty land tax rates in rUK, where Scottish revenues per capita are even lower relative to rUK. The overall scale of such transfers to/from Scotland would be smaller though given the much smaller revenues from this tax.
In contrast, for air passenger duty and aggregates levy, where Scotland's revenues per capita are higher than rUK's, tax increases would reduce funding and tax cuts increase funding for Scotland – although revenues from these taxes are even lower than for stamp duty land tax, meaning any transfers to/from Scotland would be small in cash-terms.
Summarising the argument so far, neither the IPC and CM methods achieve the taxpayer fairness principle in full because they account for differences in Scotland's tax capacity when adjusting the BGAs, whereas funding via the Barnett formula or through spending on reserved services does not do this.
The CM method is closer to achieving the taxpayer fairness principle though in one respect: its treatment of differential population growth. This is because the CM method, like the Barnett formula, does not fully account for differential population growth. There is therefore a symmetric treatment of population growth in the BGAs and the calculation of the underlying block grant. In contrast, as discussed already, the IPC method fully accounts for differential population growth. Using the IPC therefore means that there is an asymmetry in the treatment of differential population growth when calculating the BGAs and the underlying block grant.
For example, consider a scenario where revenues in rUK increase only because of growth in the population, and these revenues are spent on items that generate funding for Scotland via the Barnett formula. Under the CM method, the BGA would increase by Scotland's population and tax capacity adjusted share of the increase in income tax revenues, offsetting at least part of the additional funding received under the Barnett formula.
In contrast, under the IPC method, if Scotland's population did not grow, the BGA would not increase at all, reflecting this unchanged Scottish population and the unchanged revenues per capita in rUK. Hence, the Scottish Government's funding would increase by its full population share of the change in revenues and spending in rUK, with no offsetting change in the BGA,
More of the revenues resulting from population growth in rUK would therefore be transferred to Scotland under the IPC method than under the CM method. The violation of the taxpayer fairness principle would therefore be 'greater' under the IPC method than the CM method.
Note that if population growth was greater in Scotland than in rUK, the reverse reasoning could apply: the mismatch between the treatment of population under the Barnett formula and the IPC method could effectively transfer revenue from Scotland to rUK, violating taxpayer fairness in the opposite direction.
Summary
Neither the IPC or CM methods fully satisfy all of the Smith Commission principles.
Both largely satisfy the principle that the UK government should bear the risk of UK-wide shocks, although arguably the IPC approach is a little more consistent as we may expect common shocks to lead to equivalent falls in revenues per capita rather than in total revenues.
Both largely satisfy the principle that the Scottish Government should be responsible for the effects of its policies on devolved tax revenues. Arguably, the CM method is a little more consistent though as it allows the Scottish Government to benefit from policies that increase revenues through boosting the Scottish population.
Both partially but far from fully achieve the taxpayer fairness principle, offsetting part but not all of the higher spending that Scotland would benefit from when tax revenues in rUK are spent. Arguably, the CM method is a little more consistent as it treats differential population growth in a way that is symmetric to the Barnett formula.
Both largely satisfy the no detriment principle in the first year of devolution (in the static sense) by setting the initial BGAs equal to the revenues being devolved. In subsequent years though, a projected fall in the Scottish population relative to that of rUK means that under the CM method the Scottish budget would be expected to be lower as a result of tax devolution unless revenues per capita increased more rapidly than in rUK. In contrast, the IPC method would protect the Scottish budget from the effects of this expected relative population decline. If one believes the 'no detriment' principle applies dynamically, in expectation, in the years following devolution, the IPC method is therefore more consistent with this principle.
Social Security: comparing the IPC and Barnett Formula methods
For devolved social security benefits, BGAs compensate the Scottish Government for the additional spending associated with these new responsibilities. Rather than reducing the Scottish budget, they increase it. The 2016 Fiscal Framework agreement suggested that social security BGAs would be determined by the Barnett Formula, but that until 2020/21 they would be set using the IPC method, after which time they would be reviewed.
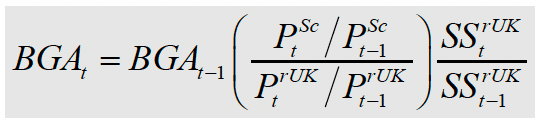
As discussed previously, under the IPC method, increases in the BGA are based on the change in spending per capita in rUK and Scotland's population growth rate. The formulae for the social security BGAs are listed in equations (1) previously and (4) below for the IPC method:
(4)
The Barnett Formula approach to BGA indexation would instead imply that an increase (reduction) in spending in rUK on the relevant benefit would lead to Scotland receiving its population share of that increase (reduction).
As we noted above, there are thus two key differences between the IPC method and the Barnett formula:
- Initial differences in spending per head: The Barnett Formula increases the BGA by a population share of the total change in equivalent rUK spending, whereas IPC increases the BGA by the same percentage increase in per capita revenues as in rUK revenues, which takes into account different baseline levels of spending per capita.
- Relative population change: the IPC method takes into account relatively faster or slower population growth in Scotland and adjusts the BGA accordingly, whereas the Barnett Formula does not. Practically, if Scotland's population were to grow more (or less) quickly than rUK's, the IPC would allocate Scotland a larger (or smaller) BGA to reflect this, whereas the Barnett Formula would not.
The fact that the Barnett Formula approach does not take into account either relative population change or differences in initial spending per person in Scotland compared to rUK, means that the outcomes that it delivers over time can be difficult to predict.
If rUK spending on equivalent social security benefits increases, then the social security BGAs would be increased by a population share of this increase in spending. If population grows at the same rate in Scotland and rUK, the increase in the BGA is therefore equivalent to the same increase in nominal spending per capita as in rUK. But if Scotland has higher per capita spend on the equivalent benefits initially, this extra cash represents a smaller percentage increase in the BGA than the percentage increase in equivalent rUK spending. If this process continued indefinitely, under the Barnett Formula approach, levels of per capita funding for devolved benefits in Scotland would converge to rUK levels.
However, this assumes that there is no difference in population growth between Scotland and rUK. Slower population growth over time in Scotland could offset the impact of convergence. In fact, if population growth is significantly slower in Scotland, this could more than fully offset the impact of convergence. To see why this could be the case, suppose that population increases in rUK but not in Scotland. Population growth in rUK causes total spending on social security benefits to increase, despite there being no change in spending per capita. The Barnett Formula increases the social security BGA in line with Scotland's population share of the increase in total rUK spending. But this is despite the fact that there has been no increase in Scottish population.
The extent to which the Barnett Formula approach to indexing BGAs leads to convergence in resources per capita depends on an interaction between the growth rate of total spending on social security benefits in rUK, and differences in relative population growth. If spending grows rapidly over time (because of higher inflation for example) and the Scottish and rUK populations grow at the same rate, convergence could occur rapidly. If on the other hand, growth in cash spending in rUK is low, and Scotland's population grows significantly more slowly than rUK's, Scotland may see its resources per capita grow by more in percentage-terms over time relative to those in rUK.
UK shocks
As with taxation, Scotland's social security budget is largely protected from the effects of UK-wide economic shocks by both the IPC and Barnett Formula mechanisms. If an economic shock is followed by expansion of the social security budget in rUK, the social security BGA will rise to increase the Scottish budget. However, under the IPC method, the increase in spending and therefore of the BGA reflects percentage changes in per capita social security spending, whereas under the Barnett Formula it reflects changes in aggregate cash-terms spending. And a UK-wide shock which increases spending on social security in would be more likely to result in equivalent per capita percentage increases in social security spending than in aggregate cash-terms spending. For this reason, the IPC method probably better meets the principle that the UK government should continue to bear risks associated with UK-wide economic shocks.
Economic responsibility
The Smith Commission 'economic responsibility' principle means that the Scottish Government should fully bear the financial costs or benefits of changes in devolved social security benefits policy.
Both the Barnett Formula and IPC approaches largely achieve this principle. If Scottish Government policy changes cause spending on devolved benefits to increase, there is no compensatory transfer through the BGAs, and the costs of the policy variation are therefore met by the Scottish Government.
It is possible however that under certain circumstances, the Barnett Formula approach will be more likely to meet the economic responsibility principle. The Scottish Government could in principle make such significant changes to policy that affect spending on devolved social security through changes in population growth, for example via migration. In this case, the IPC approach would increase the Scottish government's BGA for social security – with the implication that part of the budgetary impact of the policy change was being met by additional transfers from the UK government, rather than by the Scottish budget.
No Detriment
In relation to social security, the Smith Commission "no detriment" principle in its static sense has been implemented by setting the initial social security BGAs equal to the level of UK government spending in Scotland for each of the devolved benefits in the year immediately prior to devolution. This parallels the application of the "no detriment" principle to devolved taxes in their first year.
Most of the social security benefits devolved to Scotland are disability-related which are less responsive to the economic cycle than are tax receipts. Therefore, the criticism that the social security BGAs might be sensitive to the choice of year in which the transfer of spending power occurred has less weight than that for the case of devolved taxes. The use of the year immediately prior to devolution to set the BGA therefore is therefore unlikely to be significantly disadvantageous to either party.
As we discussed above in relation to taxes, the no detriment principle can also be interpreted in a more dynamic sense. If long-run structural issues that are likely to affect spending trends in Scotland relative to rUK are known about with a reasonable degree of certainty in advance of devolution happening, then failure to take these issues into account in calculating subsequent BGAs could be detrimental – or advantageous – to the Scottish budget.
The fact that the Barnett Formula approach does not take into account existing differences in spending per capita on the benefits devolved – which tends to be higher in Scotland than rUK -indicates that it may not meet the no detriment principle in a dynamic sense.
In 2019 Scottish claimants comprised 9.7 per cent of total Personal Independence Payments (PIP) in the UK, 15 per cent greater than its population share of 8.4 per cent[7]. Given broad equality of payment per PIP claimant across the UK, this suggests that spending per person is higher in Scotland than in the UK as a whole and therefore, as nominal spending on this benefit increases, the Barnett Formula BGA will increase more slowly than the Scottish Government's budget for this benefit since the increase in aggregate spending in rUK will reflect its lower rate of eligibility.
The implied 'convergence' in the level of per capita resources for funding social security is likely to breach the no detriment principle in its dynamic sense.
But as we pointed out above, this convergence effect – which is a purely mathematical artefact arising from the application of cash terms spending increases to different initial levels of per capita spending – can be offset by differential rates of population growth. Slower population growth in Scotland could, in principle, completely compensate for, or even over-compensate for, the convergence effect.
Thus, it is quite likely that application of the Barnett Formula would not be consistent with the no detriment principle in a dynamic sense, but difficult to know in principle whether it will imply detriment to the Scottish or UK budget. Simulations in the next sub-section of the report look at what may happen in practice given differences in initial levels of per capita spending and projected population growth.
In contrast, the IPC approach takes account of both initial differences in spending per capita, and different rates of population growth. With IPC, the Scottish budget would not be disadvantaged over time but the application of cash terms increases to its higher initial spending, and nor would the UK government be disadvantaged by Scotland's relatively slower growing population.
Thus, taken together, the IPC approach is more consistent with the 'no detriment' principle in a dynamic sense than the Barnett formula is.
Taxpayer fairness
The Smith Commission's 'taxpayer fairness' principle was couched in terms of taxation, and does not apply directly to social security spending.
Indirectly, the parallel with taxpayer fairness in terms of social security might be a situation where the UK government raises spending on social security benefits in rUK which are devolved in Scotland, and funds this spending increase through an increase in tax rates in rUK for taxes which are devolved in Scotland.
In this situation, the taxpayer fairness principle can only be achieved if the Barnett Formula is used to determine the social security BGA, and if an approach methodological similar to the Barnett Formula is also used to determine the tax BGA.
We discuss the reasons for this in more detail in Chapter 4, where we analyse the implications of using the Barnett Formula for determining tax BGAs. From a taxpayer fairness perspective, the advantage that this approach has is that there is symmetry between the cash change in the social security BGA and the cash change to the tax BGA. The social security BGA would increase by Scotland's population share of the rUK spending increase, and the tax BGA would increase by a population share of the rUK tax increase. These two elements would offset each other, leaving the Scottish budget unchanged from the changes in rUK to taxes and social security spending.
No other BGA approach achieves this symmetry, hence no other approach achieves the 'taxpayer fairness' principle in full. This is the case even if a given approach is applied on both the social security and tax sides.
For example, imagine that tax and social security spending BGAs are determined by the IPC method. The social security BGA would increase in line with the percentage increase in rUK spending per capita, whilst the tax BGA would increase in line with the percentage increase in rUK revenues per capita.
Since Scotland's spending per capita on devolved social security benefits is generally higher than in rUK, but its revenues per capita on devolved taxes are generally somewhat lower than in rUK, the IPC approach would tend to result in Scotland's social security BGA increasing by more in cash terms than the increase in the tax BGA. Thus, in the case where the UK government increases spending on social security benefits in rUK that are devolved, and funds this by increases in tax rates in rUK for taxes that are devolved, application of the IPC method would tend to result in an increase in the Scottish budget. If spending and taxes in rUK were to be reduced, the opposite would be true, with Scotland's funding for devolved social security falling by more than its BGA for tax devolution.
The conclusion here is thus the same as the conclusion in other parts of this report where we discuss the taxpayer fairness principle – only application of the Barnett Formula, for both tax and spending aspects of the Scottish budget, will achieve this principle in full.
3.3 Financial effects of these methods
In this subsection, we first consider how differences in the size and evolution of the factors that determine the BGA under the IPC and the alternative methods - CM for tax and Barnett for social security – have affected the Scottish Government's budget since the introduction of devolved tax and social security powers.
Second, we examine how differences between the methods are likely to provide different BGA outcomes for the Scottish Government budget using current projections of population change in Scotland and assumptions about growth in tax revenues and social security spending in other parts of the UK. The focus of these projections is on the difference between the BGAs derived from the IPC method on the one-hand and the CM/Barnett method on the other.
The effects of the different BGA indexation methods so far
The Fiscal Framework was agreed in 2016, but the timing of devolution of different powers mean that BGAs and the association indexation methods have applied for different periods for different taxes and social security benefits: from 2015/16 in the case of Land and Buildings Transactions Tax and Landfill Tax, but only since 2020/21 for most devolved social security benefits. As discussed above, the actual BGAs applied so far have been calculated using the IPC method. For all forecasts and most outturns for the BGAs, CM/Barnett Formula alternatives are available in addition to those constructed using the IPC method. For those outturns where CM/Barnett alternatives are not available (2020/21 for income tax, and 2021/22 for other taxes and social security benefits) we use forecasts for these years, based on the forecasts published at the Spring Statement 2022.
Income tax
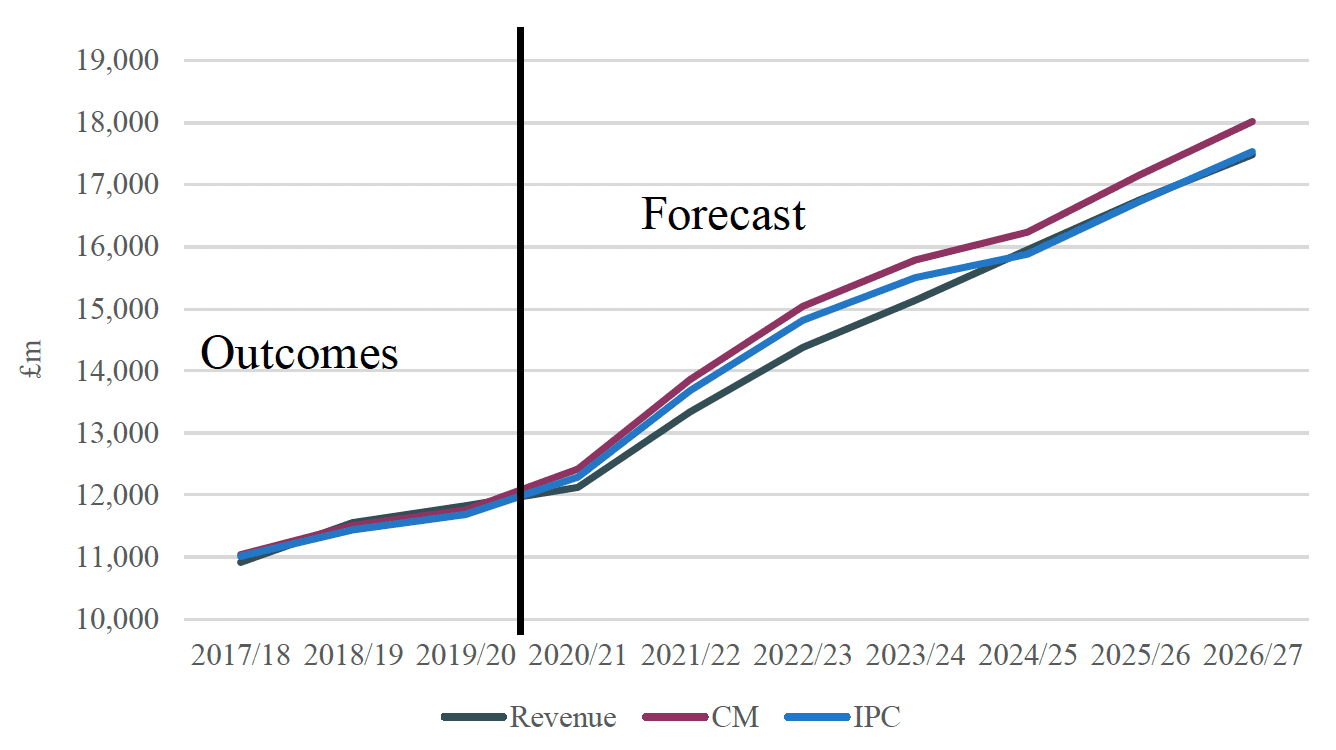
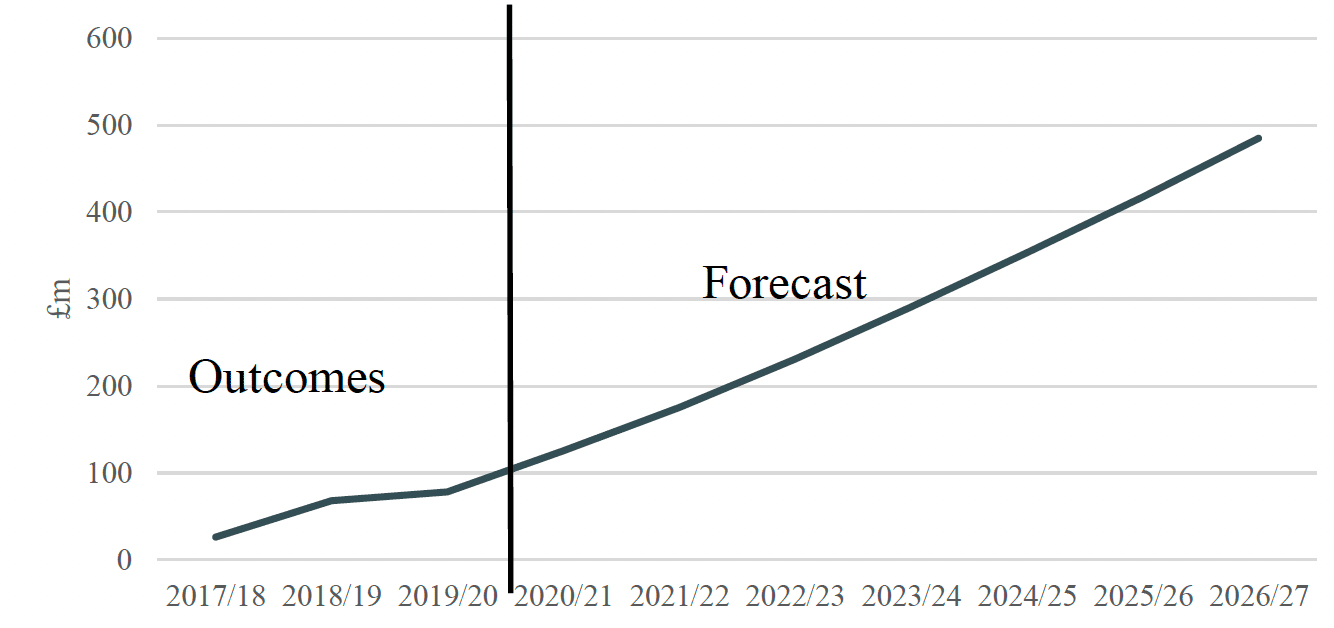
Figure 3.1 shows Scottish income tax revenues, and BGAs as calculated using the CM and IPC methods for the period 2017/18 to 2026/27, with figures for 2017/18 to 2019/20 being outturns and those for later years, the most recent forecasts. Figure 3.2 focuses more specifically on the difference between the BGAs calculated under the CM and IPC methods.
The Figures show that the BGA calculated using CM method would have been larger than that calculated using the IPC method actually used, with this difference growing over time. For example, in the current financial year (2022/23) the latest forecast for the BGA if the CM method was applied is £15,044 million, compared to £14,813 million under the IPC method actually applied: a difference of £231 million, or around 1.6% of revenues. By 2026/27, the BGA is forecast to increase to £18,019 million under the CM method, compared to £17,534 million – a difference of £485 million, or 2.8% of income tax revenues. This reflects the slower growth in Scotland's population each year, which the CM method partially adjusts for, but the IPC method fully adjusts for.
Source: Authors' calculations using HM Treasury Block Grant Transparency report and Scottish Government Fiscal Framework Data Annex.
Over the 10 years up to 2026/27, the gap between the CM and IPC BGAs is forecast to grow about £50 million per year, on average. The gap is forecast to grow more quickly over time in cash-terms, in part because overall income tax revenues are rising, but also because the gap in population growth rates between Scotland and rUK is projected to be slightly larger too.
Figure 3.1 also shows that whereas the IPC BGA is forecast to be roughly similar to Scottish income tax revenues in the mid-2020s, if the BGA were calculated using the CM method, the BGA would exceed revenues by over £400 million.
Stamp duty land tax / Land and buildings transaction tax (LBTT)
Figures 3.3 and 3.4 repeat the analysis for LBTT, and use outturns data up to 2020/21 and forecasts thereafter. They again show that if the BGA were calculated using the CM method, it would be larger than under the IPC method. In 2022/23, for example, current forecasts are that it would be £730 million under the IPC method, compared to a £716 million under the IPC method – a difference of £13 million or 1.6% of revenues. The gap is forecast to grow to £26 million by 2026/27, equivalent to 2.8% of forecast revenues. On average, the CM BGA would increase by around £2.5 million a year more each between 2016/17 and 2026/27 than the IPC BGA. This is a much smaller difference than for income tax, given the much lower revenues raised by LBTT.
The Figures also show that after lagging the BGA in 2016/17 and 2017/18, LBTT revenues have exceeded both the IPC and CM BGAs each year since, and forecast to exceed the BGAs each year until 2026/27. For example, in that year, revenues are forecast to exceed the IPC BGA by £78 million, compared to £52 million for the CM BGA.
Source: Authors' calculations using HM Treasury Block Grant Transparency report and Scottish Government Fiscal Framework Data Annex.
Source: Authors' calculations using HM Treasury Block Grant Transparency report and Scottish Government Fiscal Framework Data Annex.
Landfill tax / Scottish landfill tax
Landfill tax generates a small and declining amount of revenue. The difference between the IPC and CM BGAs is therefore small in cash-terms. For example, in the current financial year (2022/23), the BGA under the CM method is estimated to be £3 million larger than that calculated using the IPC method actually used, with this gap forecast to grow to £4 million by 2026/27. However, given that it is forecast that revenues from SLfT will be just £16 million in 2026/27, this amounts to around a quarter of forecast revenues from the tax.
Carers allowance
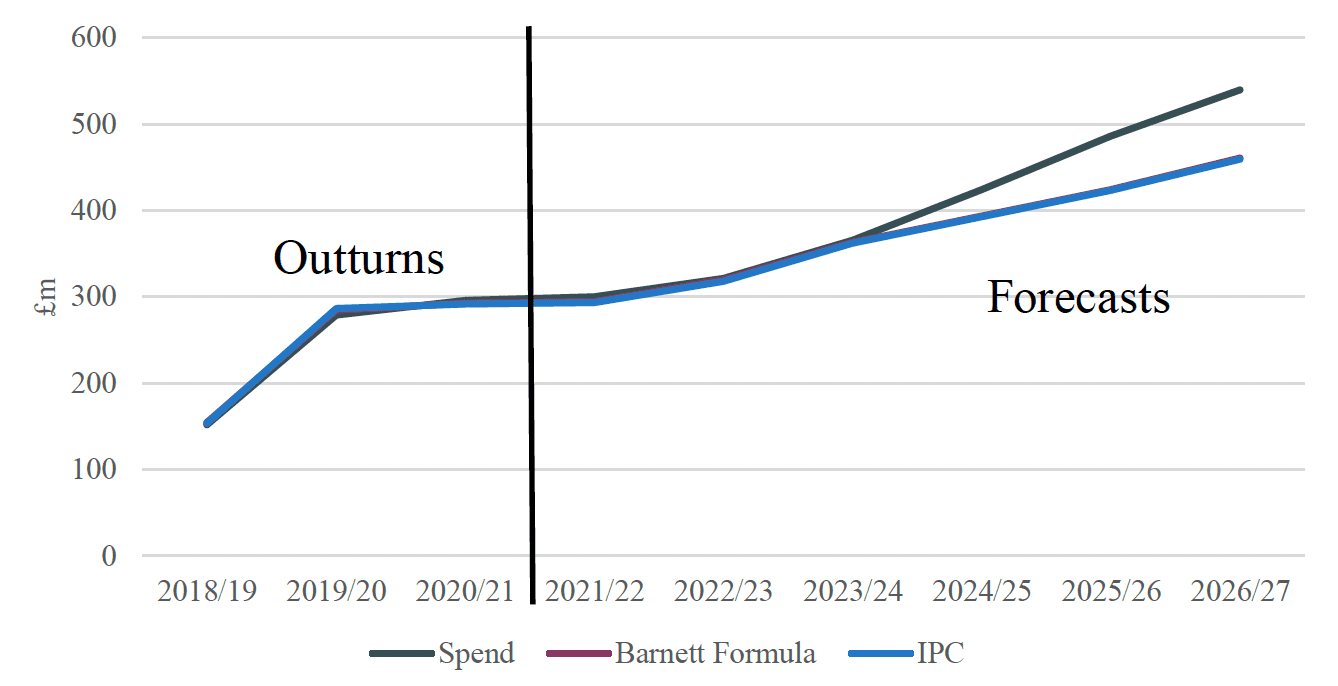
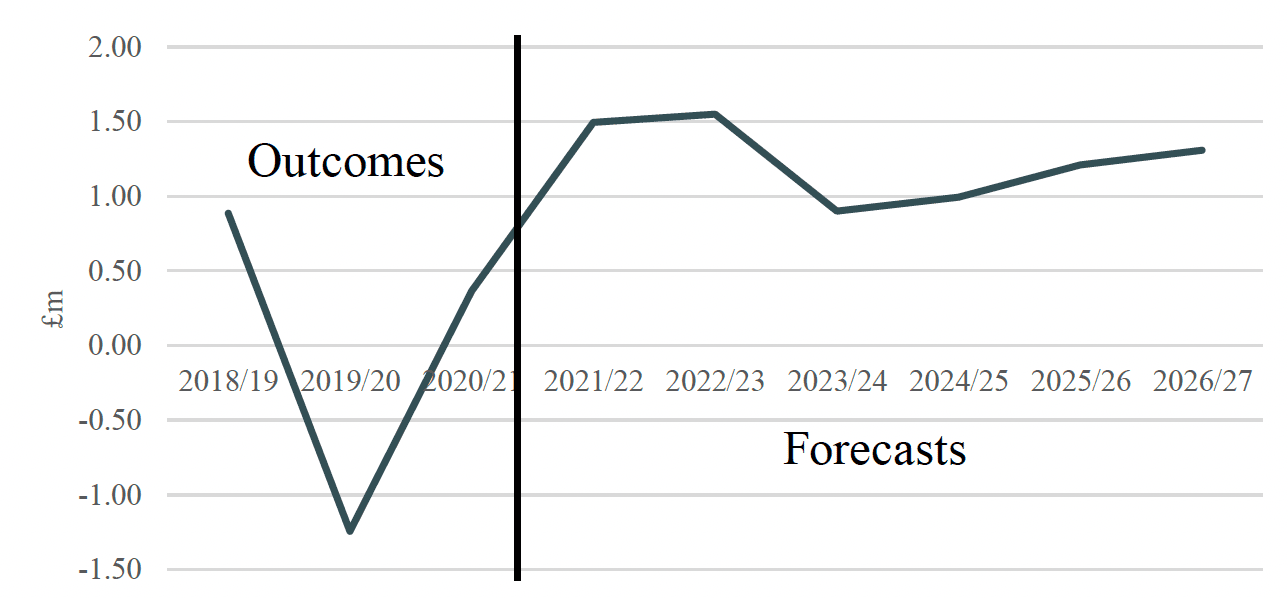
Carers Allowance was the first of Scotland's new social security powers to be implemented, part way through 2018/19. Figure 3.5 compares how the BGA would evolve if the Barnett formula were used to calculate it, with its actual value under the IPC method over the period 2018/19 to 2026/27, using outturns data up to 2020/21 and forecasts thereafter. Figure 3.6 focuses on the difference between the IPC and Barnett BGAs.
The Figures show that there is very little difference between the BGAs as calculated via the Barnett Formula and the IPC method: in no year is the difference forecast to be greater than £1.6 million, with the IPC slightly smaller in all years bar 2019/20. This reflects two offsetting factors:
- First, Scotland's population growth is slower than that of rUK, which reduces the increase in the BGA when calculated by the IPC method.
- Second, Scotland's initial level of spending per capita on Carers Allowance was somewhat higher than in rUK, which means the Barnett Formula results in a smaller percentage increase in the BGA compared to the percentage increase in spending in rUK.
The first factor outweighs the second factor in all years bar 2019/20 (when the growth in the Scottish population was close to that of rUK), but only slightly.
Source: Authors' calculations using HM Treasury Block Grant Transparency report and Scottish Government Fiscal Framework Data Annex.
Figure 3.5 also shows that expenditure is forecast to exceed both BGAs by around £80 million by the end of the forecast period – reflecting higher rates and increased eligibility in Scotland.
Attendance Allowance
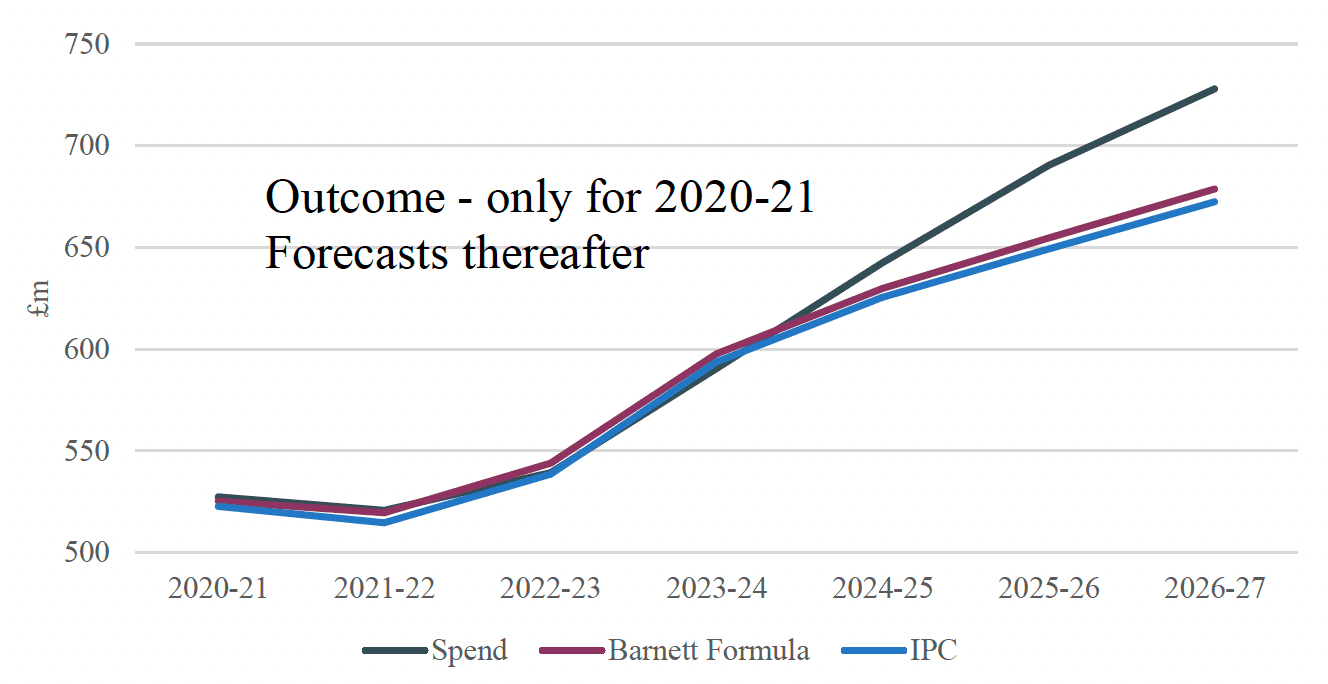
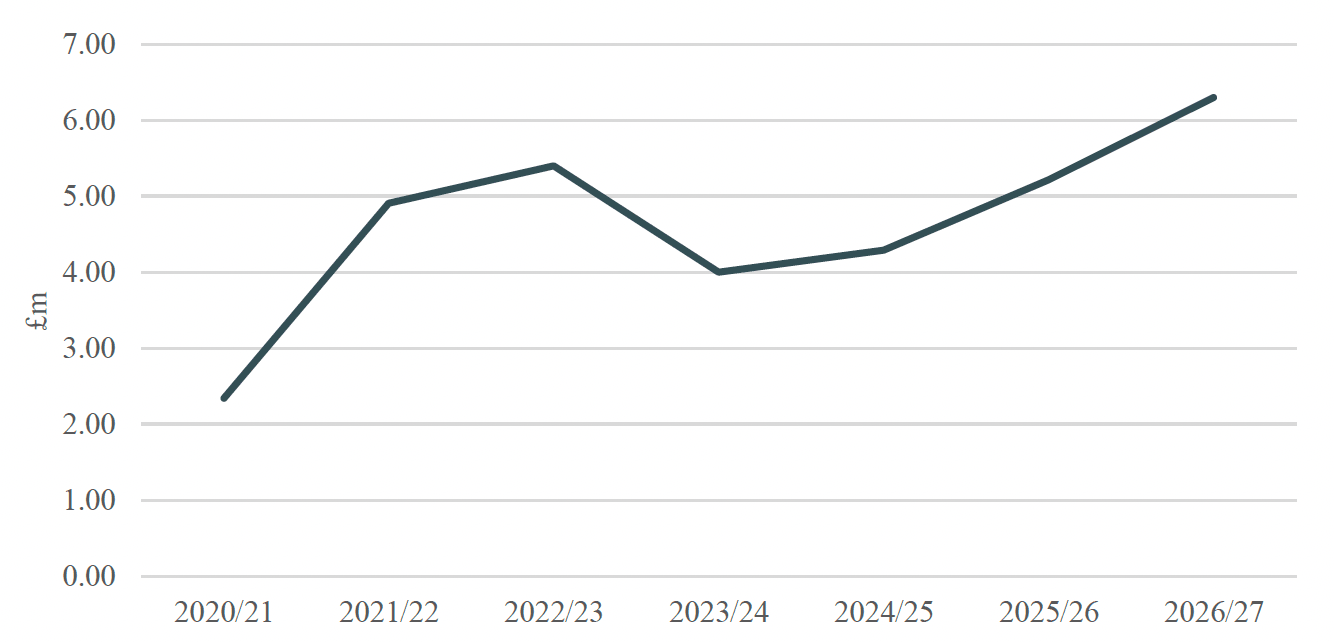
Responsibility for funding Attendance Allowance was devolved in 2020/21, with spending amounting to £528 million in that year. Figures 3.7 and 3.8 show that the choice of BGA mechanism again makes relatively little difference in cash terms, with the BGA calculated via the Barnett Formula generally £4 – 6 million larger than that calculated using the IPC method. This again reflects the impact of slower population growth in Scotland outweighing the initially higher levels of spending on Attendance Allowance per capita in Scotland.
Source: Authors' calculations using HM Treasury Block Grant Transparency report and Scottish Government Fiscal Framework Data Annex.
Figure 3.7 also shows that expenditure is forecast to exceed both BGAs by around £50 million by the end of the forecast period – reflecting increased eligibility in Scotland.
Disability Living Allowance and Personal Independence Payments
Beginning in 2013, the UK government has been replacing Disability Living Allowance (DLA) with Personal Independence Payments (PIP). Responsibility for funding DLA and PIP was devolved in 2020/21. These benefits are being replaced by Adult and Child Disability Payments but the BGA will continue to be linked to the legacy benefits in rUK. While there are separate BGAs for DLA and PIP we consider them together given that they are for the same client group.
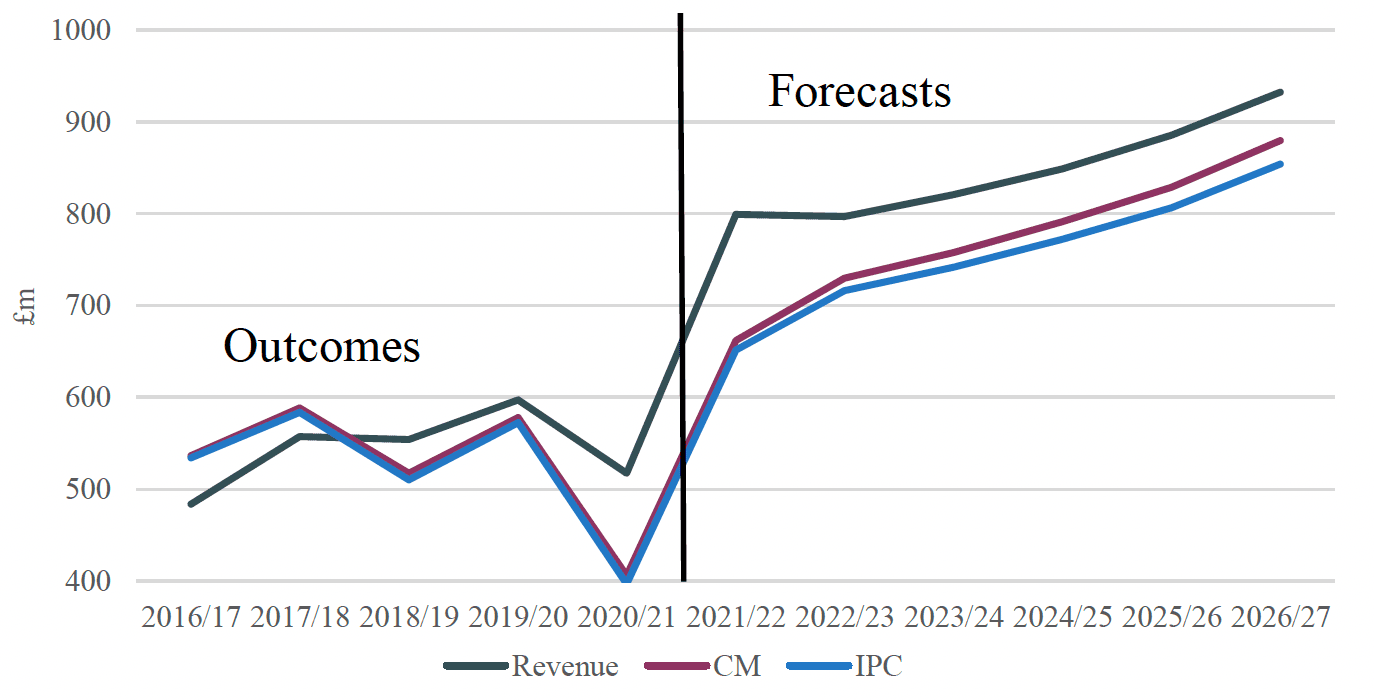
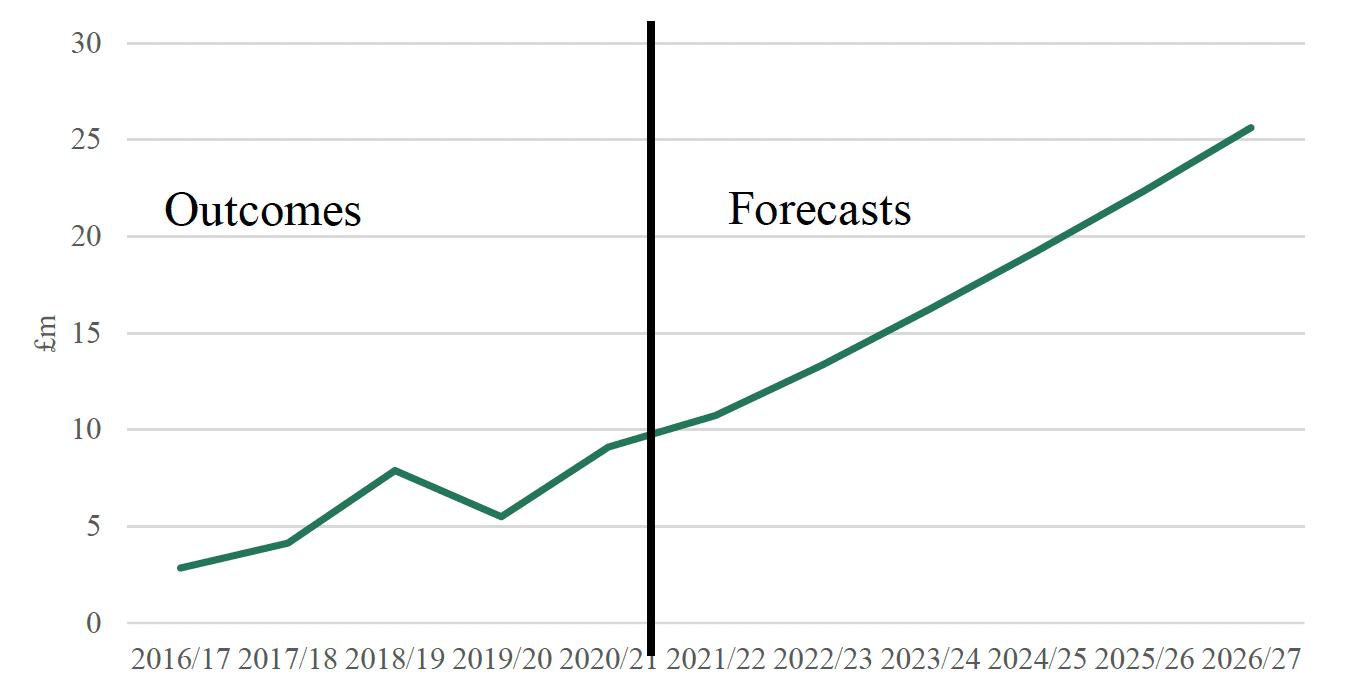
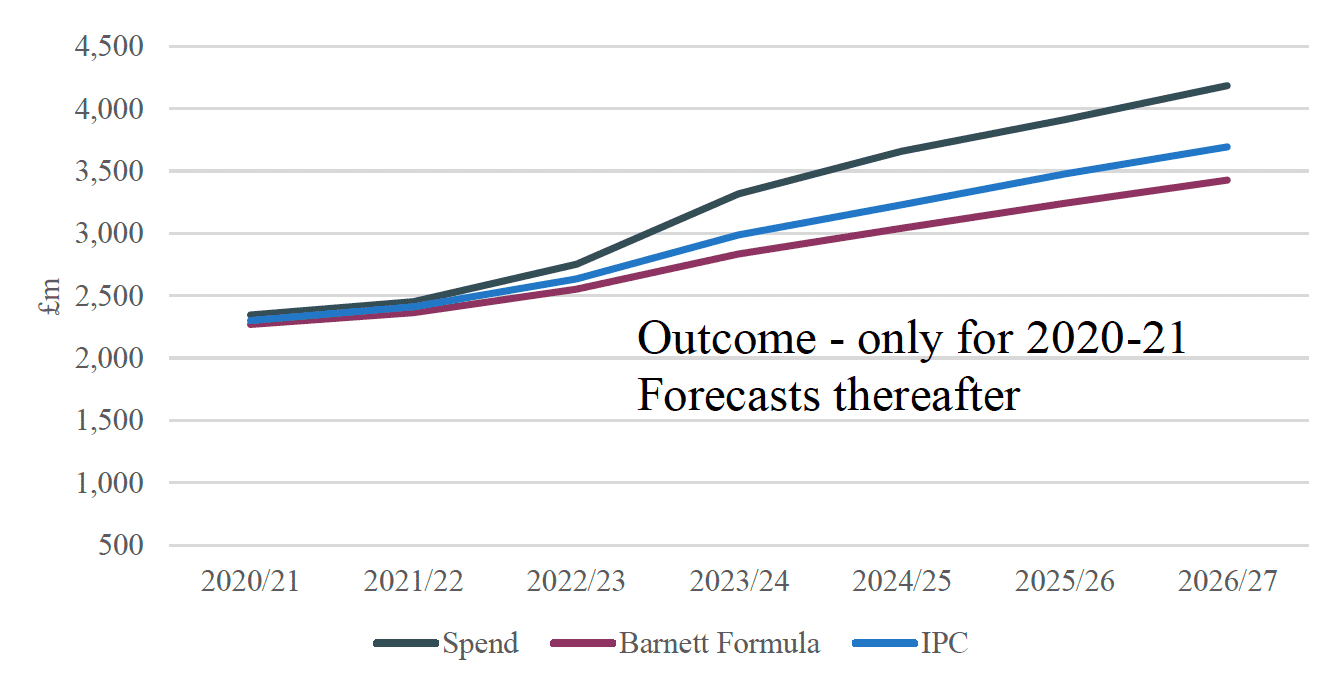
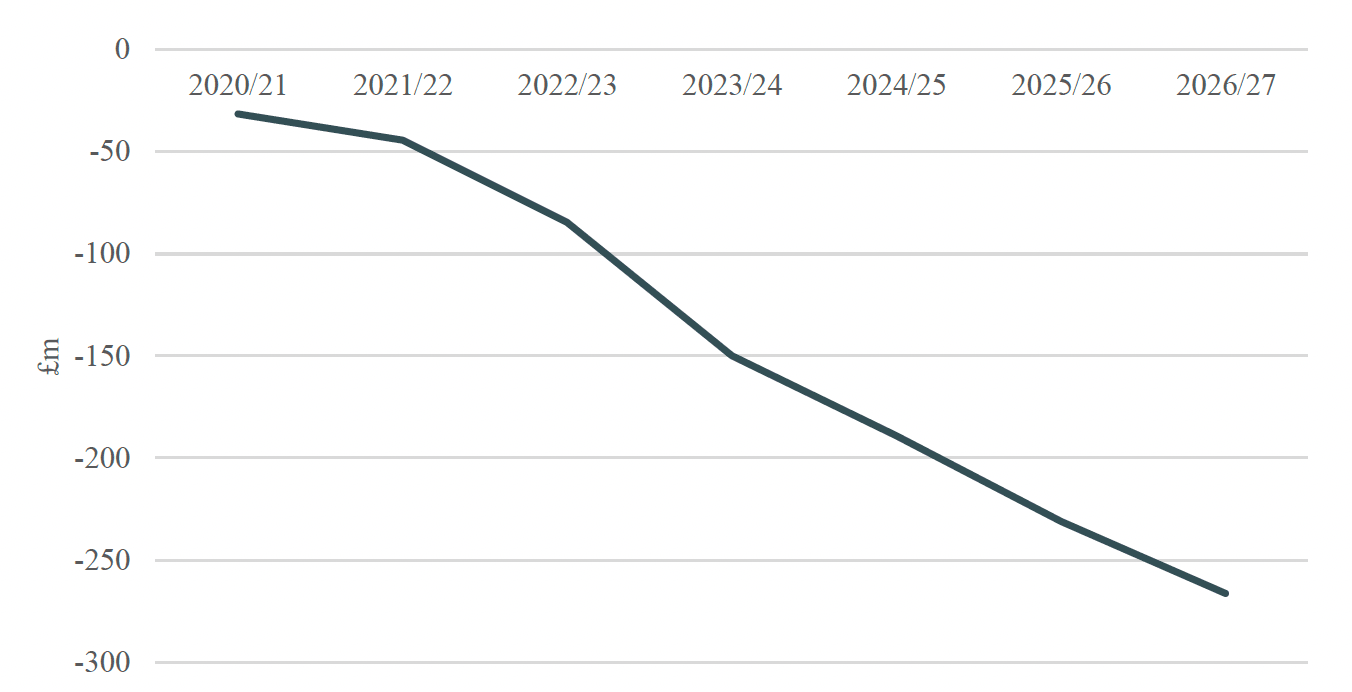
Figure 3.9 shows outturns (for 2020/21) and forecasts (for later years) for the combined DLA and PIP BGAs as calculated under the Barnett formula and the IPC method. Figure 3.10 shows the difference between the Barnett and IPC-determined BGAs. The Figures show that if the BGA were calculated using the Barnett formula it would be lower than the actual BGA as calculated using the IPC method in every year, with the difference growing over time: from £32 million in 2020/21, to a forecast £85 million in the current financial year, 2022/23, and £266 million in 2026/27.
Underlying these combined figures is a somewhat different picture for the DLA and PIP BGAs. Because of the transfer of DLA recipients to PIP in rUK, DLA spending and hence the BGAs are expected to decline in future years relative to the pre-devolution baseline year, 2019/20. Because initial spending per capita was higher in Scotland than rUK, the Barnett Formula delivers a smaller percentage reduction in the BGA that the IPC method (in a reversal of the normal 'convergence' property of the Barnett formula when spending is rising). In contrast, PIP spending is rising, and this time, the higher initial spending per capita in Scotland therefore leads to a smaller percentage increase in the BGA under the Barnett formula than under the IPC method, even accounting for Scotland's slower population growth. Because PIP spending is larger than DLA spending, and is forecast to grow fairly rapidly, its influence dominates the trends for the combined PIP and DLA BGAs.
Figure 3.9 also shows that expenditure is forecast to exceed both BGAs, reflecting the fact that the design of Scotland's new disability benefits is expected to result in greater eligibility for the new benefits relative to that for DLA and PIP. If the BGAs are determined by the IPC method, spending is forecast to exceed the BGAs by just under £500 million in 2026/27. This gap would increase to around £750 million if the Barnett formula were used to index the BGAs.
Source: Authors' calculations using HM Treasury Block Grant Transparency report and Scottish Government Fiscal Framework Data Annex.
Other benefits
The remaining social security benefits are either very small (Industrial Injuries Disablement Scheme, Severe Disablement Allowance and Cold Weather Payments) or not yet devolved to the Scottish Government (Winter Fuel Payment). The choice of BGA method for these benefits will not make a substantial difference to the Scottish budget given their small size, and in the case of, the Winter Fuel Payment, the very similar levels of spending per capita relative to rUK.
Summary
Use of the IPC BGA indexation mechanism rather than the CM and Levels Deductions (i.e. Barnett Formula) BGA mechanisms has overall benefited the Scottish Government's budget – by reducing the BGAs for Income Tax and SDLT (which are deducted from its funding) and increasing the BGA for DLA/PIP (which is added to its funding). In the current financial year the additional funding is forecast to amount to around £325 million. By 2026/27, for the current set of taxes and social security benefits devolved, this is forecast to grow to around £775 million benefit relative to indexation by the CM and Levels Deduction approach for tax and social security, respectively.
Scenarios illustrating the influence of revenue/spending growth
In the previous sub-section, we calculated effects on the Scottish Budget of using the different BGA methods (comparing IPC with CM for tax and Barnett for social security), using outturns and the latest forecasts of both Scotland's revenues and spending. In this sub-section we use of hypothetical examples to illustrate how differences in revenue and spending growth affect outcomes under the different BGA mechanisms. In the next two sub-sections we consider the influence of differences in relative population change, and cyclicality.
We base our revenue trend scenarios by projecting forward from 2020/21, the most recent year for which outturns data for all taxes and devolved social security benefits is available, and take as our starting point the IPC BGA in 2020/21. We then examine how the value of that BGA would evolve under the different BGA approaches (IPC and either CM for tax or Barnett for social security) under scenarios where comparable revenues or spending are growing at 0%, 1%, 2%, 3%, or 4% per annum. Note that the growth rates are nominal, not real. Higher inflation is likely to lead to faster growth in nominal revenues or spending, even if the real terms value of revenues and spending remains unchanged. But as we show, variation in nominal revenues or spending can affect the assessment of how different BGA methods affect the Scottish budget.
We rely on the ONS' 2020-based central population forecasts, and vary only the growth rate of comparable revenues or spending. In a subsequent sub-section we also examine the effects of variation in population growth rates.
In each case we present estimates of the gap between BGA methods, both in aggregate terms and as a percentage of Scotland's estimated revenue or spending. We present this gap at two points in time: five years and ten years after the last outturn BGA data (i.e. in 2025/26 and 2030/31).
Income tax
Table 3.3 below reports how the BGA gap changes after 5 years and 10 years of nominal income tax revenue growth between 0% and 4% in rUK.
The CM method always delivers a higher BGA than IPC. This is because, as noted previously, it does not account for Scotland's relatively slower population growth.
As rUK revenue growth increases, the gap between the two approaches narrows slightly, although the effect is small. This is because, as spending increases, the CM method accounts for an increasing proportion of the population effect, because it accounts for changes in population for the incremental revenue (but not baseline revenues, as the IPC method does).
| Income Tax | ||||||
|---|---|---|---|---|---|---|
| % Nominal Growth in rUK NSND Income Tax | 0% | 1% | 2% | 3% | 4% | |
| After 5 Years | CM - IPC BGA (Level £m) | 197 | 198 | 200 | 201 | 202 |
| CM – IPC BGA (%) | 1.6% | 1.6% | 1.5% | 1.4% | 1.4% | |
| After 10 Years | CM - IPC BGA (Level £m) | 357 | 368 | 379 | 390 | 401 |
| CM – IPC BGA (%) | 3.0% | 2.8% | 2.6% | 2.4% | 2.3% | |
Source: Authors' calculations using HM Treasury Block Grant Transparency report and Scottish Government Fiscal Framework Data Annex.
Land and Buildings Transaction Tax
Table 3.4 shows equivalent analysis of the gap between IPC and CM for LBTT. Again, as expected, CM delivers a larger BGA than IPC given Scotland's relatively slower population growth.
The difference between the methods, is percentage terms, is the same for LBTT as was the case for income tax. The cash difference between the methods is of course much smaller, since the BGA is much smaller (£397m in the baseline year of 2020/21).
| Land and Buildings Transaction Tax | ||||||
|---|---|---|---|---|---|---|
| % Nominal Growth in rUK LBTT | 0% | 1% | 2% | 3% | 4% | |
| After 5 Years | CM - IPC BGA (Level £m) | 7 | 7 | 7 | 7 | 7 |
| CM – IPC BGA (%) | 1.6% | 1.6% | 1.5% | 1.4% | 1.4% | |
| After 10 Years | CM - IPC BGA (Level £m) | 12 | 12 | 13 | 13 | 13 |
| CM – IPC BGA (%) | 3.0% | 2.8% | 2.6% | 2.4% | 2.3% | |
Source: Authors' calculations using HM Treasury Block Grant Transparency report and Scottish Government Fiscal Framework Data Annex.
Carer's Allowance
Table 3.5 shows that the Barnett formula delivers a larger BGA for Carer's Allowance than the IPC method when comparable spending growth is low, but that the difference between methods declines as comparable spending increases more quickly.
When comparable spending growth is unchanged (i.e. the growth rate is 0), then by definition the Barnett formula BGA will not change. However, given our assumptions on population growth, an unchanging level of total comparable spend implies that spending per capita on Carer's Allowance in England and Wales must be declining. The IPC-calculated BGA takes this decline in spending per capita into account – as well as Scotland's relatively slower rate of population growth – and the BGA declines accordingly.
When the growth rate of comparable spending in England and Wales is positive, the convergence property of the Barnett formula takes effect. The Barnett approach allocates a population share of the comparable spending increase to the BGA, and this takes no account of Scotland's slightly higher level of spending per capita on Carer's Allowance. The faster that comparable spending increases, the more rapidly the convergence property of the Barnett formula is realised.
| Carer's Allowance | ||||||
|---|---|---|---|---|---|---|
| % Nominal Growth in EW NSND Income Tax | 0% | 1% | 2% | 3% | 4% | |
| After 5 Years | Barnett - IPC BGA (Level £m) | 5 | 5 | 4 | 4 | 4 |
| Barnett – IPC BGA (%) | 1.7% | 1.6% | 1.4% | 1.3% | 1.1% | |
| After 10 Years | Barnett - IPC BGA (Level £m) | 9 | 8 | 8 | 8 | 7 |
| Barnett – IPC BGA (%) | 3.1% | 2.7% | 2.3% | 2.0% | 1.7% | |
Source: Authors' calculations using HM Treasury Block Grant Transparency report and Scottish Government Fiscal Framework Data Annex.
Attendance Allowance
Table 3.6 shows similar analysis for Attendance Allowance. This reveals a similar story to Carer's Allowance. When spending growth is slow, the Barnett Formula delivers a larger BGA than IPC. This is because the Barnett Formula does not take account of Scotland's relatively slower population growth.
However, as the growth rate of spending increases, the convergence property of the Barnett formula increasingly dominates the fact that it doesn't take account of relative population growth.
The reason why the difference between Barnett and IPC erodes more quickly when spending increases for Attendance Allowance relative to Carer's Allowance is that Scotland's spending per capita relative to England and Wales is higher for Attendance Allowance than it is for Carer's Allowance. Hence the convergence effect is more pronounced for Attendance Allowance.
| Attendance Allowance | ||||||
|---|---|---|---|---|---|---|
| % Nominal Growth in EW AA | 0% | 1% | 2% | 3% | 4% | |
| After 5 Years | Barnett – IPC BGA (Level £m) | 9 | 7 | 5 | 3 | 1 |
| Barnett – IPC BGA (%) | 1.7% | 1.3% | 0.9% | 0.5% | 0.2% | |
| After 10 Years | Barnett – IPC BGA (Level £m) | 16 | 13 | 9 | 5 | 0 |
| Barnett – IPC BGA (%) | 3.1% | 2.2% | 1.4% | 0.7% | 0.0% | |
Source: Authors' calculations using HM Treasury Block Grant Transparency report and Scottish Government Fiscal Framework Data Annex.
Personal Independence Payments
Adult Disability Payment (ADP) is replacing Personal Independence Payments (PIP) in Scotland, but the BGAs for PIP and DLA will determine the size of resources flowing to the Scottish budget.
As with Attendance Allowance, the size of the gap between the Barnett and IPC BGAs is small in cash terms compared with that on income tax and also differs in sign depending on the strength of the growth in spending on PIP in England and Wales. If spending grows by less than 2%, the Barnett BGA is greater than the IPC variant. At 2% or above, the IPC version is larger.
| Personal Independence Payments | ||||||
|---|---|---|---|---|---|---|
| % Nominal Growth in EW NSND PIP | 0% | 1% | 2% | 3% | 4% | |
| After 5 Years | Barnett - IPC BGA (Level £m) | 27 | 11 | -6 | -24 | -42 |
| Barnett – IPC BGA (%) | 1.7% | 0.7% | -0.4% | -1.3% | -2.3% | |
| After 10 Years | Barnett - IPC BGA (Level £m) | 49 | 16 | -19 | -58 | -100 |
| Barnett – IPC BGA (%) | 3.1% | 1.0% | -1.0% | -2.9% | -4.6% | |
Source: Authors' calculations using HM Treasury Block Grant Transparency report and Scottish Government Fiscal Framework Data Annex.
When spending growth is low, the fact that the Barnett formula does not fully account for Scotland's slower population growth outweighs its convergence properties. But as spending growth increases, the convergence effect becomes more dominant.
Disability Living Allowance
Disability Living Allowance (DLA) is being phased out and replaced with PIP in England and Wales, and with ADP in Scotland. Our simulations therefore range from 0% to -4% to reflect the declining spending.
In all cases the Barnett Formula yields a larger BGA than does the IPC method. When spending change is zero, there is no change in the Barnett BGA; but the IPC BGA falls, reflecting the implicit decline in spending per capita. As spending falls more rapidly, the difference between Barnett and IPC widens. This is because, when spending is decline, the Barnett formula delivers a 'reverse convergence' effect (Scotland receives a population share of the reduction in spending, but this population share is relatively less of its total spending, since spending per capita is relatively higher in Scotland).
| Disability Living Allowance | ||||||
|---|---|---|---|---|---|---|
| % Nominal Growth in EW NSND DLA | 0% | -1% | -2% | -3% | -4% | |
| After 5 Years | Barnett - IPC BGA (Level £m) | 12 | 21 | 30 | 38 | 46 |
| Barnett – IPC BGA (%) | 1.7% | 3.1% | 4.5% | 5.9% | 7.4% | |
| After 10 Years | Barnett - IPC BGA (Level £m) | 22 | 39 | 54 | 68 | 81 |
| Barnett – IPC BGA (%) | 3.1% | 5.8% | 8.7% | 11.7% | 14.9% | |
Source: Authors' calculations using HM Treasury Block Grant Transparency report and Scottish Government Fiscal Framework Data Annex.
Combining BGA Effects
The alternative BGA indexation mechanisms produce a range of results: in some cases the CM/Barnett indexation method exceeds the IPC version. In other cases, the reverse is true.
It also needs to be remembered that the extent to which a larger BGA is advantageous or not for the Scottish budget depends on whether we are talking about tax or social security. For tax, a larger BGA implies a larger deduction from the Scottish budget, whereas on social security, a larger BGA implies a larger addition.
Table 3.9 aggregates the impacts elucidated above across the two main devolved taxes, and the four main devolved benefits. In each case, the table shows the difference between CM/Barnett on the one hand, and IPC on the other.
The difference between CM and IPC on tax amounts to around £200m after 5 years and £400m after 10 years; this is largely as a result of income tax, with LBTT making a small contribution. Remember that the positive numbers here imply that the Scottish budget is lower with CM than with IPC.
| Combined effects for taxes and benefits | ||||||
|---|---|---|---|---|---|---|
| % Nominal Growth in Combined IT and LBTT | 0% | 1% | 2% | 3% | 4% | |
| Taxes - income tax and LBTT | ||||||
| After 5 years | CM - IPC BGA (Level £m) | 204 | 205 | 207 | 208 | 209 |
| After 10 years | CM - IPC BGA (Level £m) | 369 | 380 | 392 | 403 | 414 |
| % Nominal Growth in Social Security AA, CA, DLA and PIP | 0% | 1% | 2% | 3% | 4% | |
| After 5 years | Barnett - IPC BGA (Level £m) | 53.3 | 43.9 | 32.8 | 21.0 | 8.5 |
| After 10 years | Barnett - IPC BGA (Level £m) | 95.8 | 76.4 | 51.9 | 23.1 | -12.4 |
Source: Authors' calculations using HM Treasury Block Grant Transparency report and Scottish Government Fiscal Framework Data Annex.
When it comes to social security, the aggregate difference between Barnett and IPC across the four main payments devolved is relatively large when spending growth is low. Here, the positive difference between Barnett and IPC implies the Scottish budget is better off with Barnett than IPC.
As spending growth increases, the convergence effect of Barnett increasingly dominates the fact that it does not account for Scotland's relatively slower population growth. With nominal spending growth at 4% per annum, the difference between the two approaches is marginal. At higher rates of growth, it would become negative – the IPC approach would provide more funding.
Conclusion
This section has highlighted how the IPC and CM/Barnett BGAs would evolve over the medium to long-term, starting from 2020/21, given trend increases in the comparator fiscal measures in other parts of the UK. It has emphasised the differences in scale between income tax on the one hand and the other taxes and social security benefits on the other.
It is income tax that largely drives the gap between the IPC and Barnett/Barnett Formula BGAs. In aggregate, in all scenarios presented here the Scottish budget benefits more from the IPC method rather than the CM/Barnett approach. This reflects two factors. First, that population projections indicate that Scotland's population growth will be slower than in the comparable geographies over the next decade, meaning IPC tax BGAs will be smaller than CM tax BGAs. Second, that the tax BGAs (and especially the income tax BGA) dominates the aggregate BGA position. At faster rate of spending growth than modelled here, Scotland would also benefit from a larger BGA for DLA/PIP under the IPC method than the Barnett Formula. This is because the faster the growth in comparable spending, the more important it is to take account of Scotland's initially higher levels of spending on these benefits (which the IPC method does but the Barnett Formula does not).
This section has also shown that the gaps between the BGA methods will widen in the future because, while IPC provides full insurance against Scotland's relatively slower population growth, the CM insurance is incomplete. The outcomes also differ from the forecast values described in the previous section since recent history, for a wide variety of reasons, has not been characterised by the smooth trends projected here. Rather, they comprise a mixture of trend and cyclical patterns. In a subsequent part of this section, we respond to this observation by exploring how the BGAs respond to the comparator measures following cyclical paths rather than smooth trends.
Scenarios illustrating the effect of relative population changes
The analysis above explores the effects of variation in the growth of spending, keeping relative population growth unchanged from the latest principal projections. But as we have noted, the rate of relative population change is also important in assessing the outcomes of the different methods.
For tax, this is relatively easy to understand. The slower the rate of population growth in Scotland relative to that in rUK, the greater will be the difference between the CM and IPC methods. If population growth in Scotland is slower than that in rUK, the CM BGA will always be larger than the IPC BGA, regardless of the rate of growth of comparable revenues.
For social security things are slightly more complex. When population growth is the same in Scotland as in England and Wales, the Barnett Formula will tend to deliver a smaller BGA over time compared to IPC. This is because spending per capita is initially higher in Scotland, and the Barnett formula allocates Scotland a population share of spending increases, leading to convergence in spending per capita over time. The faster the increase in comparable spending in England and Wales, the faster the rate of convergence. The IPC method does not have this convergence property and maintains relative spending differentials.
However, when population growth is slower in Scotland than in England and Wales, this can offset the convergence property of the Barnett formula. This is because the Barnett formula only accounts for Scotland's slower population growth in relation to the spending increment.
Thus, whether the Barnett Formula or IPC methods delivers the most favourable outcome for the Scottish budget over time depends on an interaction between nominal spending growth and relative population change.
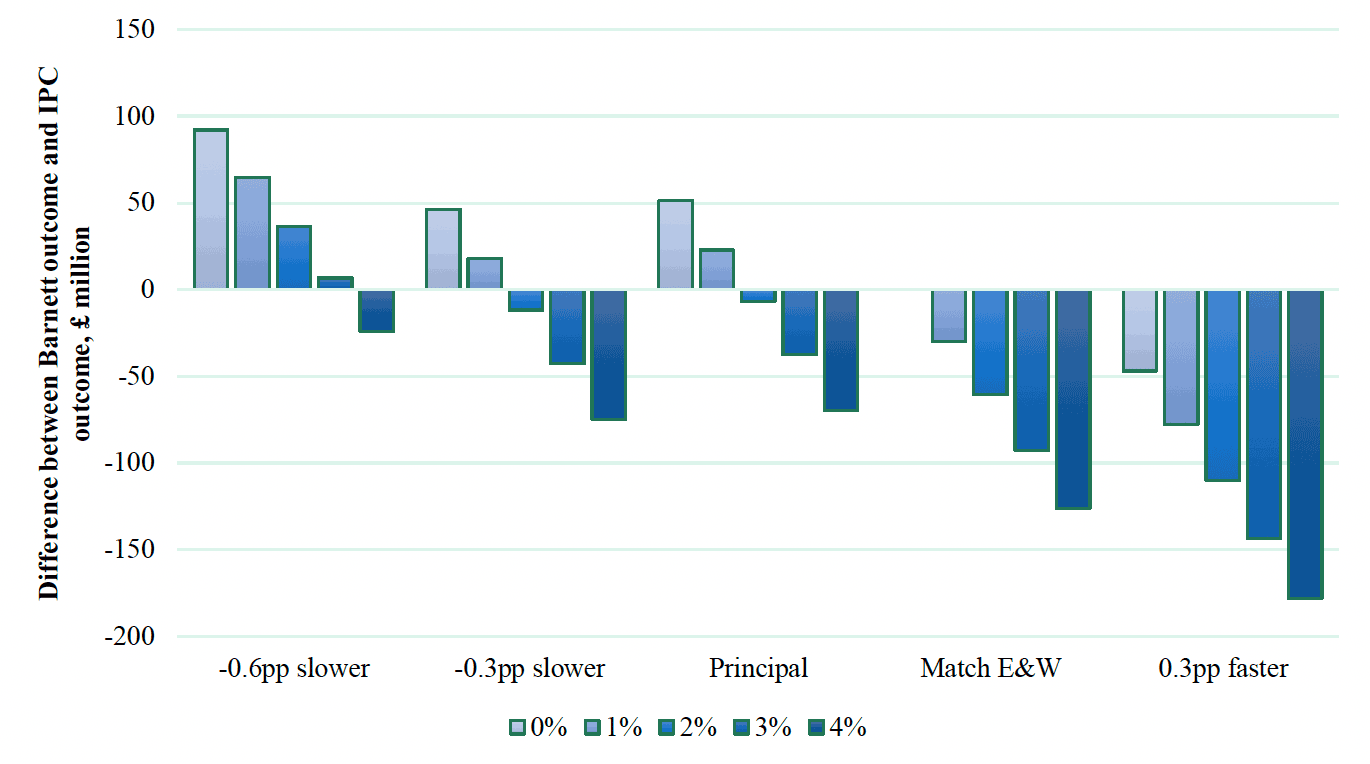
We investigate this issue in the following scenario analysis. We combine the four major social security BGAs – for Attendance Allowance, Carer's Allowance, DLA, and PIP into one. We estimate the difference between the Barnett and IPC calculated BGAs at two points in time – 2025/26, and 2030/31 (five and ten years from our baseline of 2020/21).
We explore five scenarios for comparable spending growth on those four benefits in England and Wales with five scenarios for relative population growth.
The scenarios for comparable spending growth are equivalent to those in the preceding section, and amount to annual growth of 0% to 4% respectively. The five population growth scenarios are:
- The 2020-based ONS principal population projections
- A scenario where Scottish population grows 0.6 percentage points slower than the England and Wales population each year
- A scenario where Scottish population grows 0.3 percentage points slower each year than the England and Wales population. Note that this scenario is close to the principal projection, which implies Scottish population growing 0.4 percentage points more slowly than England and Wales in the early part of the 2020s, falling to 0.2 percentage points towards the end of the decade
- A scenario where Scottish population growth matches than in England and Wales.
- A scenario where Scottish population growth exceeds that of England and Wales by 0.3 percentage points per annum.
Source: Authors' calculations using HM Treasury Block Grant Transparency report and Scottish Government Fiscal Framework Data Annex.
On the other hand, if Scottish population growth were 0.6 percentage points lower than that in England and Wales, the Barnett Formula would deliver a larger BGA than IPC, as long as the growth in comparable spending was 3% per annum or less. But if spending grew at much above 3%, the convergence effect would offset Scotland's slower population.
If Scotland's population grows 0.3 percentage points more slowly than England's – which is broadly commensurate with the principal projections – then the Barnett would deliver a larger BGA than IPC only if the growth rate of comparable spending was less than 2% per annum.
Figure 3.12 shows the same analysis, but for 2030/31. The pattern of results is the same as for 2025/26, but the amounts roughly double.
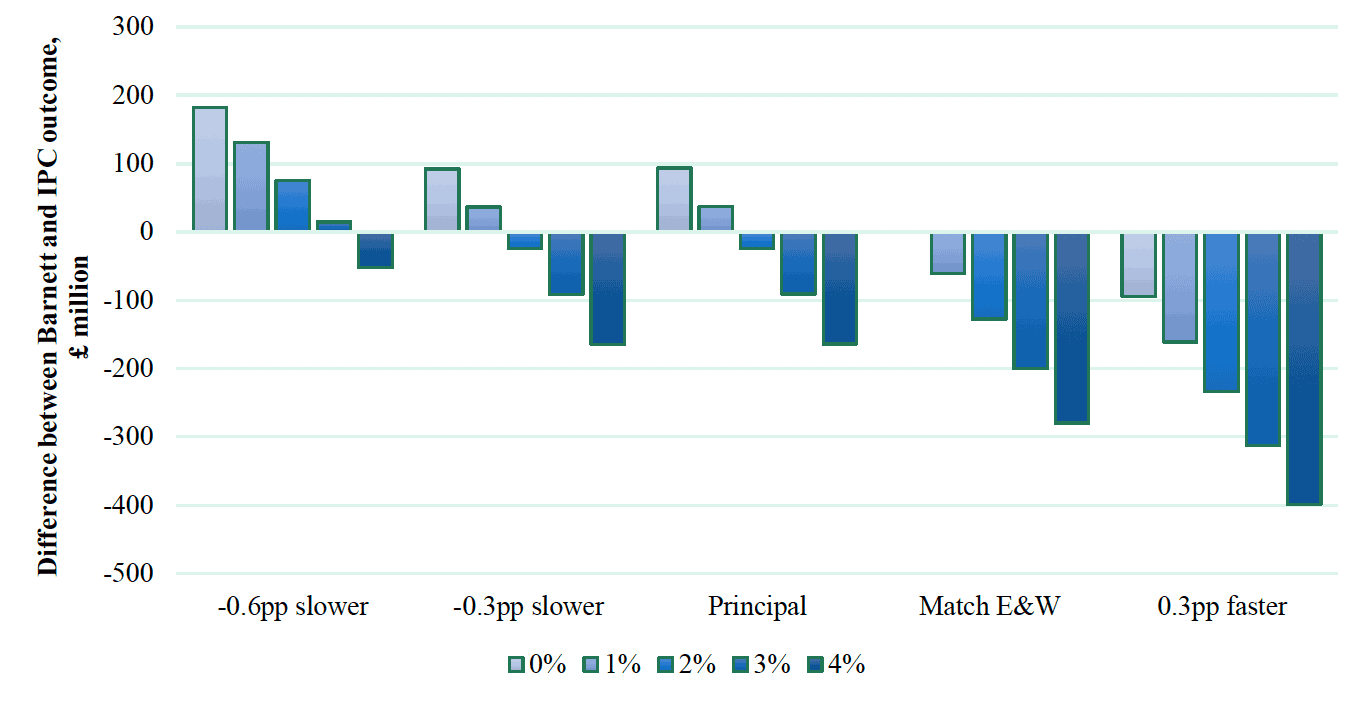
Source: Authors' calculations using HM Treasury Block Grant Transparency report and Scottish Government Fiscal Framework Data Annex.
Cyclical effects of different BGA indexation methods
We have considered how the different forms of BGA diverge in response to trends in equivalent tax revenues or social security benefits in rUK (formally rUK for taxes, and rUK for social security benefits). In this sub-section we consider how the different forms of BGA change following a cycle in revenues or spending that increases or decreases tax revenues or social security spending before returning it to its original level.
The mathematics of how a cycle in tax revenues or social security spending in rUK affects the alternative BGA methodologies are set out and explained in Appendix C. Here, we state the main results that follow from these arguments.
If rUK revenues/spending returns to its starting value after an upswing or downswing, the IPC BGA returns to its original value multiplied by the change in Scotland's population share of the rUK during the period. The path taken to get there – upswing or downswing – does not matter. The IPC method fully adjusts the BGA each year for the changes in rUK revenues/spending that have taken place since the initial year and for the change in Scotland's population share since the initial year.
The CM BGA value gives different outcomes depending on the path taken by revenues/spending in rUK even if revenues/spending return to their original value. If Scotland's population share is falling, then the changes in BGA resulting from changes in revenues/spending in the early years of an upswing or downswing will be larger due to Scotland's larger population shares in the earlier part of the cycle. Thus, even though revenues or spending return to their original value after a downswing, the CM BGA will be smaller than after an upswing. The same result holds for the Barnett Formula (and hence the Levels Deduction) BGAs because they are determined in the same way as the CM BGA with their comparability factors set to 1.
It also follows that if Scotland's population share does not change, then the CM BGA and the Barnett Formula BGA will return to their original value because the changes in revenues/spending that affect the BGA are weighted by the same population share, irrespective of when they occur during the upswing or downswing.
These properties of the IPC, CM, Levels Deduction and Barnett Formula BGA methods are explored with worked examples in Table 3.1 below. It uses tax BGAs (specifically income tax) for the example but the same logic applies to the social security benefit BGAs (and other taxes).
To keep the arithmetic simple, initial period tax revenues in rUK are set equal to 1000. The initial value of Scotland's BGA is set equal to rUK revenues times its population share (9.317%) and its tax revenue capacity (77%) for income tax: thus it equals 72.33. As in other parts of the paper, the population shares are drawn from the ONS principal population projections. Population growth rates in England and Northern Ireland are used for the comparative calculations. Over the period from 2020/21 to 2031/32 Scotland's population is expected to grow by 3.08% less than that in England and Northern Ireland.
The first row in Table 3.1 shows revenues/spending in rUK falling by 5% and then returning to its original level over an 11-year period, symmetrical around year 6. The second row shows the reverse case with revenues/spending first rising by 5% and then returning to its original value.
The 3rd and 4th rows shows how the IPC BGA evolves during first a downturn and then an upturn respectively. The rightmost column gives the percentage change in the BGA between the first and the eleventh periods. With the IPC BGA, the 11th period outcome is the same for both cases (see Appendix C equation 4). The 3.08% decline in the value of the BGA reflects the decline in Scotland's population share between the 1st and 11th periods, which ensures that Scotland's per capita BGA remains constant.
Lines 5-8 show that, unlike the IPC BGA, the CM and Barnett Formula BGAs give different outcomes depending on the path taken by rUK revenue/spending before returning to its original value. This asymmetry reflects the greater weight given to changes in the early part of the cycle when Scotland's population share is relatively high. Correspondingly, less weight is given to towards the end of the cycle. With an upswing, the CM BGA increases by 0.07% due to this effect, while with a downswing, it decreases by 0.07%. The CM and Barnett BGAs do not just depend on how rUK revenues/spending have changed since the tax or social security instrument was devolved but also on the path such spending has taken.
Lines 5-8 also show that the changes to the BGA are smaller with CM than with the LD/Barnett Formula, because the comparability factor which is set at 0.77 – its most recent value for the income tax CM BGA – attenuate the effects of changes in revenues/spending. And in an upswing, the LD/Barnett IPC increases more than the CM version: this is consistent with our results on the effects of trend increases in revenues on the BGA in the previous section and with our previous arguments about the implications of the different BGA mechanisms.
Lines 9-14 repeat the calculations in lines 3-8 except that Scotland's population share is held constant at its 2020/21 value. Comparisons with lines 3-8 of the table, where population shares are allowed to vary, therefore show how the decline in population shares affect BGA outcomes, and the effects of economic cycles.
With Scotland's population share held constant, and hence population growing at the same rate in Scotland and rUK, the IPC and CM methods produce the same result (lines 9 – 12) in both an upswing and downswing. In addition, both the CM and Barnett Formula BGAs (as well as the IPC BGAs) return to their original values: with Scotland's population share constant, the initial increase (decrease) in the BGA is exactly offset by a subsequent equal decrease (increase). This illustrates clearly that the path-dependence of the CM and Barnett Formula BGAs arises when Scotland's population share changes over time (and its relative population growth differs to rUK).
| Line | Scenario | Year | ||||||||||||
|---|---|---|---|---|---|---|---|---|---|---|---|---|---|---|
| 1 | 2 | 3 | 4 | 5 | 6 | 7 | 8 | 9 | 10 | 11 | ||||
| 1 | UK Revenues/Spend | 1,000 | 990 | 980 | 970 | 960 | 950 | 960 | 970 | 980 | 990 | 1000 | ||
| 2 | UK Revenues/Spend | 1,000 | 1010 | 1020 | 1030 | 1040 | 1050 | 1040 | 1030 | 1020 | 1010 | 1000 | % Change | |
| 3 | Value of BGA | IPC Downturn | 72.33 | 71.34 | 70.35 | 69.40 | 68.46 | 67.53 | 68.04 | 68.56 | 69.08 | 69.59 | 70.10 | -3.08% |
| 4 | IPC Upswing | 72.33 | 72.78 | 73.23 | 73.69 | 74.16 | 74.64 | 73.71 | 72.80 | 71.90 | 71.00 | 70.10 | -3.08% | |
| 5 | CM Downturn | 72.33 | 71.60 | 70.88 | 70.17 | 69.45 | 68.74 | 69.45 | 70.16 | 70.86 | 71.57 | 72.27 | -0.07% | |
| 6 | CM Upswing | 72.33 | 73.05 | 73.77 | 74.49 | 75.21 | 75.92 | 75.21 | 74.50 | 73.79 | 73.09 | 72.38 | 0.07% | |
| 7 | LD/Barnett Downturn | 72.33 | 71.40 | 70.47 | 69.54 | 68.62 | 67.70 | 68.62 | 69.53 | 70.44 | 71.35 | 72.26 | -0.10% | |
| 8 | LD/Barnett Upswing | 72.33 | 73.26 | 74.19 | 75.11 | 76.04 | 76.95 | 76.04 | 75.12 | 74.21 | 73.30 | 72.40 | 0.10% | |
| 9 | IPC Downturn (static pop) | 72.33 | 71.60 | 70.88 | 70.16 | 69.43 | 68.71 | 69.43 | 70.16 | 70.88 | 71.60 | 72.33 | 0.00% | |
| 10 | IPC Upswing (static pop) | 72.33 | 73.05 | 73.77 | 74.50 | 75.22 | 75.94 | 75.22 | 74.50 | 73.77 | 73.05 | 72.33 | 0.00% | |
| 11 | CM Downturn (static pop) | 72.33 | 71.60 | 70.88 | 70.16 | 69.43 | 68.71 | 69.43 | 70.16 | 70.88 | 71.60 | 72.33 | 0.00% | |
| 12 | CM Upswing (static pop) | 72.33 | 73.05 | 73.77 | 74.50 | 75.22 | 75.94 | 75.22 | 74.50 | 73.77 | 73.05 | 72.33 | 0.00% | |
| 13 | LD/Barnett Downswing (static pop) | 72.33 | 71.40 | 70.46 | 69.53 | 68.60 | 67.67 | 68.60 | 69.53 | 70.46 | 71.40 | 72.33 | 0.00% | |
| 14 | LD/Barnett Upswing (static pop) | 72.33 | 73.26 | 74.19 | 75.12 | 76.05 | 76.99 | 76.05 | 75.12 | 74.19 | 73.26 | 72.33 | 0.00% | |
Source: Authors' calculations.
Contact
Email: matthew.elsby@gov.scot