Potential heat network zones: first national assessment
Analysis to identify and characterise potential zones for heat networks in Scotland. It provides further detail on the analysis criteria, assessment methodology, limitations, definitions and the interpretation of the outputs.
5 Summary analysis – Stringent criteria
This Section details the key trends and outputs from the First National Assessment of Potential Heat Network Zones using the Stringent screening criteria (a linear heat density of 8,000 kWh/m/yr and at least five anchor loads). This is not an exhaustive analysis and is focused at the national level primarily.
At the end of this Section a comparison with the NCA analysis is presented. This comparison is carried out here as the NCA analysis better aligns to the stringent methodology than the Baseline. However, some material is presented from the Baseline analysis to aid the comparison.
5.1 Characterisation of demands - Stringent
The Stringent screening criteria identifies approximately 13.7 TWh of heat demand (68% or 9.3 TWh/yr comes from anchor loads – some of which are likely to already be connected to heat networks). These fall within 196 potential heat network zones (207 if split by local authority), covering 14,500 Ha. This is a large percentage of the Scottish total heat demand of approximately 79 TWh/yr (approximately 17%). However, it should be noted that whilst a property falls within a zone it may not be viable for connection, this demand total is merely to establish the upper band of demand to consider.
Approximately 115,000 different properties fall within Stringent potential zones, with 29% being non-domestic (contributing 11 TWh of annual demand) and the remaining 68% domestic (contributing 2.2 TWh of annual demand). This represents a shift towards a greater non-domestic share than with the Baseline criteria. This shift is due to a greater reliance on anchor loads (which tend to be non-domestic) and high LHD values meaning potential zones are less likely to extend into residential areas.
A breakdown of the total number of domestic properties (77,660) by tenure is provided in Figure 5—1.
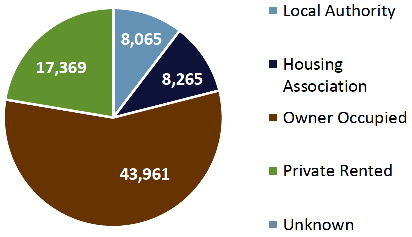
The domestic tenure figures for potential zones identified using the Stringent criteria show an even stronger shift towards private rented from owner occupied compared, than with the Baseline screening. The percentage of private rented and owner-occupied properties for the Baseline screening was 15.9% and 60.8% respectively while these changed to 22.4% and 56.6% respectively for the Stringent screening criteria.
Domestic demand by tenure broadly matches the split seen by property count. Local authority ownership makes up 10.4% of domestic heat demand (166 GWh/yr), housing association 10.6% of domestic heat demand (238 GWh/yr), owner occupied 56.6% of domestic demand (1,228 GWh/yr) and privately rented the remaining 22.4% (523 GWh/yr).
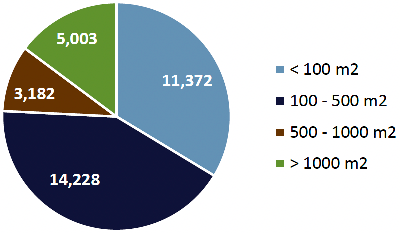
The 34,000 non-domestic demands have been characterised by building size (using floor area); counts of properties are provided in Figure 5—2.
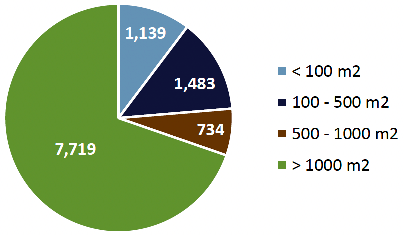
Although relatively low in number (5,003) the largest non-domestic buildings (> 1000 m2) do have a large share (69.7%) of the total non-domestic demand relating to 7,719 GWh/yr (see Figure 5—3).
Figure 5—3 Pie chart of the non-domestic heat demand (GWh/yr) in potential heat network zones (identified using Stringent criteria) by building size.
The non-domestic trends are in broad keeping with those seen when using the Baseline criteria.
In some situations, buildings will contain multiple properties, which can be a mix of domestic and non-domestic, multiple types of non-domestic use and multiple domestic tenure types. In these instances, there will be specific considerations and opportunities in connecting a building to a heat network. At a national level there are 37,000 (32%) such buildings within Stringent potential heat network zones, with a total heat demand of 4.5 TWh (33% of demand). This higher level of demand from these shared buildings is reflective of town and city centres.
40,000 properties (35%) within Stringent potential heat network zones have some form of heritage designation (within the heritage property section of this methodology the three groups for heritage designation considered are listed, within a conservation area or within a world heritage site), these have a total demand of 4 TWh. Properties built pre-1919, which can act as a proxy for heritage buildings, make up 4.6 TWh (1.2 TWh domestic and 3.4 TWh non-domestic) of heat demand within Stringent potential zones from 46,000 total properties (60% of which are domestic). It should be noted that there will be properties which are counted both within the designated heritage status measures and the pre-1919 heritage building proxy, so these values should not be aggregated.
The final characteristic considered is fuel poverty. This can add considerable sensitivity to how a potential heat network is taken forward. Within potential heat network zones identified using the Stringent criteria, 21.8% of total households are in fuel poverty (approximately 18 thousand households and approximately 400 GWh/yr heat demand) and 10.1% within extreme fuel poverty (approximately 8 thousand households and approximately 200 GWh/yr heat demand).
5.2 Characterisation of geographic distribution - Stringent
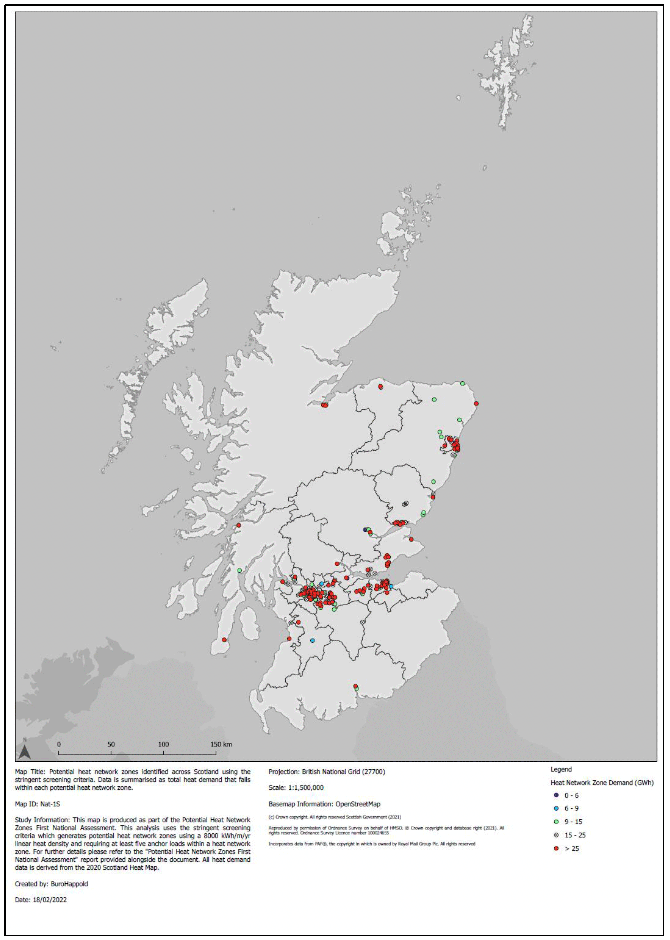
There is an even greater focus of potential heat network zones identified within the central belt when using the more Stringent screening criteria. This is due to the requirement for higher demand density in the potential zone identified using the Stringent criteria, which causes a greater focus on more urban areas. This is shown in Figure 5—4, which maps the potential heat network zones identified across Scotland. A full A3 version of this image can be found in the map pack (under the map ID Nat-1S).
These point-based heat network zones can be attributed to the different local authority areas within Scotland, as presented in Figure 5—5 (see map ID Nat-2S in the map pack).
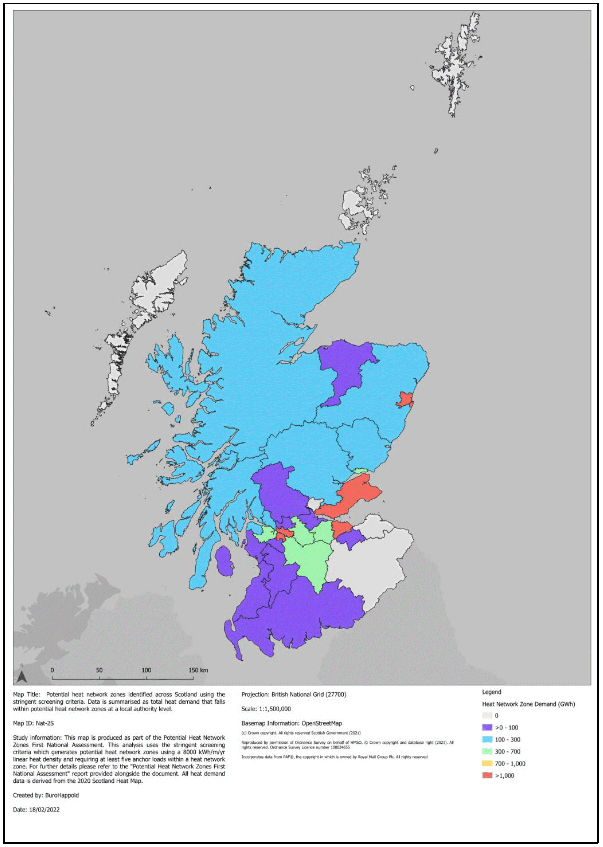
Figure 5—5 highlights that rural areas without large towns and cities often have less heat network potential, notably local authority areas which are entirely made up of islands. These island areas tend to have far lower populations, so the total demand available for potential heat network zones will be lower.
5.3 Baseline and Stringent comparison
Some comparisons have been made between the Baseline and Stringent potential heat network zones in Sections 5.1 and 5.2. This section pulls out some additional comparisons, focusing on the summary statistics elements of the Excel Summary Tables.
In both the Baseline and Stringent potential zones, anchor loads represent the majority of heat demand, 55% and 68% respectively. The greater dominance of anchor loads in the potential zones identified using Stringent screening criteria is to be expected, given the requirement for five anchor loads as opposed to two. This also reflects that Stringent screening highlights potential zones which are more traditionally the focus of heat networks, where a number of high demands are located in very close proximity.
This focus on larger loads is also seen when comparing the number of properties and the total demand. The Baseline potential heat network zones have an average demand per property of approximately 70 MW/a compared to approximately 120 MW/a for properties identified in potential zones using the Stringent criteria.
Fuel poverty is more prevalent in potential heat network zones identified using the Baseline screening criteria (26.1% of households) than the national average of 24.6%, whilst the zones identified using the Stringent criteria fall below the national average with 21.8% of households in fuel poverty. One potential reason being a greater level of affluence in the centre of urban areas which dominate the potential zones identified with Stringent criteria. Although analysis of other factors, such as energy efficiency levels, would be important to give greater context to the reasons for this difference in fuel poverty levels.
The Stringent criteria identifies potential zones with a higher level of heritage properties, compared to those identified with the Baseline criteria. With 35% of properties being heritage designated and 40% pre-1919 in potential zones identified using Stringent criteria, compared to 23% and 30% for Baseline. Again, this is characteristic of the older centres of large urban areas which are the focus of the most heat dense potential zones.
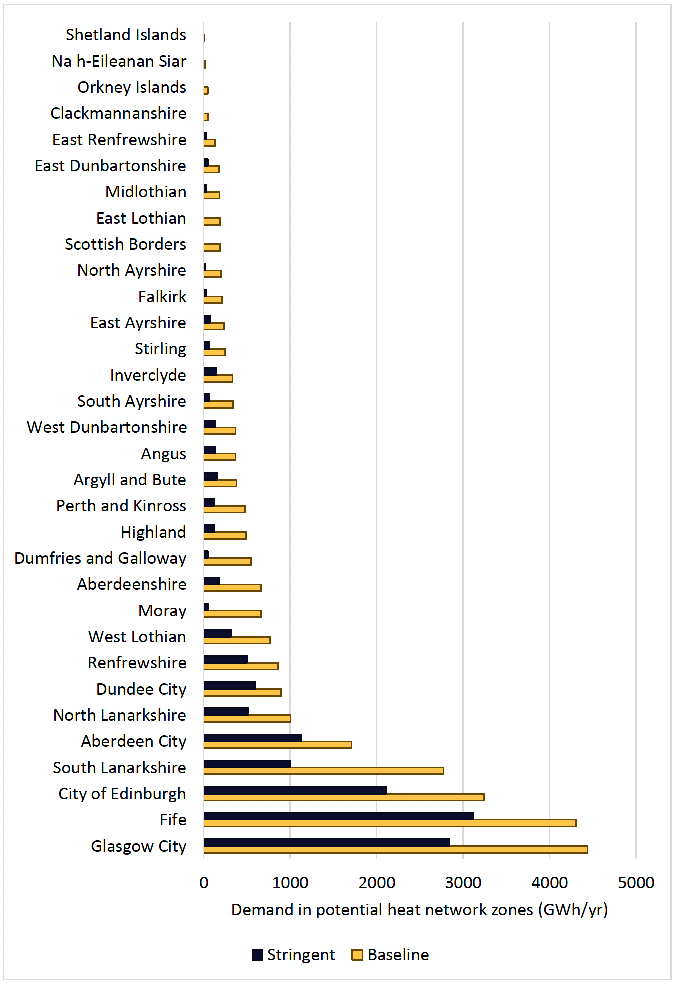
The final comparison examines local authority level data, with demand falling within potential heat network zones being examined for both the Baseline and Stringent screening criteria. This analysis shows that the four local authorities with the largest heat demands in potential zones identified using the Baseline screening (Glasgow City, Fife, City of Edinburgh and Aberdeen City) also observe the highest demands for the Stringent Screening. As well as this, these four local authorities also present the four smallest percentage changes in relation to the heat demand difference of the Baseline screening compared to the Stringent screening, with an average % drop of 33% while the dataset average was 63% (for local authorities which had heat demand zones present under both screening scenarios). However, the local authorities with the sixth to tenth highest total heat demands show an average of a 50% reduction, and eleventh to fifteenth a 79% reduction, whilst the twenty-eighth to thirty-second average a 96% reduction.
This shows the importance of including a lower threshold for screening some areas for potential heat network zones, as otherwise all or most potential zones will be screened out. However, for the local authorities with more potential, having a more Stringent screening still retains a large percentage of total demand but helps focus on the more demand dense areas. This is illustrated by the area covered by potential heat network zones reducing by an average of 59%, when switching from Baseline to Stringent screening for the five local authority areas with the highest heat demand in potential heat network zones.
Figure 5—6 details the demand breakdown in potential heat network zones by local authority for both the Baseline and Stringent screening criteria.
5.4 Opportunity areas (NCA) comparison
The headline figure identified within the NCA for potential heat network demand in Scotland is 15.0 TWh (this is based on using the NCA medium LHD scenario), compared to 13.7 TWh as the total demand within potential zones using the Stringent criteria in the FNA. The values are relatively close, with differences due to the higher LHD requirement in this study (6,607 kWh/m/yr in the NCA compared to 8,000 kWh/m/yr for the Stringent criteria), the higher number of anchor loads compared to the NCA (the NCA only required more than two buildings to connect) and no limit on the LHD buffer size in the NCA analysis. These factors combine to cause a higher demand identified in potential heat network zones in the NCA, more than offsetting the loss in heat demand in potential zones from the screening out of buildings with a heat demand of under 73 MWh/yr.
In terms of geographic distribution of potential heat network zones, there is broad alignment with the outputs from the NCA (see Figure 5—7) and this FNA work (see Figure 5—8) in term of potential zone location but a disparity in terms of spatial extent. For reference the NCA covers an area of 1,620 km2 and FNA approximately 150 km2 using Stringent criteria and 450 km2 using Baseline criteria, whilst the area of Scotland is 77,910 km2.
The immediate visual difference when comparing the NCA with the FNA national map outputs is the land coverage of potential heat network zones. The FNA, when using Stringent criteria, covers 9% of the area covered by the medium LHD value for the NCA. The unconstrained linear heat density buffer used in the NCA analysis, compared to the 250 m limit applied in the FNA analysis, is the key contributing factor to the difference in land area of potential zones between the scenarios compared here.
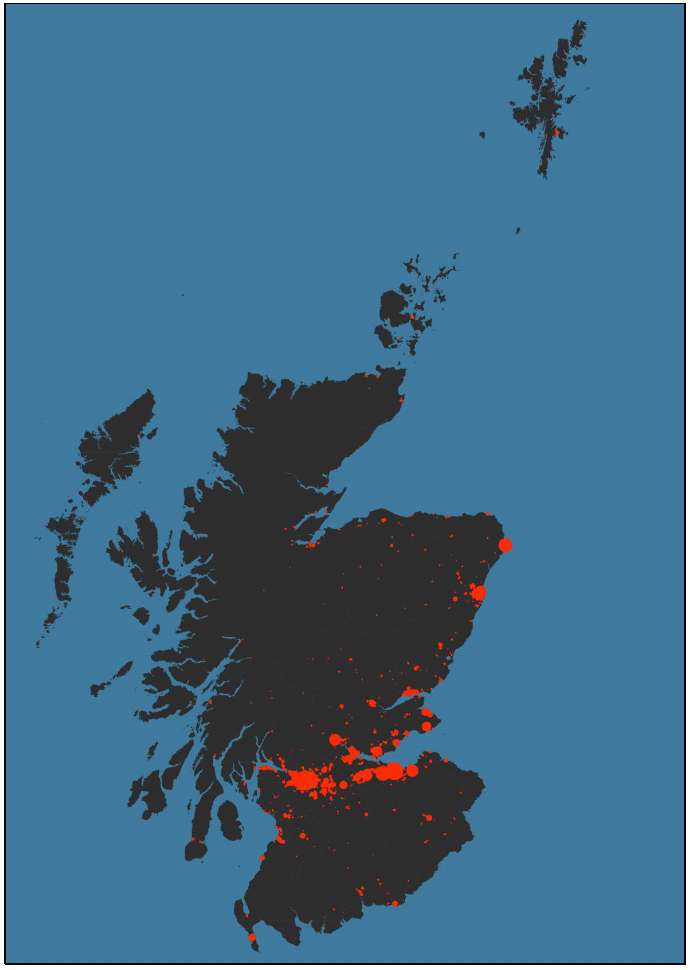

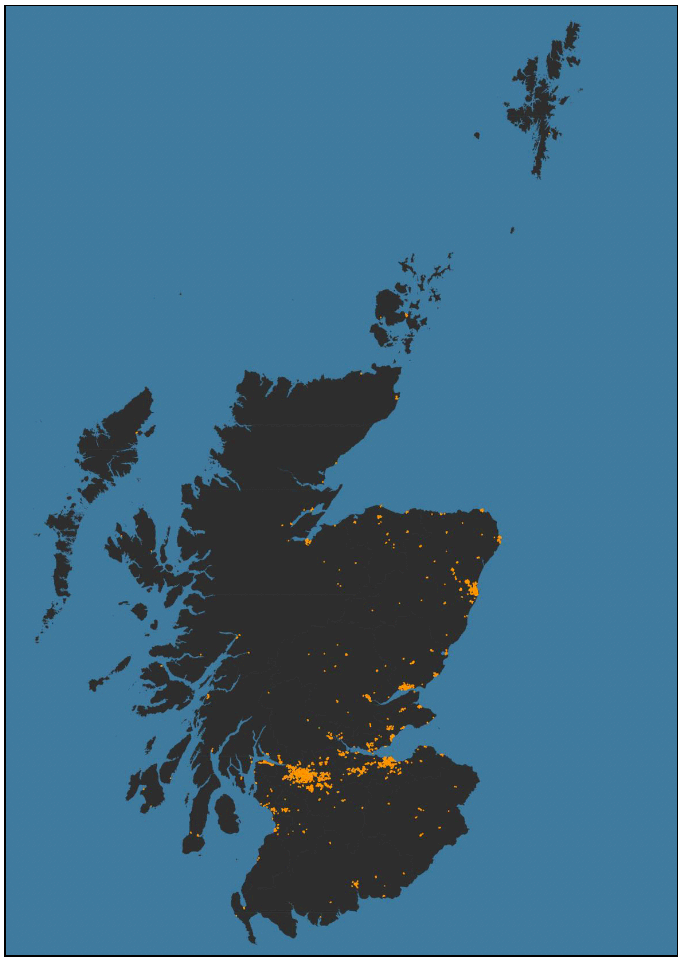
In both analyses, the central belt area is highlighted as a focus for potential heat network zones. However, there are differences in other areas between the 2 sets of outputs, one being the lack of potential heat network zones identified in island locations in Figure 5—8 (FNA) compared Figure 5—7 (NCA). The lack of identification of potential zones in island areas in the FNA is due to the five anchor load requirement in the Stringent analysis; the density of properties fulfilling this requirement do not occur in the island environments. This is why the geographic distribution of potential heat network zones in the NCA looks more similar to that created using the Baseline screening (see Figure 5—9), where a minimum of only 2 anchor loads is required to identify a potential zone.[39] There are, however, still differences between the NCA outputs and the Baseline outputs, due to the slight variation in approaches. The most significant example of this is the Baseline screening identifies a cluster in Irvine on the Ayrshire coast, opposite Arran, which does not appear in the NCA outputs displayed in Figure 5—7.
There are clear benefits in carrying out analysis using both a Stringent and Baseline set of screening criteria. With Stringent criteria only, some key zones will be missed in rural areas, however, using just Baseline criteria, in some dense urban areas, it will be impossible to differentiate the most promising areas. The latter point is illustrated in Figure 5—9, with near-whole urban local authority areas being covered by potential zones.
It should be noted that although the output maps look similar, the demand in potential heat network zones identified using the Baseline criteria is substantially higher than that in the NCA, with 25.7 TWh of demand being identified within potential zones in the FNA compared to the demand identified using the low LHD of the NCA of 17.3 TWh. The NCA being lower primarily due to the exclusion of all heat demands below a threshold of 73 MWh/yr.
Contact
Email: heatnetworks@gov.scot