Potential heat network zones: first national assessment
Analysis to identify and characterise potential zones for heat networks in Scotland. It provides further detail on the analysis criteria, assessment methodology, limitations, definitions and the interpretation of the outputs.
2 Methodology
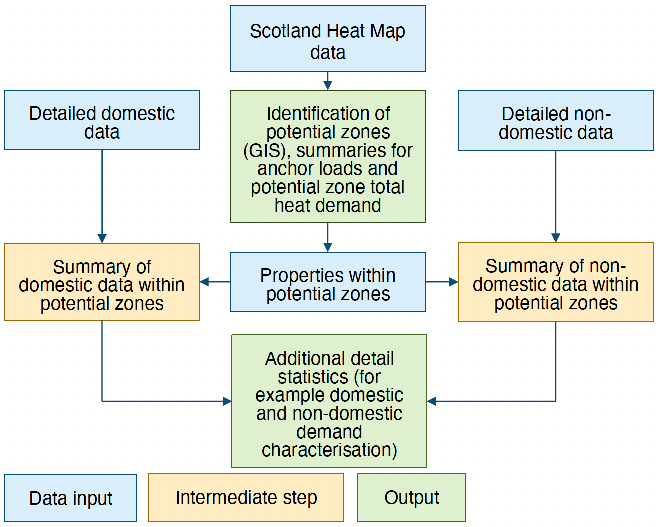
The approach taken by the FNA to address the objectives listed in Section 1.2 is summarised, in terms of data inputs, outputs and intermediate steps, in Figure 2—1. A summary of the data used within this analysis is provided in Section 2.1 and an overview of the approach in Section 2.2.
2.1 Base data
Data for initial identification of potential zones for heat networks in the FNA was drawn from three key sources, summarised in Table 2—1. Further detail is provided in Section 2.1.1 on combining the base data to support the analysis.
Table 2—1 Summary of data sources, completeness, accuracy and use.
Source: Scotland Heat Map
Use:
1. Building level heat demand and locations for domestic and non-domestic, to inform potential zone identification analysis
2. Identification of potential low carbon or waste heat sources
3. Identification of existing heat networks
Completeness:
1. Good coverage of property-level demand data by UPRN
2. Contains some data layers that could support identification of potential low carbon or waste heat sources but not comprehensive
3. Incomplete dataset that identifies point sources but not connected properties
Accuracy:
1. Generally higher confidence in local authority demands, lower confidence in other non-domestic demands which are mostly benchmarked by floor area. A note below addresses a fix to some issues with non-domestic heat demand data.
2. Mixed across data layers
3. Mixed
Source: Home Analytics
Use:
Detailed data for domestic buildings informing key characteristics
Completeness:
Good coverage of property-level demand data by UPRN
Accuracy:
Contains a mix of modelled and actual data. Accuracy suitable for strategic use across wider areas such as larger potential zones.
Source: Non-Domestic Analytics
Use:
Detailed data for non-domestic buildings informing key characteristics
Completeness:
Good coverage by UPRN – significant levels of modelled data
Accuracy:
Related to coverage, actual data limitations and specific fields in question, accuracy is variable.
Home Analytics data was provided for the whole of Scotland by the Energy Saving Trust. The Scotland Heat Map and Non-Domestic Analytics (previously Non-Domestic Buildings Energy Database) were provided by the Scottish Government. There are three key notes regarding the use of these datasets. The first is that the Non-Domestic Analytics is in early development stages and many of the fields contain significant percentages of modelled data. Work is being done to better understand these limitations, however the fields used to support the FNA analysis are areas with higher data confidence.
The second point relates primarily to non-domestic, property-level heat demand data within the Heat Map and a pre-analysis data cleaning exercise that was carried out before undertaking the FNA activity. The Heat Statistics and Energy Mapping team at Scottish Government identified approximately 30,000 heat demands which should be removed within the 2020 Scotland Heat Map dataset. Although relatively few demand points as a percentage of the national total, these are significant in terms of the analysis outputs as many of the removed heat demands were larger demand values which could be classified as anchor heat loads (definition provided in bullet point below – see section 2.2.1 for more detail):
- Anchor loads are high heat demand properties and key connections which may aid in driving the economics of a potential heat network. In this work anchor loads have a heat demand of at least 500 MWh/yr.
The removal of these demands is either due to duplication of heat demands at functional sites or due to issues with the Basic Land and Property Unit (BLPU) codes. It is anticipated that an equivalent cleaning approach will be adopted in the next version of the Scotland Heat Map, however, this should be clarified with the Heat Statistics and Energy Mapping team at Scottish Government.
The third point is that data in Home Analytics on fuel poverty is used to inform this analysis and is expected to continue to improve over the period 2021-2023, with updates to the modelling method and change to ensure fully compatible with all elements of the new fuel poverty definition.
2.1.1 Combining the base data
UPRN stands for unique property reference number and is a key piece of information for joining datasets together for analysis. UPRNs are noted in relation to each of the base datasets in Table 2—1. Each property in Scotland has a UPRN which means data can be matched from the different datasets based on this field to support the analysis.
UPRN values are used to link and then add the key characteristics from the Home Analytics and Non-Domestic Analytics to the Scotland Heat Map demand points. This information is:
- tenure type,
- 8-fold classification of settlement type (these are Large Urban Area, Other Urban Area, Accessible Small Town, Remote Small Town, Very Remote Small Town, Accessible Rural, Remote Rural, and Very Remote Rural),[10]
- non-domestic property type (these are Restaurants and Cafes, Retail and Financial Services, General Industrial, Storage or Distribution, Offices and Workshops, Residential Institutions and Spaces, General Assembly, Non-residential Institutions, and Other),
- commercial building floor area.
Some issues with duplications and missing parameters resulted from combining 3 datasets to support this analysis; these are discussed later in Section 2.2.4.
2.2 Non-technical summary of approach
This non-technical summary provides an overview of key criteria and approaches taken within the FNA analysis. For a more technical and detailed methodology, the "LHEES Stage 4: Generation of Initial Delivery Level Areas. Heat Networks – Generation of Potential Zones (V03)" document should be referred to.[11]
2.2.1 Criteria used to define potential zones
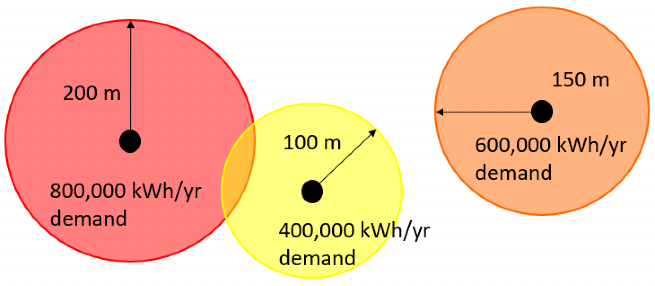
The basis of the analytical approach to potential heat network zone identification in the FNA is the buffering of heat demand properties using a metric known as linear heat density (LHD).[12] Using LHD in strategic analysis gives a proxy for the connectable distance from a building, this is undertaken by dividing the annual heat demand of the property by the LHD benchmark figure utilised. The "buffering" approach sweeps this connectable distance (radius) around a potential heat load point to create a circular buffer, and where buffers overlap, these form potential zones where other criteria are also met. It should be noted that the buffer radius is capped to 250 meters to avoid very large heat demands indicating connection viability over unrealistic distances. A visual representation of LHD 'buffering' and connection distances for three example heat loads is presented in Figure 2—2. The visualisation presents that the first two properties would be viable connections to each other due to their LHD 'buffers' overlapping, while the third property is not viable for connection.
For low carbon heat networks in the UK, there are no standard figures for LHD that provide a threshold guide to the economic viability of a heat network, with many of the established LHD benchmarks being based on networks with natural gas combined heat and power plants (CHP) – these networks present different economics to those powered by low carbon technologies such as heat pumps.[13] Given the lack of standard figures to base the analysis upon, the FNA considers a range of LHD values. Two different levels of LHD are primarily used, aligning to a Baseline (Phase 2A) and Stringent (Phase 2B) assessment of potential heat network zones, whose results are also compared against each other. A third, supplementary LHD screening level (16,000 LHD) is also included, with no comparison made between the results of this screening level and the previous two utilised.
More detailed local analysis would be required to establish tenability of heat networks, likely requiring a level of feasibility assessment to consider connection scenarios, the most suitable low carbon heat supply technology and the economics of the opportunity, including an early estimate of heat supply costs. The LHD values used within the FNA analysis build on those used in similar studies.[14]
As well as LHD, the minimum number of anchor loads is the other key consideration that makes up the Baseline and Stringent assessment criteria. LHD regions are then selected for analysis if a threshold of anchor loads within the 'buffered' region is met. Anchor loads are high heat demand properties and key connections on a heat network that usually drive project economics – a core group of anchor loads is often needed to create a heat network opportunity. For the FNA, anchor loads are classified as heat demands of over 500 MWh/yr, in line with many UK studies.[15] These criteria for each screening level are summarised in Table 2—2.
In the Baseline screening, a minimum of 2 anchor loads is used, however it should be noted that a heat network could be based around one central heat load, or may not require any anchor loads in certain circumstances, for example the supply of surplus heat to a housing estate or new development site. Networks that aren't identified as potential zones could still be viable and could be considered as project opportunities at a local level. The use of more stringent screening criteria could be one way to focus early activity on the most strategically important potential heat network zones. A local authority will have the opportunity to set different LHD and anchor load screening criteria, as appropriate to their geographies and circumstances, when developing an LHEES.
Table 2—2 Different levels of screening criteria used in the FNA.
Screening level: Baseline
Linear heat density: 4,000 kWh/m/yr – this is an industry standard figure for strategic analysis of heat network potential, reflected in other national studies;[16] however it is not based on an understanding of low carbon heat supplied networks operating in Scotland or the UK
Anchor loads: Minimum of 2 anchor loads required – this is relatively few compared to the Stringent assessment in order to capture opportunities in rural areas
Screening level: Stringent
Linear heat density: 8,000 kWh/m/yr – doubling the Baseline helps identify the more heat dense potential zones in urban areas. It also aligns to more Stringent screening measures adopted in other studies[17]
Anchor loads: Minimum of 5 anchor loads required
Screening level: 16,000 LHD
Linear heat density: 16,000 kWh/m/yr – doubling of the Stringent screening level, used to further interrogate the more heat dense potential zones within urban areas.
Anchor loads: Minimum of 5 anchor loads required
In the Stringent screening criteria, 5 anchor loads are used as a minimum. It should be noted a heat network would not necessarily require this many anchor loads to be successful. The FNA analysis identifies potential zones rather than specific networks, as such, more detailed analysis of a potential zone may highlight several small networks to be more appropriate than one large network.
The third LHD 16,000 kWh/m/yr[18] is also used in the FNA alongside the same minimum of 5 anchor loads requirement as the Stringent screening criteria. This is to provide further context and definition, particularly in high heat demand urban areas, where the larger scale heat network opportunities are located.
The greater the LHD benchmark utilised the smaller the 'buffered' connectable distance (radius) around a potential heat load point due to the heat demand of the property being divided by a greater benchmark figure.
2.2.2 Potential zone identification
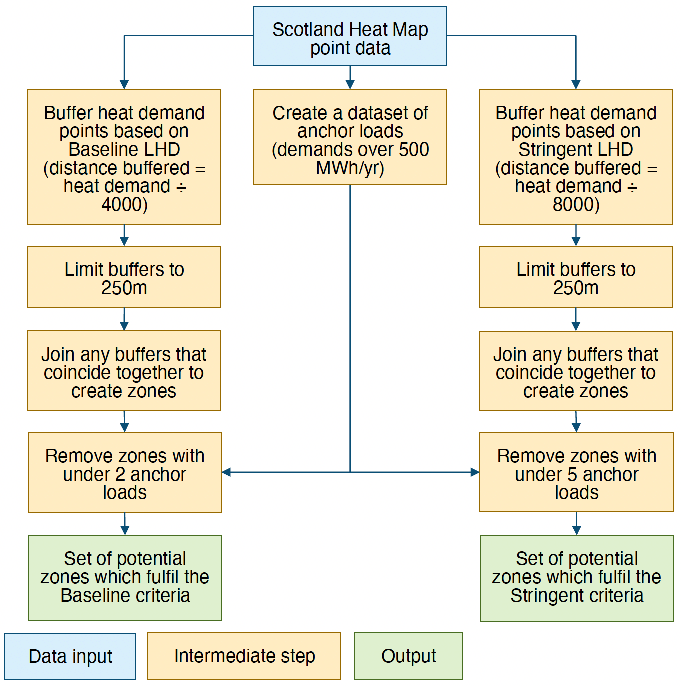
A detailed summary of the precise analysis steps (including GIS processes) required to produce the outputs generated within this assessment are provided in the "LHEES Stage 4: Generation of Initial Delivery Level Areas. Heat Networks – Generation of Potential Zones (V03)" document. This Section provides an overview of the method for potential zone identification followed in the FNA, as summarised in Figure 2—3. An equivalent approach is followed for the 16,000 kWh/m/yr assessment with a minimum of 5 anchor loads.
A 250 meter restriction is included in the buffering process to prevent large heat demands causing unworkably large buffers (suggesting connection viability across whole towns or cities). It also reduces the undue leverage that large heat demands (with a low confidence level) can have upon results. It should be noted that if analysing supply generation (for example a large waste heat resource) rather than demand, then the removal of this 250 meter buffer restriction could be appropriate.
Once the potential heat network zones are generated, they can be examined within the context of other key factors, notably:
Existing heat networks – uses the dataset within the Scotland Heat Map. This is a set of point data and is incomplete, so at a local authority level, local knowledge will be an important cross-check of these data. Existing heat networks are considered the priority additional data for display on maps.
Low carbon heat supply opportunities – there is not a single data source that can be used to understand potential low carbon heat supply opportunities at a strategic level. A low carbon heat supply opportunity is heat which may be extracted for utilisation using low carbon technology, either from waste heat recovery or from the physical geography of the area. Multiple sources can be drawn on, discussed in detail in the LHEES guidance document, these include supply points from the Scotland Heat Map (which is the main data displayed in maps in this assessment), NAEI data which could identify industry that is likely to have large process heat demands (and therefore potential waste heat that could be utilised) and substations, as well as geological information and waterbodies to highlight good heat pump potential.
A comprehensive Scotland wide dataset could assist with future national analysis as well as assisting local authorities with their individual requirements within LHEES and the 2021 Act. This would initially focus on readily available sources i.e. waste sites, waterbodies, green space, geology, large substations, existing point data within the Scotland Heat Map. Other datasets are less readily available are sewer networks and uniform waste heat information from large energy consumers (NAEI data helps identify some but is not definitive). Integration of a dataset like that outlined in Potential sources of waste heat for heat networks in Scotland[19] published by ClimateXChange in 2020 would provide a useful starting point for the latter dataset.
The LHEES guidance is being updated to provide a more definitive list of potential data sources (focusing on open source information) to consider for low carbon heat supply opportunities, which will help provide a more definitive approach to collating these data sources.
Local Development Plan (LDP) sites – it is anticipated that local authorities will use their own data to bring in LDP sites. In this instance Improvement Service is the preferred centralised source for national modelling. Displaying too much data on maps, reducing clarity, means LDP sites are not included in the map outputs of the FNA; however, consideration of this information will be important at a local level as new demands of sufficient density can present promising opportunities for the development of heat networks that are not identified as potential zones by this work. This is demonstrated, for example, by the heat network project for the new Shawfair town.[20]
Full details of how this information can be displayed and data sources is provided in Section 3.4 of the "LHEES Stage 4: Generation of Initial Delivery Level Areas. Heat Networks – Generation of Potential Zones (V03)" document.
2.2.2.1 Largest potential heat network zones
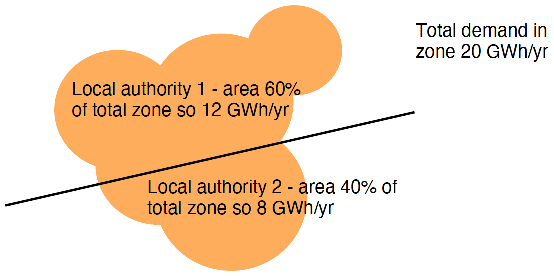
Each local authority has been provided with a map and summary information for the largest potential heat network zone in the local authority, as well as a GeoPackage ArcMap file with a layer outlining all identified potential heat network zones. The largest zone being defined as that with the greatest heat demand identified within it. These zones are clipped to local authority boundaries, which means the boundary line between local authorities will form the new potential zone boundary for local authority outputs, where there had previously been overlap of potential zones from one local authority to another in results presented at a national level. If a potential zone crosses a local authority boundary, the heat demand for the zone is proportioned by the zone area (m2) within each of the local authorities, this process is illustrated in Figure 2—4.
2.2.3 Generation of summary statistics
Note that the process to generate the majority of the summary statistics provided as part of the FNA is not part of the LHEES Methodology documented in "LHEES Stage 4: Generation of Initial Delivery Level Areas. Heat Networks – Generation of Potential Zones (V03)".
A key set of statistics are generated in the FNA based on all demands which fall within potential heat network zones – the reporting parameters were established through engagement with the Steering Group. A full list of parameters is included in the Potential Heat Network Zones First National Assessment, Summary Tables Excel file appended to this report (FNA Summary Tables). The Scotland Heat Map data is used to provide heat demands whilst the Home Analytics provides other details for domestic properties and the Non-Domestic Analytics provides other information for non-domestic buildings.
Factors examined include total heat demand, number of properties, building tenure, scale of domestic buildings and urban or rural classifications. Most factors are self-explanatory, with key characteristics drawn out in captions for maps produced alongside this report and in Sections 4 and 5.
One factor which requires detail of how it is represented is fuel poverty. Within Home Analytics, a field reports the percentage likelihood of fuel poverty and a separate field reports percentage likelihood of extreme fuel poverty. Two key parameters are examined in the FNA in the context of both fuel poverty and extreme fuel poverty, with the approach taken as outlined below.
- Number of households – this is assessed by multiplying each domestic property by the fuel poverty % likelihood figure and then aggregating the count to the desired spatial level. For example, a 60% likelihood for one household and another with a 90% likelihood would combine for a total count of 1.5 households, that is (1 household x 0.6) plus + (1 household x 0.9), making a total of 1.5 households.
- Heat demand from these households – this calculation focuses on apportioning the heat demand in a manner that aligns with the household count. This is assessed by multiplying the heat demand for a property by the percentage likelihood of fuel poverty and aggregating the totals. So, in the example above, if the household with 60% likelihood had an annual demand of 8,000 kWh and the 90% likelihood household 12,000 kWh, the heat demand associated with the household count above is calculated as 4,800 kWh (8000 x 0.6) plus 10,800 kWh (12000 x 0.9), making a total of 15,600 kWh.
Selected summary statistics for each potential heat network zone identified are provided in a GIS file, using both the Baseline and Stringent criteria (an additional set of data generated using a 16,000 kWh/m/yr LHD are also provided). In the 'Potential Heat Network Zones First National Assessment, Summary Tables' Excel file, the full set of summary statistic information is provided at the following resolutions:
- National level
- For each city area (Glasgow, Edinburgh, Aberdeen, Dundee, Perth, Inverness and Stirling)[21]
- For five different additional areas (the Mission Clyde area, the Central Belt, the Eastern Central Belt, the Western Central Belt, and the Lanarkshire towns)
- For each local authority
- For the largest potential zone within each local authority (determined by total heat demand)
2.2.4 Analysis limitations
The limitations of the analysis tend to stem from data quality, most notably for non-domestic demands which have direct influence on the generation of potential zones, but also for existing heat networks, which could inform how potential zones relate to operational networks. The building assessment reports, as envisaged by the 2021 Act, may provide a route to better understanding of non-domestic demands and their potential to connect to heat networks in future. The existing heat networks data used is incomplete and is in point format rather than detailing network layouts, which creates challenges in understanding the extent of existing networks and how these relate to potential zones. A key consideration for further analysis here is to identify those properties within potential zones that are already connected to a heat network.
It should also be noted that a national level assessment run solely using national datasets is not able to take advantage of local knowledge and information that could influence the identification of potential zones. Local input is recognised as something which needs to be addressed within LHEES, and there are steps within the "LHEES Stage 4: Generation of Initial Delivery Level Areas. Heat Networks – Generation of Potential Zones (V03)" guidance to incorporate local knowledge and sense-checks in the identification of potential zones. This local engagement with the outputs is vital to realise the maximum value of the First National Assessment of Potential Heat Network Zones.
The analysis considers all demands within an identified zone as a potential connection for a heat network. Within the BEIS second National Comprehensive Assessment (NCA) for heat network opportunities[22] a threshold value of 73 MWh/yr is considered the minimum for heat network connection provided within the NCA report. This has meant that a very high percentage of domestic properties will be screened out. This report assumes the inclusion of all demands within a zone to connect to a heat network. This is likely to be an overestimate, as in practice not all buildings are likely to connect.
2.2.4.1 Data mixing
The analysis uses data from the Scotland Heat Map as a basis but cleans and adds data using both Home Analytics and the Non-Domestic Analytics. Particularly in the case of the latter, some data appears in the Scotland Heat Map but not in the Non-Domestic Analytics data. Data from both sources is required to complete the analysis which means some data may not be captured. To minimise this issue potential zones are identified using the Scotland Heat Map data, avoiding missing out potential properties. Potential zone overall demands and anchor loads are analysed using the Scotland Heat Map data. However, statistics for precise domestic and non-domestic or mixed tenure/mixed use information require a demand to appear in either Home Analytics or the Non-Domestic Analytics as well as the Scotland Heat Map dataset. This means demands statistics may not always precisely align to the total for potential zones.
This approach was taken in part due to another issue when using the Home Analytics and Non-Domestic Analytics - some properties are duplicated, for example, they appear as both a domestic property and a non-domestic property at UPRN level. To reduce the impact of this issue, domestic heat demands are reported for these points using the Home Analytics data,[23] whilst for non-domestic demands the value taken is the Scotland Heat Map demand for that UPRN minus the domestic heat demand. In instances when this would result in a negative heat demand, the non-domestic demand is assumed to equal zero.
Any demands in the Scotland Heat Map which do not have a UPRN in the Home Analytics or Non-Domestic Analytics are still included but not attributed as either domestic or non-domestic demands. This means in summary tables domestic and non-domestic demands will not always add up to the total demand identified. These demands without a non-domestic or domestic label are included in the summary statistics as unattributed heat demand and a number of unattributed properties.
Local authorities carrying out the analysis required for heat networks in the LHEES guidance will not be impacted to such an extent by these issues. The LHEES guidance relies almost entirely on the Scotland Heat Map data, the only exception is any quantification of fuel poverty. This will require the use of Home Analytics data but as it is not trying to capture all demands there will not be the same issues as in this national assessment, which includes greater depth of non-domestic analysis.
2.2.4.2 Potential zones that cross local authority boundaries
In this work multiple potential zones are identified that cross local authority boundary lines. In these instances, potential zones are split and are reported separately for each local authority. The number of anchor loads and demand which falls within a specific local authority is then reported in the local authority level data. This can lead to potential zones being reported that do not fulfil criteria at a local authority level. For example, using the Stringent criteria, one potential zone may have four anchor loads in one local authority and three in another. This means the numbers reported at a local authority level may not meet the requirements but the potential zone itself does. This is more a factor to be aware of at different reporting levels, than a shortcoming of the analysis.
For local identification and consideration of collaboration opportunities, border zone references are highlighted within the summary tables at a local authority level, can be seen visually as clipped areas within the static output maps provided and can be more closely interrogated using the GIS outputs from the work. Such potential zones present opportunities for collaborative working should any actions be taken forward to progress these.
2.2.5 Comparison to the Opportunity areas for district heating networks (NCA) report.
Alongside this analysis, a UK-wide assessment of heat network potential has been published.[24] The NCA ran multiple LHD scenarios. The LHD values were arrived at based on the economic viability of different heat sources.[25] This source-specific approach varies from the approach taken by the FNA, which focuses on demand to define potential heat network zones. Once the demand-based analysis is carried out in the FNA, potential heat sources are examined in the context of potential heat network zones.
Added to the NCA model is another set of variables which focus on network costs and the heat margin.[26] The LHD values used in the NCA analysis were provided by Arup who carried out the NCA analysis for BEIS. The three core LHD values in the NCA are:
- Low – 2,919 kWh/m/yr
- Medium – 6,607 kWh/m/yr
- High – 18,684 kWh/m/yr
These values integrate consideration of factors including heat purchase price/heat supply and pipe costs for the network.
The low and medium levels used in the NCA are similar but lower than the Baseline and Stringent LHD values used within the FNA, however, they are broadly analogous. Another difference in the respective approaches is the lack of minimum anchor load requirements or a limit on LHD buffer size in the NCA in the identification of opportunities or potential zones. It should also be noted that the NCA analysis excludes any buildings with a heat demand of less than 73 MWh/yr due to economic viability of connection. Whilst such screening is not unusual for heat network feasibility studies, small loads are not excluded in the FNA. A summary of some of the key characteristics of the two approaches is provided in Figure 2—3.
Table 2—3 Summary of the differences between FNA and NCA (in the central scenario) parameters
Analysis: FNA
LHD settings: 4,000, 8,000 and 16,000 kWh/m/yr used. Adds a 250 m limit to LHD buffer
Anchor loads: Defined as a minimum of 500 MWh/y building demand, with a minimum of two for Baseline and three for Stringent and 16,000
Demand filter: No demand filter at a building level
Analysis: NCA
LHD settings: 2,919, 6,607 and 18,684 kWh/m/yr used (in central scenario)
Anchor loads: Equivalent value is 73 MWh/yr for a building, requires at least three such loads
Demand filter: Minimum building demand filter of 73 MWh/yr
In general, the two approaches are broadly similar but there are differences in approach that will result in a different set of outputs. The resolution of the NCA outputs which were available and different threshold criteria mean comparisons within this report have a national focus. Factors which are compared in this report are demand, distribution of potential heat network zones across Scotland, and total coverage of potential heat network zones in Scotland.
Contact
Email: heatnetworks@gov.scot