Potential heat network zones: first national assessment
Analysis to identify and characterise potential zones for heat networks in Scotland. It provides further detail on the analysis criteria, assessment methodology, limitations, definitions and the interpretation of the outputs.
Executive summary
The First National Assessment of Potential Heat Network Zones (FNA) carries out an analysis to identify and characterise potential zones for heat networks in Scotland. The focus of the work is on potential zone identification through assessment of heat demand density, providing an initial, automated assessment using national datasets of the areas that are most suited to heat networks from a demand density perspective.[1] In identifying potential zones, the analysis does not take into account local development plan sites, existing heat networks and sources of waste or surplus or low carbon heat. This information will require local information that is not available in a uniform manner nationally. Additionally, the analysis does not consider the economic viability or the detailed technical or stakeholder related aspects of project opportunities within potential zones. Further detailed assessment would be required to understand if heat network projects within potential zones could offer heat to properties at a cost that is competitive against alternative options. It is emphasised that the potential zones identified, and the summaries of key characteristics reported within potential zones, should be considered in this context.
The Heat Networks (Scotland) Act[2] (known as "the Act" from this point on) defines a heat network as:
a) a district heat network, or
b) a communal heating system.
The focus of this assessment is on the district heat network scale, defined in the Act as "a network by which thermal energy is distributed from one or more sources of production to more than one building." The analysis used focuses on potential for fourth generation heat networks. It may be possible that some of the potential zones identified are also suitable for fifth generation heat networks. The analysis does not identify potential for fifth generation heat networks outside the potential zones identified.
Potential heat network zones are identified using two levels of analysis providing more potential zones (Baseline Criteria) and fewer potential zones (Stringent Criteria). The former sets a lower threshold in terms of the distance between buildings with a large heat demand (called anchor loads) and numbers of these anchor loads, whilst the latter sets higher threshold resulting in fewer and smaller potential zones being identified.
Potential heat network zones are identified through a linear heat density (LHD) approach, drawing on the demand data from within the Scotland Heat Map. The approach calculates a connection distance for each building's heat demand, based on different LHD criteria. The two main LHD values used are 4,000 kWh/m/yr, known as the Baseline screening, and 8,000 kWh/m/yr, known as the Stringent screening (higher LHD values result in shorter connection distances and therefore provide a more stringent screening of potential). An additional 16,000 kWh/m/yr analysis is also carried out to give greater context to dense urban areas, but this not a primary focus of the assessment.
The analysis involves spatial consideration of heat demands in Scotland and the connection distances that result from the various LHD settings considered. Where the calculated connection distances from two heat demand points are sufficient to link these together, they form a potential heat network zone. Consideration is also given to the number of buildings with high heat demands, known as anchor loads (defined in this work as buildings with at least 500 MWh/yr heat demand in this analysis), which fall into potential zones identified by the LHD analysis. In identifying potential zones, a minimum of two anchor loads are required for Baseline screening and five for Stringent. It should be noted that a heat network could be based around one central heat load, or may not require any anchor loads in certain circumstances. Local authorities will have the opportunity to set different screening criteria, as appropriate to their geographies and circumstances, when developing LHEES.
The analysis identifies 647 potential zones (this is increased to 712 when potential zones are split by local authority boundaries) using the Baseline screening criteria, which contain a total heat demand of 25.7 TWh/yr. It is important to note this demand total is for every property within the potential zones identified and not all buildings will be suitable for connection to heat networks; 14.1 TWh/yr of the total comes from anchor loads. The Stringent screening identifies 196 potential heat network zones (207 when potential zones are split by local authority boundaries), with a total demand from all buildings within the zones of 13.7 TWh/yr. Of this demand 9.3 TWh/yr comes from anchor loads. This represents 68% of the total demand within potential zones, whilst only 55% of demand comes from anchor loads in the Baseline screening.
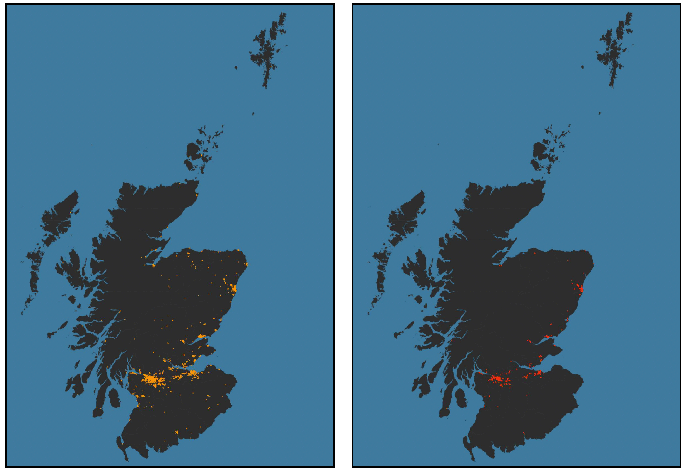
Traditionally, district heat networks have focused on large anchor loads and the Stringent screening criteria identifies potential zones that are better aligned to this model (generally in denser urban areas). However, being a national analysis, it is also important to identify potential zones in more rural areas without the same concentrations of anchor loads. The geographic distribution of potential zones identified by the analysis is provided in Figure 0—1, where the differences in settings used to identify potential zones are evident in the outputs for rural areas.
Potential heat network zones are focused in the central belt for both the Baseline and Stringent screening of potential zones; having 68% and 76% of the national total heat demand identified in potential heat network zones, respectively.
Although some potential zones are very small, and easier to view on the local authority maps provided alongside this document, the Baseline screening identifies at least one potential heat network zone in every local authority. Six local authorities have no potential zones identified with the Stringent screening criteria.[3]
The defined potential zones have various characteristics reported and examined, some key domestic characteristics are summarised in Table 0—1.
Table 0—1 Summary of key domestic characteristics for properties in potential heat network zones.
Number of domestic properties
- 340,000 Baseline screening
- 78,000 Stringent screening
Domestic demand
- 7.1 TWh/yr Baseline screening
- 2.2 TWh/yr Stringent screening
Domestic properties by tenure - Baseline screening
- 44,553 Local Authority
- 34,728 Housing Association
- 206,215 Owner Occupied
- 53,932 Private Rented
Domestic properties by tenure - Stringent screening
- 8,065 Local Authority
- 8,265 Housing Association
- 43,961 Owner Occupied
- 17,369 Private Rented
Households in fuel poverty
- 91,000 (approximately 26% of domestic properties) with 1.4 TWh/yr heat demand – Baseline screening
- 18,000 (approximately 22% of domestic properties) with 0.4 TWh/yr heat demand – Stringent screening
Households in extreme fuel poverty
- 44,000 (approximately 13% of domestic properties) with 0.8 TWh/yr heat demand – Baseline screening
- 8,000 (approximately 10% of domestic properties) with 0.2 TWh/yr heat demand - Stringent screening
The domestic characteristics highlight the greater significance of domestic demand when Baseline screening is used. This extends to potential zones identified with Baseline screening also having a greater prevalence of fuel poverty within households.
A similar summary for non-domestic properties is provided in Table 0—2.
Table 0—2 Summary of key non-domestic characteristics for properties in potential heat network zones.
Number of non-domestic properties
- 74,000 Baseline screening
- 34,000 Stringent screening
Non-domestic demand
- 17.6 TWh/yr Baseline screening
- 11.1 TWh/yr Stringent screening
Non-domestic properties by floor area - Baseline screening
- 28,520 less than 100m2
- 29,545 between 100 and 500m2
- 6,445 between 500 and 1000m2
- 9,471 more than 1000m2
Non-domestic properties by floor area - Stringent screening
- 11,372 less than 100m2
- 14,228 between 100 and 500m2
- 3,182 between 500 and 1000m2
- 5,003 more than 1000m2
Non-domestic demand totals by floor area - Baseline screening
- 2.0 TWh/yr - less than 100m2
- 2.6 TWh/yr - between 100 and 500m2
- 1.5 TWh/yr - between 500 and 1000m2
- 11.6 TWh/yr - more than 1000m2
Non-domestic demand totals by floor area – Stringent screening
- 1.1 TWh/yr - less than 100m2
- 1.5 TWh/yr - between 100 and 500m2
- 0.7 TWh/yr - between 500 and 1000m2
- 7.7 TWh/yr - more than 1000m2
Non-domestic total heat demand is dominated by the largest property group (those with floor areas greater than 1000 m2). This is the same for both Baseline and Stringent screening.
This report also compares the outputs of the FNA to the Opportunity areas for district heating networks in the UK: second National Comprehensive Assessment (NCA), undertaken for the whole of the UK by BEIS. The analytical approach to both assessments is similar, with the use of different levels of LHD to determine different levels of screening. The LHD values used in the NCA are similar, but not exact matches, to those used in the FNA. The main difference in the LHD approach taken between the two studies is the FNA puts a cap (250 m) on the maximum connection distance in the LHD model, whilst the NCA model has no cap, meaning extremely large heat demand sites in the NCA can have connection distances of several kilometres. Other differences in approach include a minimum heat demand of 73 MWh/yr for connection to heat networks in the NCA, which although generally aligning to current practices screens out most domestic properties. Additionally, no minimum anchor load criteria are applied in the NCA.
The NCA analysis identified 17.3 TWh/yr in potential heat network zones using the screening criteria which most closely matches the Baseline screening in this study. This is a substantially lower value (8 TWh/yr lower) than the potential zones identified in the Baseline screening, with the difference mostly due to the minimum threshold demand for connection applied in the NCA. The values are more closely aligned for the equivalent of Stringent screening, 15.0 TWh/yr in the NCA compared to 13.7 TWh/yr in the FNA. This is despite only 9% of equivalent land area being covered in the FNA analysis – showing the value of limiting the LHD to help geographically focus potential heat network zones.
Alongside this report, a detailed set of summary data is provided in Excel files. These provide a detailed breakdown of property characteristics within potential zones for the following geographies:
- National – summaries for all of Scotland
- Cities – for each of Scotland seven cities
- Additional regions – for five additional regions: the central belt, central belt west, central belt east, the Clyde Mission area and the Lanarkshire towns
- Local authority – for each local authority and the largest potential heat network zone (determined by demand) in each local authority
A set of maps presenting the location and extent of potential heat network zones for these geographies is provided alongside the Excel files. There are approximately 150 maps provided in A3 high resolution PDFs. A full description of these outputs is provided in Section 3. The final output supplied is a set of Geographical Information System (GIS) files, showing the extent of the potential zones identified in this analysis.
Additionally, local authority specific outputs from this work have been packaged and shared with respective local authorities as part of the LHEES (Local Heat and Energy Efficiency Strategies) National Assessment activity. These outputs provide a high-level and initial assessment at a national level – the LHEES process includes sense-checks that draw on the knowledge base of local authorities and will further consider how local factors could impact on potential zones identified by the FNA.
Contact
Email: heatnetworks@gov.scot