Potential heat network zones: first national assessment
Analysis to identify and characterise potential zones for heat networks in Scotland. It provides further detail on the analysis criteria, assessment methodology, limitations, definitions and the interpretation of the outputs.
3 Summary of outputs by geography
This section details the FNA outputs which accompany this report. These are broken down by the two output types:
1) maps with accompanying summary information and;
2) data held in Excel tables.
These outputs are summarised for the four main geographies considered in the FNA: national, additional regions, Scottish cities and local authority.
3.1 Map outputs
The map packs contain high resolution A3 maps in PDF format – suitable for printing for use at workshops. The high resolution of these maps means files are large, approximately 50 MB each, thus it is suggested that only required maps are downloaded rather than the entire map pack.
The three main types of map are:
- Point based – these summarise potential heat network zones as points. Points are shown at the centre of each potential zone, with points having different colours to represent the total heat demand within the potential heat network zone.
- Area based – these show the outline of the potential heat network zones identified. They often group Baseline and Stringent criteria on the same map and in some instances also show potential zones generated using a 16,000 kWh/m/yr LHD radius and a minimum of five anchor loads, to add further context to the most demand dense potential zones.
- Detailed maps – these include similar outputs to the area-based maps but are overlaid with other key additional information. This can include anchor loads (heat demands greater than 500 MWh/yr), existing heat networks, and potential heat sources.
Alongside these maps, a summary of the potential heat network zones covered by the map is provided, this draws out key information from the summary Excel tables.
The majority of maps are for local authority areas so the above three key types of map are illustrated using examples for local authority outputs, with the first example being the point map type in Figure 3—1.
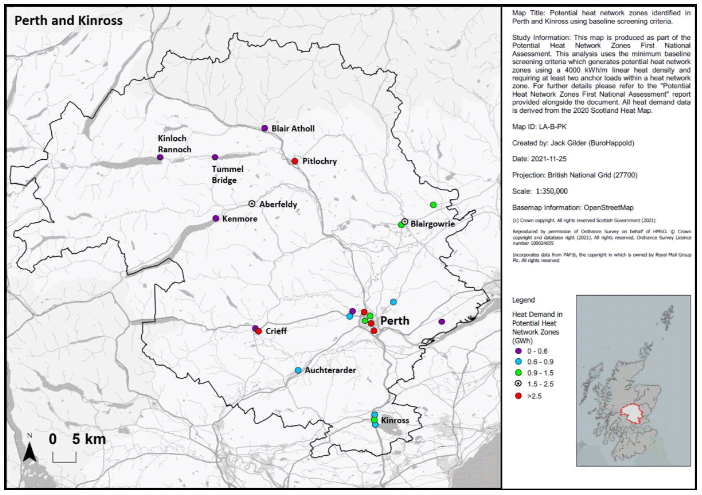
Figure 3—1 shows the central point of heat demands or potential heat network zones but does not define the spatial extent of them. For larger geographic areas this is useful as precise locations of potential zones may be hard to see, as they will be very small compared to the relative geographic area.
At smaller spatial scales, such as more urban local authorities, potential zones can be better represented as precise areas on maps rather than points. An example of an area map is provided in Figure 3—2.
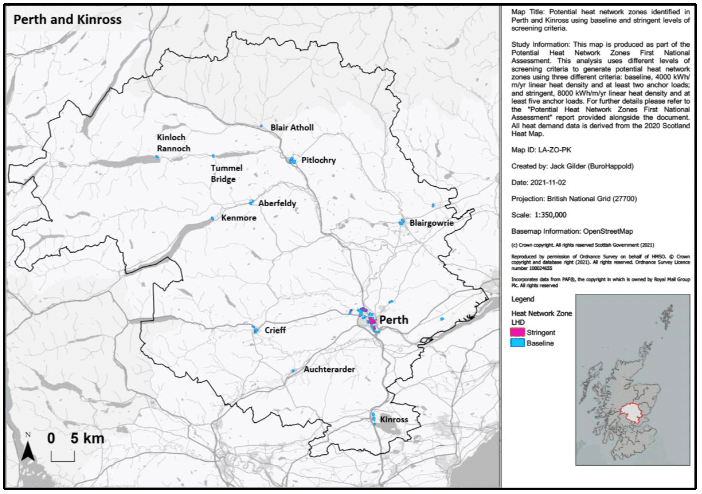
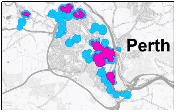
This style of map is more suited to smaller, more urban, local authorities than rural ones like the example in Figure 3—2 for Perth and Kinross. However, they are produced in high resolution so it is possible to zoom into specific areas to give an indication of zone extent, see Figure 3—3 for an example.
In some instances, the map outputs focus on more granular areas than a local authority. These maps typically show a specific potential zone, where it is also useful to bring in additional detail, for example on anchor loads, nearby existing heat networks or potential heat sources. An example of this detailed map type is provided in Figure 3—4.
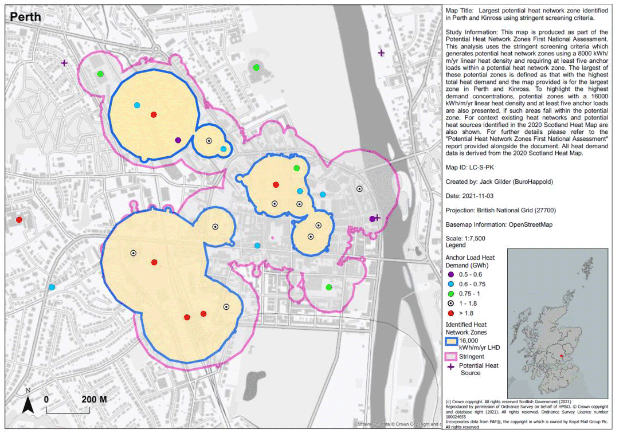
Showing information like anchor loads on these detailed maps can help inform strategy. Anchor loads provide a backbone of key connection points for a potential network, which will often drive a network's economics. The existing heat networks and potential heat sources are some of the other key considerations in any opportunity identification or zoning process. The base GIS data is not provided with this report but is available on request. It is suggested that a local authority, after review and local sense-check of the outputs, could incorporate further information, such as local development plan outlines and potential low carbon heat sources. This information is not included in these map packs as presenting too much information on a printed map can result in them being overly complicated to interpret, instead it is suggested such information would be better viewed dynamically within GIS software.
3.1.1 Map codes
The FNA analysis has nearly 200 associated map outputs. A set of codes have been generated for ease of identification and comparison. These are tabulated in Table 3—3, and follow a few simple rules, provided in Table 3—1.
Table 3—1 FNA analysis map code identification
Code: Identification
B: Baseline screening criteria.
S: Stringent screening criteria.
LA: Local authority geographic scale.
Nat: National geographic scale.
SC: Scottish city geographic scale.
AA: Additional area / region of interest geographic area.
ZO: Zone outlines. These maps show the potential heat network zone areas precisely.
LC: Largest cluster. This equates to the largest potential heat network zone by total heat demand identified in a local authority.
The IDs and description of national level maps are provided in Table 3—2.
Table 3—2 Summary of map ID codes and content at a national level.
Map ID: Map content
Nat-1B: The centroid of each potential heat network zone identified in Scotland using the Baseline screening criteria. Points are graduated by colour to indicate demand.
Nat-1S: The centroid of each potential heat network zone identified in Scotland using the Stringent screening criteria. Points are graduated by colour to indicate demand.
Nat-2B: The total heat demand in potential heat network zones identified using the Baseline screening criteria summed to local authority level.
Nat-2S: The total heat demand in potential heat network zones identified using the Stringent screening criteria summed to local authority level.
The additional regions of Scotland only have one map produced per region and the five codes used are:
- AA-CB (for the whole central belt region),
- AA-CBE (for the eastern area of the central belt),
- AA-CBW (for the western area of the central belt),
- AA-CM (for the Clyde Mission area),[30]
- AA-LT (for the Lanarkshire towns).
These maps show the areas covered by the potential heat network zones identified using the Baseline and Stringent screening criteria.
The Scottish cities also only have one map generated, these seven maps have the following codes:
- SC-AB (for Aberdeen),
- SC-DU (for Dundee),
- SC-ED (for Edinburgh),
- SC-GL (for Glasgow),
- SC-IN (for Inverness),
- SC-PE (for Perth),
- SC-ST (for Stirling).
These maps contain a high level of information, showing the area of potential heat network zones using the Baseline, Stringent and 16,000 LHD screening criteria. Additionally, point level information is also provided for potential heat sources, existing heat networks and anchor loads (these are colour coded to indicate scale of heat demand).
For each local authority (LA) area there are 4 maps provided. With 32 local authorities this provides a total of 128 LA maps. The four different map outputs comprise three covering the whole local authority and one the largest (by heat demand) potential heat network zone in the local authority. These are detailed in Table 3—3, map codes in the table use XX to represent the unique two letter local authority code – these two letter codes are detailed in Table 3—4.
Table 3—3 ID and content of the 4 maps generated for each local authority.
Map ID: Map content
LA-B-XX: The centroid of each potential heat network zone identified in the LA using the Baseline screening criteria. Points are graduated by colour and size to indicate demand.
LA-S-XX: The centroid of each potential heat network zone identified in the LA using the Stringent screening criteria. Points are graduated by colour and size to indicate demand.
LA-ZO-XX: The area covered by potential heat network zones identified using both the Baseline and Stringent screening criteria. For some more rural LAs this map will be of limited use given the relative size of potential heat network zones compare to the LA as a whole.
LC-S-XX or LC-B-XX: The LC-S-XX map shows the largest (by demand) potential heat network zone identified in the LA using the Stringent screening criteria. For context, potential zones identified using the 16,000 LHD screening criteria (to identify the highest demand density areas) are also displayed, as are three sets of point data: potential heat sources, existing heat networks and anchor loads (graduated by colour). In some LAs there are no potential heat network zones identified using the Stringent screening criteria, in these instances the largest potential heat network zone (by demand) identified using the Baseline screening criteria is shown along with the point data.
Table 3—4 Two letter codes used for each local authority (LA) in map IDs.
LA code: LA name
AC: Aberdeen City
Ab: Aberdeenshire
An: Angus
Ar: Argyll and Bute
CE: City of Edinburgh
Cl: Clackmannanshire
DG: Dumfries and Galloway
DC: Dundee City
EA: East Ayrshire
ED: East Dunbartonshire
EL: East Lothian
ER: East Renfrewshire
Fl: Falkirk
Fi: Fife
GC: Glasgow City
Hi: Highland
In: Inverclyde
Mi: Midlothian
Mo: Moray
NS: Na h-Eileanan Siar
NA: North Ayrshire
NL: North Lanarkshire
Or: Orkney Islands
PK: Perth and Kinross
Re: Renfrewshire
SB: Scottish Borders
SI: Shetland Islands
SA: South Ayrshire
SL: South Lanarkshire
St: Stirling
WD: West Dunbartonshire
WL: West Lothian
3.2 Summary Excel tables
The Excel summary information allows key details for potential heat network zone characterisation to be extracted at different geographic scales. Four different Excel workbooks are appended to this report, representing the four main geographic scales:
1. FNA Summary Table – National
2. FNA Summary Table – Additional Areas
3. FNA Summary Table – Cities
4. FNA Summary Table – Local Authorities
The Scottish Government has access to all spatial scales. Each local authority has been given the table containing information for their area.
The first three workbooks all contain a cover sheet and four data tabs:
- Combined – this contains a copy of statistics for potential heat network zones identified using the Baseline and Stringent screening criteria for each geographic area and compares the two (Stringent - Baseline), to allow any differences to be highlighted.
- Baseline – contains statistics for potential heat network zones identified using the Baseline screening criteria.
- Stringent - contains statistics for potential heat network zones identified using the Stringent screening criteria.
- 16,000 LHD - contains statistics for potential heat network zones identified using a 16,000 kWh/m/yr LHD and a minimum of five anchor loads screening criteria.
In front of each tab name is also a description of the geographic scale (for example National, Additional Area and City).
In the local authority Excel workbook, the cover sheet and the standard four tabs are included as is an additional tab labelled Highest Heat Demand Zone. This provides the statistics for the largest (by heat demand) potential heat network zone identified in each local authority. As standard these statistics are derived using a potential heat network zone identified using the Stringent screening criteria. However, in some local authorities there are no potential zones identified using the Stringent criteria, in these cases the Baseline criteria is used instead (a note of this is provided in the Excel workbook).
Sections 3.2.1 to 3.2.10 provide a copy of the Excel table format. These tables are populated with numbers for the whole of Scotland, whilst the information will change, the layout will remain the same for each different geography. Where appropriate, information is provided in the underlying source data that informs the data reported, these are:
- The Scotland Heat Map for the majority of information (heat demand figures, additional information such as waste heat sources, number of properties and buildings, anchor load information)
- Home Analytics version 3.7 for domestic information (fuel poverty information, heritage property indicators – including pre 1919 construction, tenure, rural/urban classification). The fields used are listed in Table 3-5.
- Non-Domestic Analytics (previously Non-Domestic Buildings Energy Database) for non-domestic information (floor area information, use type/class, pre 1919 construction, rural/urban classification). The fields used are listed in Table 3-5.
Table 3—5 Dataset variables referenced in Home Analytics and the Non-Domestic Analytics (previously Non-Domestic Buildings Energy Database).
Home Analytics: Non-Domestic Analytics (previously Non-Domestic Buildings Energy Database)
8-fold urban/rural classification: 8-fold urban/rural classification
Extreme Fuel Poverty Probability: Floor Area
Fuel Poverty Probability: Heat Demand
Heat Demand: Property Age
Listed Building Grade: Property Class
Mixed Tenure: Property Type
Property Age
Property Tenure
3.2.1 Summary sections
The summary sections refer to four different main sets of data, these are displayed in the bold text in Figure 3-5).
The "Phase" refers to the analysis criteria used to identify potential zones, this is either:
- Baseline screening (Phase 2A) which is for potential heat network zones identified using the Baseline screening criteria.
- Stringent screening (Phase 2B) which is for potential heat network zones identified using the Stringent screening criteria.
- Screening comparison (Phase 2B vs 2A) this subtracts the values from the potential zones identified using the Baseline screening from the zones identified using the Stringent screening approach, presenting the difference in results between the two screening criteria. This therefore presents results in negative values within the summary tables due to fewer zones and number of properties identified using the Stringent screening criteria.
Figure 3—5 Copy of summary sections from FNA Summary Table – National Excel document.
Phase: Baseline screening (Phase 2A)
Geographical Area: Scotland
Map Reference Code: Nat-1B
| Zone Summary | Characteristic Summary | ||
|---|---|---|---|
| No. zones identified | 712 | No. domestic properties (within heat network zones) | 339,428 |
| Zone area (Ha) | 44,426 | No. non-domestic properties (within heat network zones) | 73,981 |
| Total heat demand (GWh) | 25,673 | No. mixed tenure properties | 101,318 |
| No. properties | 421,115 | No. mixed use properties | 4,359 |
| No. anchor loads | 5,486 | No. heritage properties | 95,204 |
| % of heat from anchor loads | 55% | No. fuel poverty households | 90,662 |
| No. pre-1919 properties | 126,576 | ||
| Unattributed heat demand (GWh) | 920 | ||
| No. unattributed properties | 7,706 | ||
The "Geographical Area" refers to the location for which potential heat network zones are summarised in the table. For "FNA Summary Table – National" this will be Scotland; "FNA Summary Table – Additional Areas" will be one of the additional areas or regions examined (for example Lanarkshire towns); "FNA Summary Table – Cities" will be one of Scotland's seven cities (for example Inverness); and "FNA Summary Table – Local Authorities" will be one of the local authority areas in Scotland (for example Argyll and Bute).
For the summary of the largest potential zone by heat demand provided for each local authority, "Zone ID" replaces "Geographical Area" and details a unique zone ID that aligns to the naming used in the GIS outputs. The convention being two letters to signify the local authority, a unique number for the potential zone (this does not differentiate between local authority so all are unique) and a code to signify if it is Baseline (B) or Stringent (St1). For example, a cluster code for Angus could be An-529-B and for the City of Edinburgh CE-168-St1.
The "Map Reference Code" refers to the map within the accompanying map pack which is most suited to examine alongside the data contained in the table.
The final "Summary Statistics" contains information which was determined by the Steering Group to best summarise the potential heat network zones in each geography. These are split into two main groups:
- Zone Summary – examines the headline figures, such as the number of potential zones identified and the total heat demand.
- Characteristic Summary – presents an overview of the demand within potential heat network zones, such as the number of households in fuel poverty.
3.2.2 Zones across LAs
Some potential zones cross multiple authority areas, which means demand will not be entirely attributed to one local authority. The summary table provides a count of these and the percentage contribution (in terms of count) such potential zones make to the total for the geographic area. A copy of this section of the table is provided in Figure 3—6.
Figure 3—6 Copy of part of the table showing potential heat network zones in the summary table which cross multiple local authorities, taken from FNA Summary Table – National Excel document.
| No. zones crossing LA boundaries | % of total zones |
|---|---|
| 30 | 4% |
With the local authority level information an additional column is added to the table, which provides an ID code for the potential heat network zone which falls across a local authority boundary. These potential zones can be examined using this reference through the GIS data which will accompany this report.
3.2.3 Domestic properties
Many different characteristics are examined for domestic properties, for all of these both a precise count and an equivalent percentage is provided. This examines the number of domestic properties, the heat demand for these properties, the number of properties which fit into different settlement classifications (using the Scottish Government 8-fold urban rural classification) with count and heat demand values, and tenure classifications both with count and heat demand. A copy of the relevant section of the summary table is provided in Figure 3—7.
Figure 3—7 Copy of the part of the table of the domestic properties which fall within potential heat network zones, taken from FNA Summary Table – National Excel document.
| Number of properties | % of total properties* | Heat load (GWh) | % of heat demand* |
|---|---|---|---|
| 339,428 | 81% | 7,118 | 28% |
| Domestic Classification | Domestic urban/rural count | % of domestic properties* | Domestic urban/rural heat demand (GWh) | % of domestic heat demand* |
|---|---|---|---|---|
| Large Urban Area | 176,333 | 52.0% | 4,545.0 | 63.9% |
| Other Urban Area | 116,197 | 34.2% | 1,763.4 | 24.8% |
| Accessible Small Town | 19,941 | 5.9% | 320.8 | 4.5% |
| Remote Small Town | 10,089 | 3.0% | 179.6 | 2.5% |
| Very Remote Small Town | 5,400 | 1.6% | 104.7 | 1.5% |
| Accessible Rural | 6,577 | 1.9% | 112.2 | 1.6% |
| Remote Rural | 3,273 | 1.0% | 63.2 | 0.9% |
| Very Remote Rural | 1,618 | 0.5% | 28.9 | 0.4% |
| Total | 339,428 | 100.0% | 7,117.8 | 100.0% |
| Domestic Tenure | Domestic tenures property count | % of domestic properties* | Domestic tenures heat demand (GWh) | % of domestic heat demand* |
|---|---|---|---|---|
| Local Authority | 44,553 | 13.1% | 667.0 | 9.4% |
| Housing Association | 34,728 | 10.2% | 724.9 | 10.2% |
| Owner Occupied | 206,215 | 60.8% | 4,446.8 | 62.5% |
| Privately Rented | 53,932 | 15.9% | 1,279.1 | 18.0% |
| Unknown | - | 0.0% | - | 0.0% |
| Total | 339,428 | 100.0% | 7,117.8 | 100.0% |
3.2.4 Non-domestic properties
Many different characteristics are examined for non-domestic properties, for all of these both a precise count and an equivalent percentage is provided. This examines the number of non-domestic properties, the heat demand for these properties, the number of properties which fit into different settlement classifications (using the Scottish Government 8-fold urban rural classification) with count and heat demand values, key non-domestic property use classes[31] with count and heat demand values, and property type, which is taken from a field in Non-Domestic Analytics (previously Non-Domestic Buildings Energy Database) – again this has both a count and heat demand value. A copy of the relevant section of the summary table is provided in Figure 3—8 (below).
Figure 3—8 Copy of part of the table of the non-domestic properties which fall within potential heat network zones, taken from FNA Summary Table – National Excel document.
| Number of properties | % of total properties* | Heat load (GWh) | % of heat demand* |
|---|---|---|---|
| 73,981 | 18% | 17,634 | 69% |
| Non-Domestic Classification | Non-domestic urban/rural count | % of non-domestic properties* | Non-domestic urban/rural heat demand (GWh) | % of non-domestic heat demand* |
|---|---|---|---|---|
| Large Urban Area | 37,784 | 51.1% | 7,809.3 | 44.3% |
| Other Urban Area | 25,227 | 34.1% | 6,686.6 | 37.9% |
| Accessible Small Town | 3,678 | 5.0% | 443.5 | 2.5% |
| Remote Small Town | 2,486 | 3.4% | 376.7 | 2.1% |
| Very Remote Small Town | 2,087 | 2.8% | 261.2 | 1.5% |
| Accessible Rural | 1,274 | 1.7% | 1,522.0 | 8.6% |
| Remote Rural | 833 | 1.1% | 396.4 | 2.2% |
| Very Remote Rural | 612 | 0.8% | 138.7 | 0.8% |
| Total | 73,981 | 100.0% | 17,634.4 | 100.0% |
| Non-Domestic Property Class | Non-domestic property class count | % of non-domestic properties* | Non-domestic property class heat demand (GWh) | % of non-domestic heat demand* |
|---|---|---|---|---|
| Class 1-3 | 39,163 | 52.9% | 3,675.8 | 20.8% |
| Class 4-6 | 23,599 | 31.9% | 7,205.7 | 40.9% |
| Class 7-9 | 3,778 | 5.1% | 3,319.2 | 18.8% |
| Class 10-11 | 7,127 | 9.6% | 3,313.6 | 18.8% |
| Other | 314 | 0.4% | 120.2 | 0.7% |
| Total | 73,981 | 100.0% | 17,634.4 | 100.0% |
| Non-Domestic Property Type | Non-domestic property type count | % of non-domestic properties* | Non-domestic property type heat demand (GWh) | % of non-domestic heat demand* |
|---|---|---|---|---|
| Restaurants and Cafes | 6,833 | 9.2% | 469.8 | 2.7% |
| Retail and Financial Services | 32,330 | 43.7% | 3,205.9 | 18.2% |
| General Industrial, Storage or Distribution | 5,960 | 8.1% | 2,886.8 | 16.4% |
| Offices and Workshops | 17,639 | 23.8% | 4,318.8 | 24.5% |
| Hotels | 2,522 | 3.4% | 2,179.8 | 12.4% |
| Residential Institutions and Spaces | 1,256 | 1.7% | 1,139.4 | 6.5% |
| General Assembly | 1,613 | 2.2% | 1,390.9 | 7.9% |
| Non-residential Institutions | 5,514 | 7.5% | 1,922.7 | 10.9% |
| Other | 314 | 0.4% | 120.2 | 0.7% |
| Total | 73,981 | 100.0% | 17,634.4 | 100.0% |
3.2.5 Mixed-tenure and mixed-use
The mixed-tenure elements of the analysis examine buildings which contain multiple domestic properties with different tenures. This provides a count, what percentage of total domestic properties come from mixed-tenure properties, the total heat demand from mixed-tenure properties and how this compares as a percentage to the total heat demand from domestic properties. If a property is classified as mixed-tenure or not is captured by a field included within the Home Analytics dataset.
Mixed-use examines buildings with multiple non-domestic properties (this is classed as "Non-domestic only") and buildings with a mix of non-domestic and domestic properties (classed as "Mixed"). Within these two groups a property count, a percentage of total heat demands (or properties) mixed-use properties make up of the total properties within the potential heat network zones, the total demand from these properties and what percentage of total demand within the potential heat network zones this equates to. A "Mixed" mixed-use property was identified by if the parent UPRN associated to a property was present in both the Home Analytics and Non-Domestic Analytics datasets. A "Non-Domestic" mixed-use property however was identified if the parent UPRN associated to the property firstly wasn't present in Home Analytics and the "property types" associated to the parent UPRN were greater than 1.
A copy of the relevant section of the summary table is provided in Figure 3-9.
Figure 3—9 Copy of part of the table of the mixed-tenure and mixed-use properties which fall within potential heat network zones, taken from FNA Summary Table – National Excel document.
| Building / property typology classification | Mixed-tenure property count | Mixed-tenure % of domestic properties* | Mixed-tenure heat demand (GWh) | Mixed-tenure % of domestic heat demand* |
|---|---|---|---|---|
| Domestic only | 101,318 | 29.2% | 3,009.7 | 37.4% |
| Non-domestic only | - | - | - | - |
| Mixed | - | - | - | - |
| Total | - | - | - | - |
| Mixed-use property count | Mixed-use % of all properties* | Mixed-use heat demand (GWh) | Mixed-use % of heat demand* |
|---|---|---|---|
| - | - | - | - |
| 1,957 | 0.5% | 3,909.4 | 15.2% |
| 2,402 | 0.6% | 114.6 | 0.4% |
| 4,359 | 1.0% | 4,024.0 | 15.7% |
3.2.6 Heritage Properties
This heritage properties section uses three specific designations to provide information about buildings with heritage designation, these are:
- Listed properties (information is only available for domestic properties)
- Properties within conservation areas
- Properties within world heritage sites
The table also provides information as to the number of properties which have at least one of these characteristics, as they are not mutually exclusive. Again, the characteristics examined are: the number of properties, percentage of properties compared to the potential zone/zones as a whole, the heat demand from designated heritage properties and the percentage of demand this is, compared to the total for the potential zone/zones. A copy of the information is provided in Figure 3—10.
Figure 3—10 Copy of part of the table of the heritage properties which fall within potential heat network zones, taken from FNA Summary Table – National Excel document.
| Heritage type | No. properties | % of properties* | Heritage property heat demand (GWh) | % of heat demand* |
|---|---|---|---|---|
| Listed property (domestic only) | 21,540 | 6.2% | 759.7 | 9.5% |
| Within conserv. areas | 92,830 | 22.0% | 6,403.2 | 24.9% |
| Within world heritage sites | 10,131 | 2.4% | 631.24 | 2.5% |
| Either one of three criteria | 95,204 | 22.6% | 6,496.5 | 25.3% |
This is not an exhaustive list and further proxies are examined in Section 3.2.9.
3.2.7 Non-domestic Property Area
Non-domestic property area information is provided in four key categories: < 100 m2, 100 - 500 m2, 500 - 1000 m2 and > 1000 m2. Again, characteristics examined are: the number of properties, percentage of properties compared to the potential zone/zones as a whole, the heat demand from non-domestic properties with different floor areas and the percentage of demand this is, compared to the total for the potential zone/zones. A copy of this part of the table is provided in Figure 3—11.
Figure 3—11 Copy of part of the table of the non-domestic property area which fall within potential heat network zones, taken from FNA Summary Table – National Excel document.
| Floor area (m2) | No. of properties | % of non-domestic properties* | Heat demand (GWh/yr) | % of non-domestic heat demand* |
|---|---|---|---|---|
| < 100 m2 | 28,520 | 38.6% | 1,955.1 | 11.1% |
| 100 - 500 m2 | 29,545 | 39.9% | 2,639.9 | 15.0% |
| 500 - 1000 m2 | 6,445 | 8.7% | 1,450.8 | 8.2% |
| > 1000 m2 | 9,471 | 12.8% | 11,588.6 | 65.7% |
| Total | 73,981 | 100.0% | 17,634.4 | 100.0% |
3.2.8 Fuel Poverty
A summary of the estimated prevalence of fuel poverty within different potential heat network zones is also provided. This examines both fuel poverty and extreme fuel poverty using Home Analytics data. Data in Home Analytics on fuel poverty is expected to continue to improve over the period 2021-2023, with updates to the modelling method and change to ensure fully compatible with all elements of the new fuel poverty definition. The four standard characteristics are provided: number of properties, percentage of properties compared to the potential zone/zones as a whole, the heat demand from fuel poor households and the percentage of demand this is, compared to the total for the potential zone/zones. The approach undertaken to calculate these values was presented previously within Section 2.2.3. A copy of the relevant part of the table is provided in Figure 3—12.
Figure 3—12 Copy of part of the table of the characteristics of households in fuel poverty which fall within potential heat network zones, taken from FNA Summary Table – National Excel document.
| Estimated number of domestic properties classified as their householders living under: | No. properties | % of domestic properties* | Heat demand (GWh) | % of heat demand* |
|---|---|---|---|---|
| Fuel poverty (fuel bill >10% income after housing) | 90,662 | 26.1% | 1,378.5 | 17.1% |
| Extreme fuel poverty (fuel bill >20% income after housing) | 44,106 | 12.7% | 782.6 | 9.7% |
3.2.9 Built before 1919
Properties constructed before 1919 are examined in the table as a proxy for undesignated heritage properties. These are useful to examine alongside the heritage properties identified within Section 3.2.6 utilising three different heritage designations as there are likely to be similarities between the properties which fall into these two groups. Like designated heritage properties, these properties are of interest due to their construction type and the implications this has for demand characteristics and sensitivities to changes such as extensive retrofit. Again, the four standard characteristics are provided: number of properties, percentage of properties compared to the potential zone/zones as a whole, the heat demand of properties built before 1919 and the percentage of demand this is, compared to the total for the potential zone/zones. A copy of the relevant part of the table is provided in Figure 3—13.
Figure 3—13 Copy of part of the table of the characteristics of properties built pre-1919 within potential heat network zones, taken from FNA Summary Table – National Excel document.
| Built before 1919 | No. properties | % of properties* | Heat demand (GWh/yr) | % of heat demand* |
|---|---|---|---|---|
| Domestic pre-1919 | 86,792 | 25.0% | 2,977.1 | 37.0% |
| Non-domestic pre-1919 | 39,784 | 53.8% | 5,502.6 | 31.2% |
| Total | 126,576 | 30.1% | 8,479.8 | 33.0% |
3.2.10 Demand losses
The final factor covered within the summary table are losses through transmission and distribution in a heat network. These are assumed to be 10% of the total demand within a potential heat network zone, to give an initial indicative figure.[32] Once the heat loss figure is calculated it is added to the total heat demand within the potential heat network zone, to give the total heat generation which would be required to supply the potential heat network zone. Demand losses are an important consideration in relation to the targets set out within the Heat Networks (Scotland) Act, which are set in terms of heat supplied as opposed to being set in the context of the demand of connected properties, meaning demand losses need to be factored in.
A copy of this part of the table is provided in Figure 3—14.
Figure 3—14 Copy of the part of the table of the demand losses summary within potential heat network zones, taken from FNA Summary Table – National Excel document.
| Supply type | Heat supply (GWh/yr) |
|---|---|
| Total load demand | 25,672.5 |
| Anchor load demand | 14,074.9 |
| Distribution losses | 2,567.3 |
| Total demand | 28,239.8 |
Contact
Email: heatnetworks@gov.scot