Fair Work Action Plan: indicator report 2025
Report setting out the most recent data available for the Fair Work Action Plan's (FWAP) medium-term indicators. These are used to monitor progress towards the outcomes set out in the FWAP.
Part of
7. People are supported to prepare for, access and sustain Fair Work
Key findings
- The gender pay gap in Scotland for full-time employees has been narrowing over time. Data on pay gaps by ethnicity and disability is currently not available.
- The disability employment gap has reduced over time. The trend is less clear for the ethnicity employment gap due to greater variability in the estimates.
- The proportion of females, minority ethnic people and disabled people being supported through No One Left Behind[16] has increased over time.
- Entering employment is the most common progression outcome for females, minority ethnic people and disabled people supported through No One Left Behind, but lower proportions have entered employment rather than their comparator groups (men, white people and people who are non-disabled respectively).
- Employment outcomes for Fair Start Scotland[17] highlighted that higher proportions of minority ethnic participants secured a job start than white participants and higher proportions sustained employment. Similar proportions of male and female participants secured a job, but larger proportions of females sustained employment. Lower proportions of disabled participants secured a job and sustained employment than participants who are non-disabled.
Available indicators
- Pay gaps
- Disability and ethnicity employment gaps
- People supported through No One Left Behind
- Progression of people supported through No One Left Behind
- People supported through Fair Start Scotland
- Progression of people supported through Fair Start Scotland
Indicators not available or undergoing data quality assessment:
- Disability pay gap and ethnicity pay gap
- Intersectional gender employment gap
- Occupational segregation (gender)
7.1 Gender pay gap
The gender pay gap indicator is measured using data from the Scottish
Government Analysis of the ONS Annual Survey of Hours and Earnings data. Due to ongoing data quality issues with the ONS Annual Population Survey it is not possible to provide breakdowns of the disability and minority ethnic pay gap for Scotland for the latest years.
Impact on Fair Work: Contribution
The gender pay gap is calculated as the difference between the median hourly earnings (excluding overtime) for men and women as a proportion of the median hourly earnings (excluding overtime) for men.
The gender pay gap for full-time employees in both Scotland and the UK have typically been narrowing over time, Figure 22. The gender pay gap in Scotland has been narrower than for the UK since 2003. In 2024, the gender pay gap for full-time employees in Scotland was 2.2 per cent and in the UK was 7.0 per cent, Figure 23.
In 2024, the estimated gender pay gap for full-time employees in Scotland widened from 1.4% in 2023 to 2.2% in 2024. This is due to men’s hourly earnings (excluding overtime) increasing at a faster rate than women’s hourly earnings (excluding overtime).
The estimated gender pay gap in the UK narrowed from 7.5% in 2023 to 7.0% in 2024.
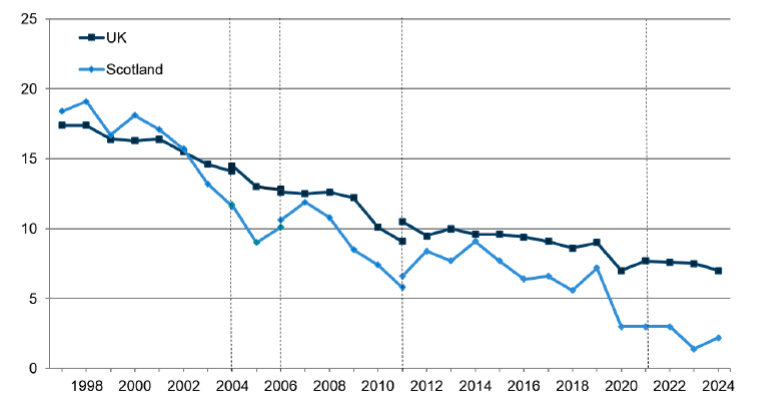
The gender pay gap for Scotland and the UK have typically been narrowing over time. Scotland has had a narrower gender pay gap than the UK since 2003.
Source: Scottish Government analysis of the Annual Survey of Hours and Earnings (ASHE), ONS
Notes:
1. Estimates for 2024 are provisional.
2. Employees are on adult rates, pay is unaffected by absence unless furloughed
3. Figures represent the difference between full-time men's and women's median hourly earnings (excluding overtime) as a percentage of full-time men's median hourly earnings (excluding overtime).
4. Full-time is defined as employees working more than 30 paid hours per week (or 25 or more for the teaching professions).
5. Dashed lines represent discontinuities in 2006, 2011 and 2021 ASHE estimates. Discontinuity in 2021 is due to change in occupational coding from SOC 2010 to SOC 2020.
6. Due to methodological changes, data for 2023 and 2024 might not be directly comparable to data for 2022 and earlier years.
7. Data for 2020 and 2021 are subject to more uncertainty and should be treated with caution because of the impact of the coronavirus (COVID-19) pandemic on the data and collection.
Scotland has a narrower gender pay gap for full-time and all employees than the UK in 2024
Source: Scottish Government analysis of Annual Survey of Hours and Earnings (ASHE), ONS
Notes:
1. Estimates for 2024 data are provisional.
2. Employees are on adult rates, pay is unaffected by absence
3. Figures represent the difference between men's and women's hourly earnings (excluding overtime) as a percentage of men's hourly earnings (excluding overtime).
4. Full-time is defined as employees working more than 30 paid hours per week (or 25 or more for the teaching professions).
5. Part-time is defined as employees working less than or equal to 30 paid hours per week (or less than 25 hours for the teaching professions).
7.2 Disability and ethnicity employment rate gaps
The sex, disability and ethnicity employment gap indicators are measured using data from the ONS Annual Population Survey.
Impact on Fair Work: Contribution
Sex
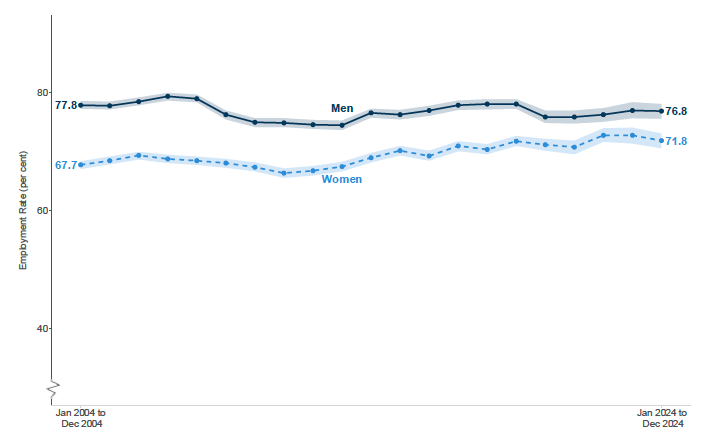
The employment rate for men has consistently been above the employment rate for women in Scotland, however the gap has narrowed in recent years.
Figure 24 shows that the employment rate for women in Scotland has typically been increasing over time, from an estimated 67.7% in January to December 2004 to an estimated 71.8% in January to December 2024.
The employment rate for men in Scotland has been consistently above that for women, however the gap has typically been narrowing over time
Source: Annual Population Survey, January to December datasets, ONS
Shaded areas represent 95% confidence intervals around the estimates.
Disability
We define disability based on the Equality Act 2010. Level and rate estimates for employment by disability are all based on those aged 16 to 64 years.
The disability employment rate gap is the difference between the employment rates for disabled and non-disabled people aged 16 to 64. It is calculated as the non-disabled employment rate minus disabled employment rate.
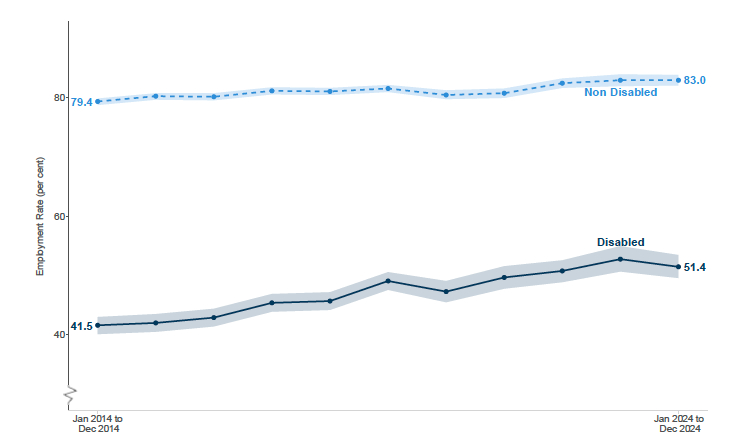
The employment rate for disabled people has been consistently lower than the employment rate for non-disabled people, Figure 25. The employment rate for disabled people aged 16 to 64 was estimated at 51.4% in January to December 2024. This was significantly lower than the employment rate for non-disabled people (83.0%).
The estimated disability employment rate gap has decreased from 37.4 percentage points (pp) in January to December 2016 to 31.5 pp in January to December 2024.
The employment rate for disabled people aged 16 to 64 has continually been lower than the employment rate for non-disabled people, with the gap slowly decreasing over time
Source: Annual Population Survey, January to December datasets, ONS
Shaded areas represent 95% confidence intervals around the estimates.
Ethnicity
There is likely to be variation between the individual ethnic groups included within the combined 'Minority ethnic' group which should be noted.
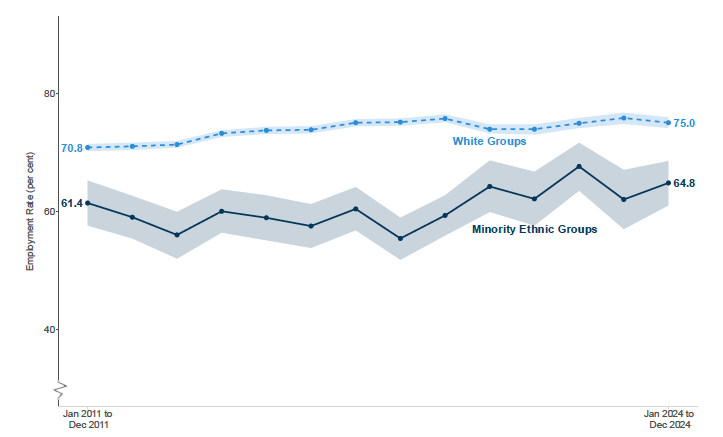
The employment rate for minority ethnic groups has been consistently lower than the employment rate for white groups. The employment rate for minority ethnic groups aged 16 to 64 was estimated at 64.8% in January to December 2024 compared to 75.0% for white groups, Figure 26.
Due to minority ethnic groups being a smaller group within the Scottish population, there is more variability in the employment rate estimates for minority ethnic groups than for white groups.
The minority ethnic employment rate gap is the difference between the employment rates for minority ethnic groups and white groups aged 16 to 64. It is calculated as the employment rate for white groups minus the employment rate for minority ethnic groups.
In 2024, the estimated gap between the employment rate for white groups compared with minority ethnic groups was 10.2 percentage points (pp).
The estimated employment rate for minority ethnic groups aged 16 to 64 has continually been lower than the employment rate for white groups
Source: Annual Population Survey, January to December datasets, ONS
Shaded areas represent 95% confidence intervals around the estimates.
7.3 People supported through No One Left Behind
This indicator is measured using data on No One Left Behind from Scotland’s Devolved Employment Services: No One Left Behind Statistical Summary July 2025.
Impact on Fair Work: Attribution
Sex
Since April 2019, the proportion of female participants supported through No One Left Behind has been lower than the proportion of male participants supported. Figure 27 shows the proportion of female participants has stayed below 50% from April 2019 to March 2025.
The lowest proportion of females participating was in Year 1 (April 2019 to March 2020) with only 40.8% of participants being female. The highest proportion was in Year 5 (April 2023 to March 2024) with 47.8% of participants being female. In the most recent period (Year 6, April 2024 to March 2025) 47.4% of participants were female, a 0.4 percentage point decrease from the previous year. Overall, from April 2019 to March 2025 the proportion of female participants was 45.8%.
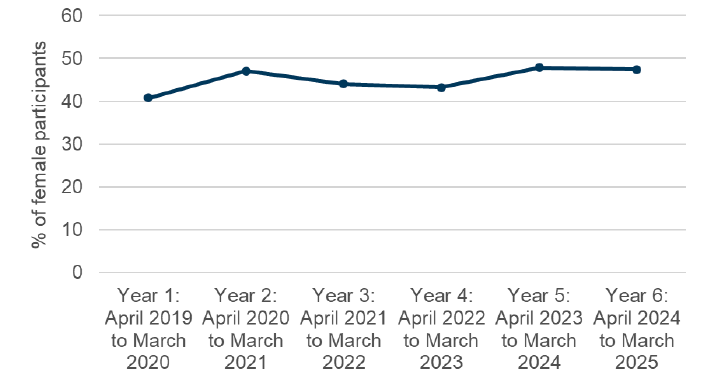
The proportion of female participants supported through No One Left Behind has been consistently lower than the proportion of male participants supported
Source: Scotland’s Devolved Employment Services: No One Left Behind Statistical Summary for April 2019 to March 2025, The Scottish Government
Ethnicity
The proportion of minority ethnic participants supported through No One Left Behind has increased throughout the course of the past six years, with a 12.7 percentage point increase in ethnic minorities supported from Year 1 (2.8% in April 2019 to March 2020) to Year 6 (15.5% in April to March 2025), shown in Figure 28.
Overall, from April 2019 to March 2025, 10.9% of participants supported through No One Left Behind were minority ethnic.
All figures should be interpreted with caution as some percentages are based on small numbers and the proportion of participants whose ethnicity is unknown has varied over time.
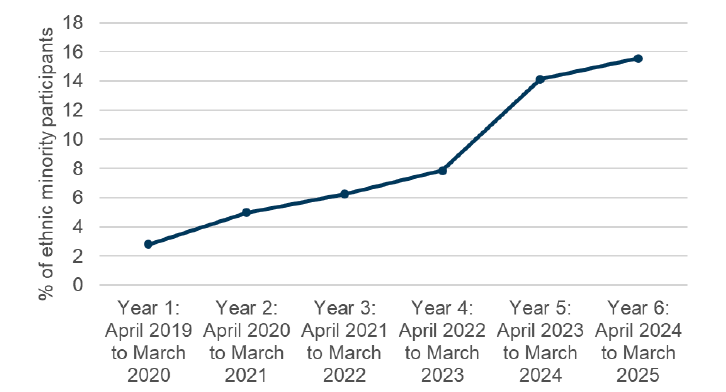
The proportion of minority ethnic participants supported through No One Left Behind has increased over the life of the programme
Source: Scotland’s Devolved Employment Services: No One Left Behind Statistical Summary for April 2019 to March 2025, The Scottish Government
Disability
Between Year 1 and Year 6, 23.1% of all participants supported through No One Left Behind were disabled. There has been a 14.2 percentage point increase in disabled participants from Year 1 (18.2%) to Year 6 (32.4%).
In most recent years the number of disabled participants has increased beyond the first year of the programme after experiencing a drop in participants in Year 2 (2020/2021), Figure 29. Year 2 saw a 7.7 percentage point decrease from the previous year (18.2% to 10.5%), likely due to the fact this year covered the first year of the COVID-19 pandemic.
These figures should be used with caution as some percentages are based on very small numbers and the proportion of unknowns can vary across time periods.
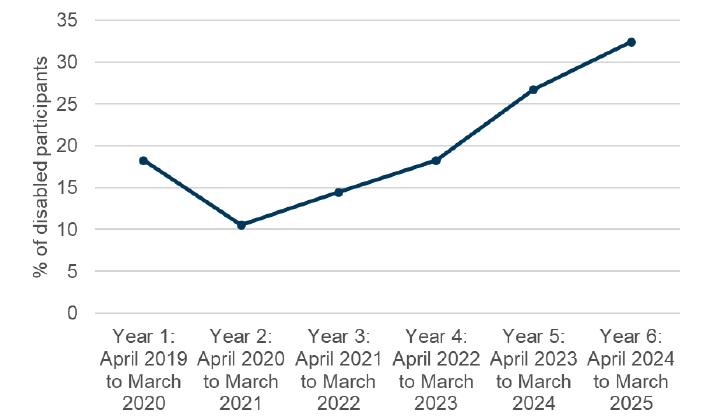
The proportion of disabled participants supported through No One Left Behind has increased over the life of the programme after an initial drop in Year 2
Source: Scotland’s Devolved Employment Services: No One Left Behind Statistical Summary for April 2019 to March 2025, The Scottish Government
7.4 Progression of people supported through No One Left Behind
This indicator is measured using data on No One Left Behind from Scotland’s Devolved Employment Services: No One Left Behind Statistical Summary July 2025.
Impact on Fair Work: Attribution
Sex
As shown in Figure 30, 29.4% of female participants entered employment in comparison to 32.6% of male participants.
A similar proportion of female (14.3%) and male (14.1%) participants entered further education, higher education or training. There was also a broadly similar proportion of female and male participants who gained a qualification (17.5% vs. 19.7%).
Participants also achieved other positive outcomes such as started work experience, re-engaged with school or started volunteering. Of the female participants, 9.8% achieved other outcomes, while 10.4% of male participants achieved other outcomes. Please note that it is possible for the same participant to achieve more than one positive outcome.
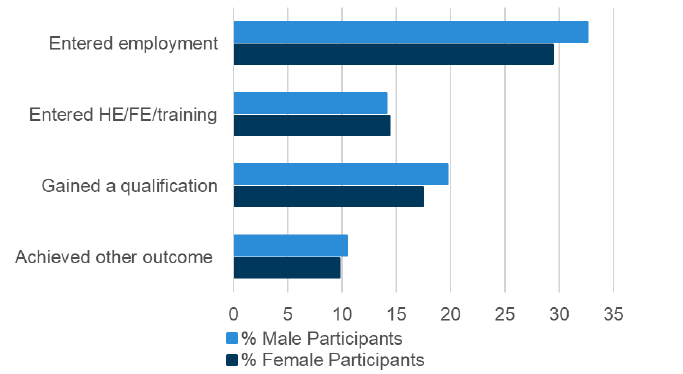
For both male and female No One Left Behind participants, entered employment is the most prevalent outcome achieved
Source: Scotland’s Devolved Employment Services: No One Left Behind Statistical Summary for April 2019 to March 2025, The Scottish Government
Ethnicity
A larger proportion of white participants entered employment in comparison to participants who were from a minority ethnic background (32.1% vs. 23.2%). As seen in Figure 31, a similar proportion of white and minority ethnic participants entered further education, higher education and/or training (14.1% vs. 13.1%) or gained a qualification (18.8% vs. 21.2%).
A similar proportion of minority ethnic participants achieved other outcomes (11.1%) in comparison to white participants (10.1%), this included starting work experience, re-engaged with school, or started volunteering.
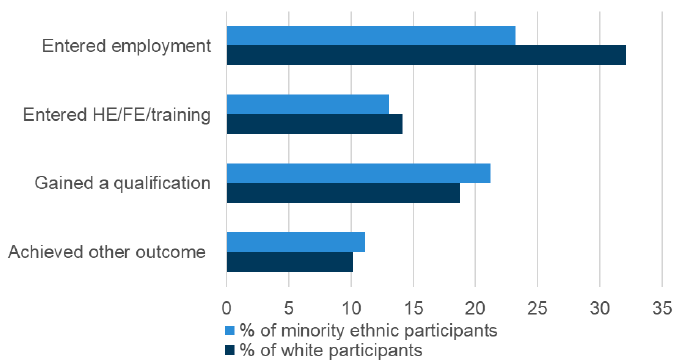
A lower proportion of participants from a minority ethnic background entered employment compared to white participants
Source: Scotland’s Devolved Employment Services: No One Left Behind Statistical Summary for April 2019 to March 2025, The Scottish Government
Disability
Of disabled participants, 22.4% entered employment while 34.6% of non-disabled participants entered employment. Of those, 3.6% of disabled participants did so with the support of a subsidy while for non-disabled participants 8.8% of those who entered employment were supported by a subsidy.
A similar proportion of disabled and non-disabled participants entered further education, higher education and/or training (13.6% vs. 14.5%) or gained a qualification (18.2% vs. 19.4%). 11.8% of disabled participants achieved other outcomes while 9.7% of non-disabled participants achieved other outcomes, shown in Figure 32.
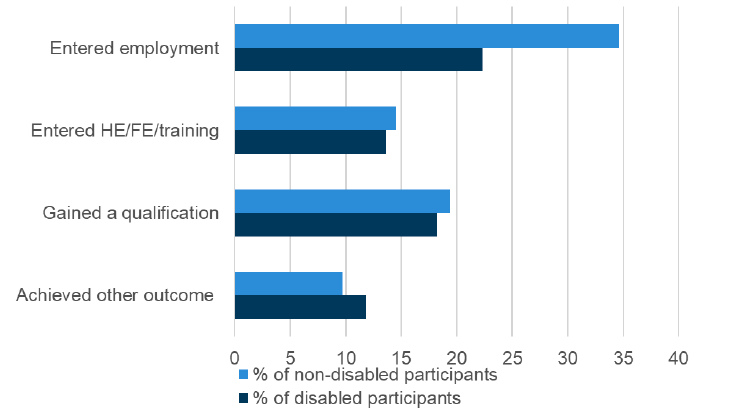
While entering employment is the most prevalent outcome for both disabled and non-disabled No One Left Behind participants, a lower proportion of disabled participants entered employment compared to non-disabled participants
Source: Scotland’s Devolved Employment Services: No One Left Behind Statistical Summary for April 2019 to March 2025, The Scottish Government
7.5 People supported through Fair Start Scotland
This indicator is measured using data from Scotland’s Devolved Employment Services: Fair Start Scotland Statistical Summary, May 2025. Fair Start Scotland started in April 2018 and closed to new referrals on 31 March 2024. As no new starts will now be recorded, no further updates to this timeseries are possible.
Impact on Fair Work: Attribution
Sex
Over the lifetime of Fair Start Scotland, April 2018 to March 2024, 37.9% of participants were female. Figure 33 shows the percentage share of Fair Start Scotland participants who were female in each year of the scheme. In Year 1, 34.9% of participants were female, increasing to 36.6% in Year 2 and 40.5% in Year 3. Since Year 3 there has been a fall in the proportion of female participants, decreasing to 36.2% in Year 6.
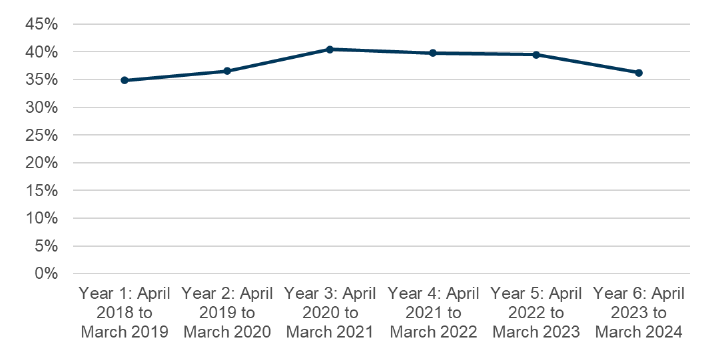
The proportion of Fair Start Scotland participants who were female increased from year 1 to year 3, remained relatively stable before decreasing in year 6
Source: Scotland’s Devolved Employment Services: Fair Start Scotland Statistical Summary, July 2025, The Scottish Government
Ethnicity
Overall, 8.4% of Fair Start Scotland participants were of a minority ethnic background. In Year 1 only 3.6% of participants were minority ethnic, rising to 6.1% in Year 2. As seen in Figure 34, the figure dropped in Year 3 to 4.4% but then continued increasing with 17.9% of participants being from an ethnic minority background in Year 6.
Monitoring the ethnicity of Fair Start Scotland participants can be challenging due to data completeness where higher rates of unknown ethnicities were observed in earlier years. The proportion of unknowns has generally decreased throughout the years with Year 5 having the lowest amount at 7% unknowns, compared to the high of 31.1% in Year 2.
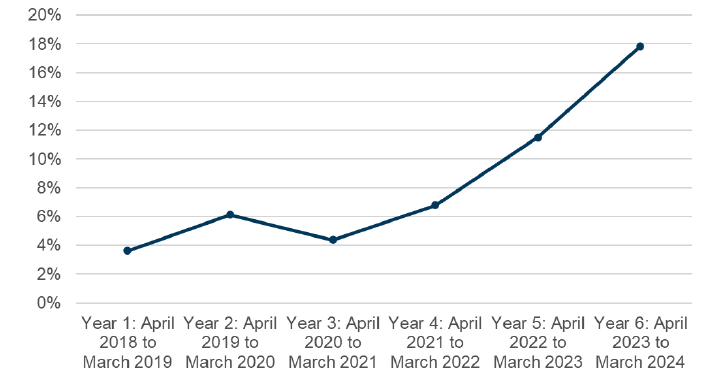
The proportion of Fair Start Scotland participants from a minority ethnic background has been increasing since Year 1, with a slight dip in Year 3
Source: Scotland’s Devolved Employment Services: Fair Start Scotland Statistical Summary, July 2025, The Scottish Government
Disability
Overall, 43.5% of Fair Start Scotland participants were disabled in comparison to 48.4% who were non-disabled. The proportion of disabled participants has fluctuated yearly with the highest proportion being in Year 1 at 54.9% and the lowest in Year 3 at 31.9%. While the proportion increased again in Year 4 (46.7%), the subsequent two years saw a decrease (43.2% in Year 5 and 40.8% in Year 6), shown in Figure 35.
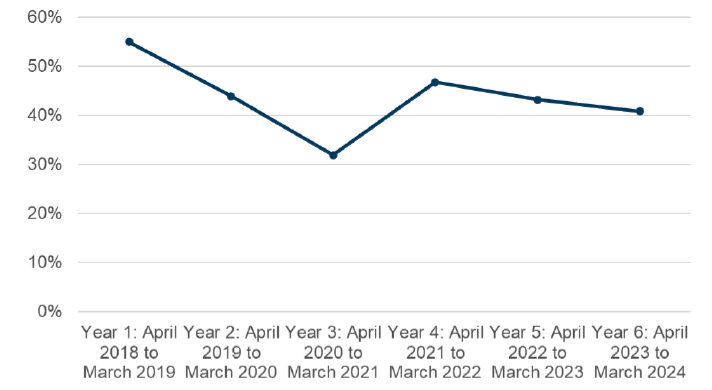
The proportion Fair Start Scotland participants who were disabled has fluctuated yearly with the highest proportion being in Year 1
Source: Scotland’s Devolved Employment Services: Fair Start Scotland Statistical Summary, July 2025, The Scottish Government
7.6 Progression of people supported through Fair Start Scotland
This indicator is measured using data from Scotland’s Devolved Employment Services: Fair Start Scotland Statistical Summary, July 2025. When considering job outcomes, to properly assess how participants have progressed, it is more appropriate to calculate this for cohorts of participants where enough time has passed in pre-employment support and for outcomes to be achieved. For example, pre-employment support lasts 12 months so for a participant to complete this support and also sustain employment for 12 months, a total of at least 24 months is required from their start date:
- job starts = achievable by participants who started on the programme between April 2018 and March 2024,
- 3 month job outcome = achievable by participants who started on the programme between April 2018 and December 2023,
- 6 month job outcome = achievable by participants who started on the programme between April 2018 to September 2023,
- and 12 month job outcome = achievable by participants who started on the programme between April 2018 to March 2023.
As outcomes will continue to be recorded for current participants, these figures will continue to be updated.
Since Fair Start closed to new referrals in March 2024, the number of participants moving into employment has slowed and overall numbers and percentages are less subject to change quarter on quarter. Therefore, quarterly publications will be paused and the next update will be in 2026.
Sex
The proportion of job starts for male and female participants were similar (females 38.1%. males 38.2%), but female participants were more likely to stay in employment, shown in Figure 36. There were a similar proportion of early leavers with 50.2% of female starts and 50.5% of male starts.
The proportion of female job starts that sustained employment for 3 months was 29.7% compared to 27.5% for male starts. Similarly, 25.2% of female starts sustained 6 months of employment, while in comparison 22.4% of male starts did, and 20.3% of females starts sustained employment for 12 months compared to 17.0% of male starts.
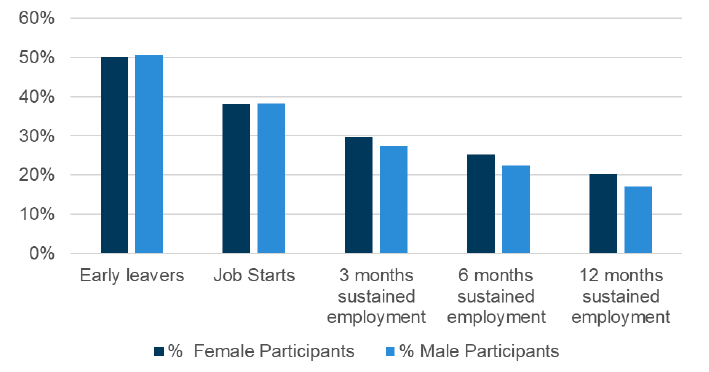
While the proportion of job starts for male and female participants were broadly similar, female starts were more likely to stay in employment
Source: Scotland’s Devolved Employment Services: Fair Start Scotland Statistical Summary, July 2025, The Scottish Government
Ethnicity
A higher proportion of Fair Start Scotland starts from a minority ethnic background started and sustained jobs compared to starts identifying as white as seen in Figure 37. A higher proportion of starts identifying as white (51.2%) were early leavers than those from a minority ethnic background (44.9%).
The proportion of starts from a minority ethnic background that sustained 3 months of employment was 33.3% compared to 27.5% for starts identifying as white. The proportion of job starts who sustained 6 months of employment was 22.8% for starts identifying as white and 27.6% for starts from a minority ethnic background, and 12 months of sustained employment was achieved by 17.8% of job starts identifying as white and 21.2% of starts from a minority ethnic background.
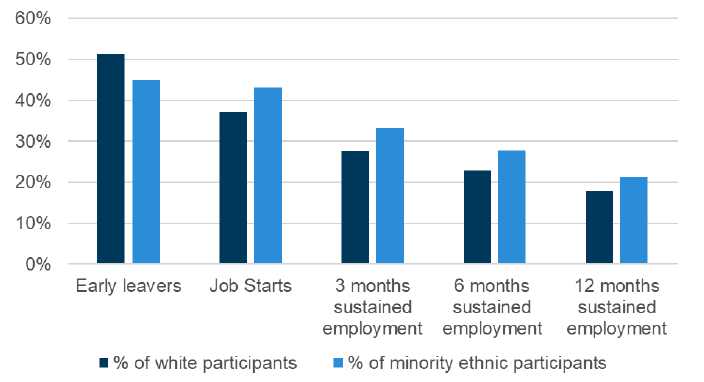
A higher proportion of Fair Start Scotland starts from a minority ethnic background started and sustained jobs compared to starts identifying as white
Source: Scotland’s Devolved Employment Services: Fair Start Scotland Statistical Summary, July 2025, The Scottish Government
Disability
The Fair Start Scotland participants who were disabled had a smaller proportion of job starts and sustained employment in comparison to participants who were non-disabled as shown in Figure 38. A larger proportion of disabled starts (53.1%) were early leavers in comparison to those who were non-disabled (47.4%).
The proportion of starts who were disabled who sustained employment was smaller than non-disabled starts for 3 months of sustained employment (24.0% vs. 32.0%), 6 months sustained employment (19.8% vs. 26.5%), and 12 months sustained employment (15.4% vs. 20.6%).
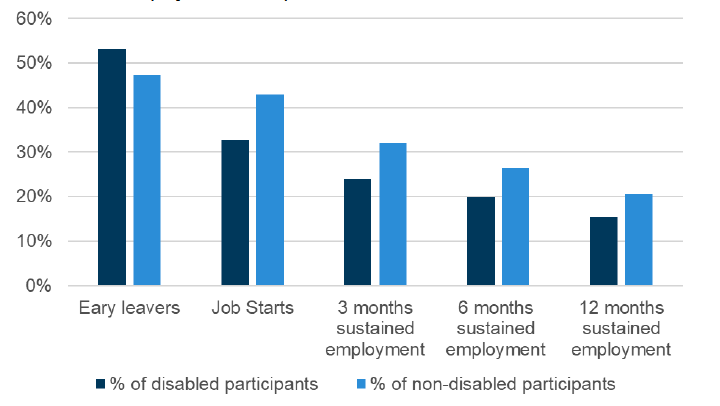
Fair Start Scotland starts who were disabled had a smaller proportion of job starts and sustained employment in comparison to non-disabled starts
Source: Scotland’s Devolved Employment Services: Fair Start Scotland Statistical Summary, July 2025, The Scottish Government
7.7 Occupational segregation
This indicator is measured using data from Scotland’s Census 2022. This data is usually available from the ONS Annual Population Survey, however it is not available at present, as highlighted in the Scottish Government’s quality assessment of the ONS Labour Force Survey and Annual Population Survey data for Scotland[18]. Where the Census data has been used it considers those in employment (employees or self-employed) aged 16 and over who are in the managers, directors and senior officials occupation group.
Sex
The proportion of people who are in employment and are managers, directors and senior officials in Scotland who are female is 40.0%, with the remaining 60.0% being male, shown in Figure 39. Of all females in employment aged 16 and over in Scotland, 6.3% are managers, directors or senior officials. This proportion is higher for males at 9.2%.
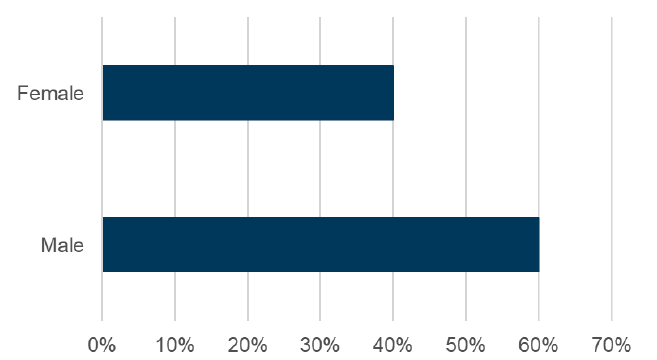
The majority of managers, directors and senior officials in Scotland were male in 2022
Source: Scotland’s Census 2022, National Records of Scotland
Ethnicity
The majority of managers, directors and senior officials in Scotland are from the white ethnic group (94.7%). Of those from white groups, 78.9% were White Scottish, 14.5% were Other White British, and 6.7% were Other White.
The ethnic group with the next largest proportion of managers, directors and senior officials in Scotland is Asian, Asian Scottish, or Asian British (3.4%), followed mixed or multiple ethnic groups (0.7%) is shown in Figure 40.
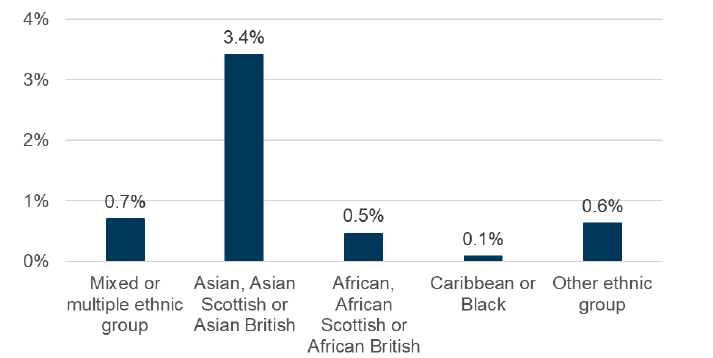
The majority of managers, directors and senior officials in Scotland from minority ethnic groups were from an Asian background in 2022
Source: Scotland’s Census 2022, National Record of Scotland
Disability
The majority of those in employment who are managers, directors or senior officials in Scotland are non-disabled (89.3%). People who are disabled indicated that their day to day activities are limited a lot make up 2.0% of managers, directors and senior officials and those who are disabled with day to day activities were limited a little make up 8.7%, shown in Figure 41.
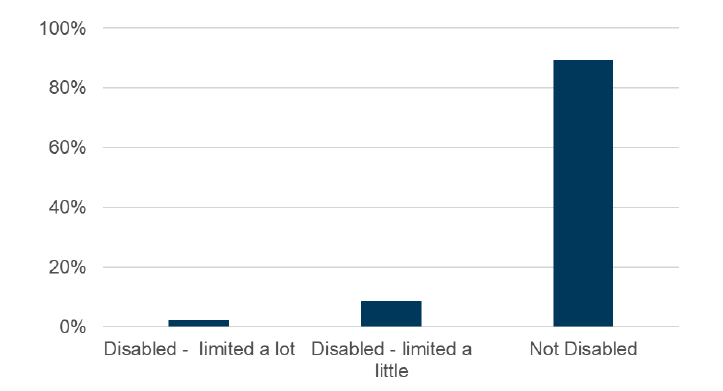
The majority of managers, directors and senior officials in Scotland were non-disabled in 2022
Source: Scotland’s Census 2022, National Record of Scotland
Contact
Email: susan.anton@gov.scot