Elasticities relevant to tourism in Scotland: evidence review
An overview of estimates of price elasticities of demand (PED) and income elasticities of demand (YED) for tourists to destinations relevant to Scotland; price elasticities of supply (PES) of commercial accommodation relevant to Scotland and other factors influencing the demand and supply of tourism.
2 Methodology
This section presents the methodology of this report. Section 2.1 describes the methodology used in the systematic literature review. As no empirical study was found to estimate the elasticities for tourism in Scotland, Section 2.2 proposes the methodology and results of a cluster analysis to identify the most comparable destinations for Scotland. Evidence on these identified destinations can then be considered as an approximation for tourism in Scotland. Section 2.3 provides a summary of Section 2.
2.1 Literature review search strategy
To provide an up-to-date overview of evidence, this report uses the approach of systematic literature review to gather information from primary studies published post-2010[1]. As a systematic approach, the pre-specific search methodology ensures comprehensive, transparent and replicable results. This section describes the search strategy as to how the procedure of data search and extraction was performed. It consists of four sub-sections including the sources to search, search terms used, the data screening process to select relevant evidence, and the method to extract and appraise information in the screened literature.
2.1.1 Sources to search
Scopus, the Web of Science (previously known as Web of Knowledge) and Google Scholar were chosen as the sources to search for published academic and grey literatures. Scopus and the Web of Science complement each other as the main sources of academic literature including journal articles and book series. Google Scholar searches the full text of an article for keywords as well as a wider range of sources, such as conference proceedings and books that are not available in traditional databases, making it a good source to search for grey literature.
2.1.2 Search terms
Relevant keywords and their variants were used to gather academic and grey literatures from international evidence published since 2010. The language of published literature is limited to English. Using the search terms below, 413 results were returned by Scopus and 306 by the Web of Science. Merging these two sets of results with grey literature, 558 unique publications were identified in total.
Scopus:
TITLE-ABS-KEY ( ( tourism or hotel or hospitality or accommodation ) and ( demand or supply ) ) and all ( (price elasticity) or (price elasticities) or (income elasticity) or (income elasticities) ) and PUBYEAR > 2009
Web of Science:
TS=((tourism or hotel or hospitality or accommodation) and (demand or supply) and elasticit*) and PY=(2010-2020)
Refined by: Databases: WOS
Search language=Auto
2.1.3 Data screening
After building up the pool of literature, each of the 558 publications was screened to identify those empirically estimated tourism elasticities. The screening process identified 154 studies that estimated PED and/or YED for tourism or PES of commercial accommodation at 60 destinations worldwide (including 21 European countries/regions). In this process, no empirical study was found specifically about Scotland.
However, it would be reasonable to assume that destinations with similar profiling characteristics should exhibit similar relationships between tourism demand and its economic determinants such as prices and tourist income. Therefore, a cluster analysis was proposed to identify the destinations that are most comparable to Scotland. Empirical studies on these destinations can then serve as a possible approximation for Scotland. The methodology of cluster analysis is detailed in Section 2.2.
2.1.4 Data extraction
Having identified similar destinations, relevant publications were reviewed to summarise the findings including the ranges of price elasticities of demand and supply; income elasticities of demand; other key explanatory variables involved; and the techniques, models and data sources used. The breadth, depth and rigour of the available evidence base as well as the future research direction were also discussed in this report.
The quality of relevant evidence was assessed based on the criteria including the methodological rigour and if relevant, the quality of journal published. To assess the quality of journals, the Academic Journal Guide (AJG) produced by Chartered ABS (2018a) was used. The AJG is a guide to the range and quality of journals in the area of business and management research. Based on expert judgements by the Scientific Committee, each of the 1,561 academic journals included in the AJG 2018 is awarded a rating of 1, 2, 3, 4 or 4* (Category 4* is the highest rating). Therefore, the rating provides a useful indicator of the quality of the journal where an article is published. For the journals not included on the AJG 2018, they were regarded as Category 0 in this report. As stated in the methodology of AJG, non-inclusion in the AJG "may reflect a wide range of factors, ranging from the aims and scope of the journal that lie outside the scope of business and management studies to, quite simply, the Scientific Committee and those they consulted, not encountering sufficient evidence on which to formulate an opinion" (Chartered ABS, 2018b, p.4).
2.2 Cluster analysis methodology
As set out above, the initial review of literature found no empirical study specifically on Scotland. This study conducted a cluster analysis to identify the tourism destinations that are most similar to Scotland among the 60 destinations identified in the literature.
Cluster analysis is an approach to grouping a set of objects (or tourism destinations in this report) so that objects within the same group (known as a cluster) are more similar to one another than to those in other groups (clusters). The similarity between destinations is evaluated with a distance measure[2] based on selected characteristics.
In this report, two sets of destination characteristics were used to ensure the results are reasonably robust to the selection of characteristics. The first set of characteristics consist of per capita measures including tourism intensity (calculated as tourist arrivals divided by the population at the destination) and tourism receipts per capita (calculated as tourism receipts divided by tourist arrivals). The second set of characteristics include overall measures of tourism demand consisting of tourist arrivals, tourism receipts and the population at destinations. Five additional characteristics of destinations are also included in both sets: the geographical area, average daily temperature, average monthly precipitation[3], gross domestic product per capita (GDP per capita in current US$) and shortest flight distance to Edinburgh (great circle distance). The data were collected from the United Nations World Tourism Organisation (UNWTO), World Bank, and United Nations Group of Experts on Geographical Names (UNGEGN) databases (as shown in Appendix A).
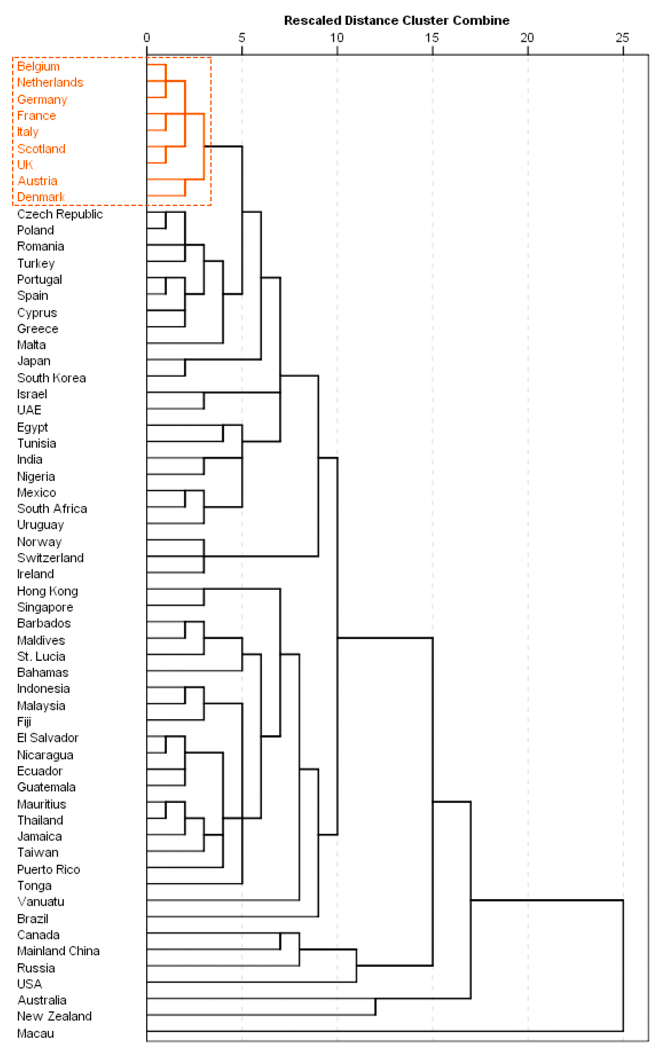
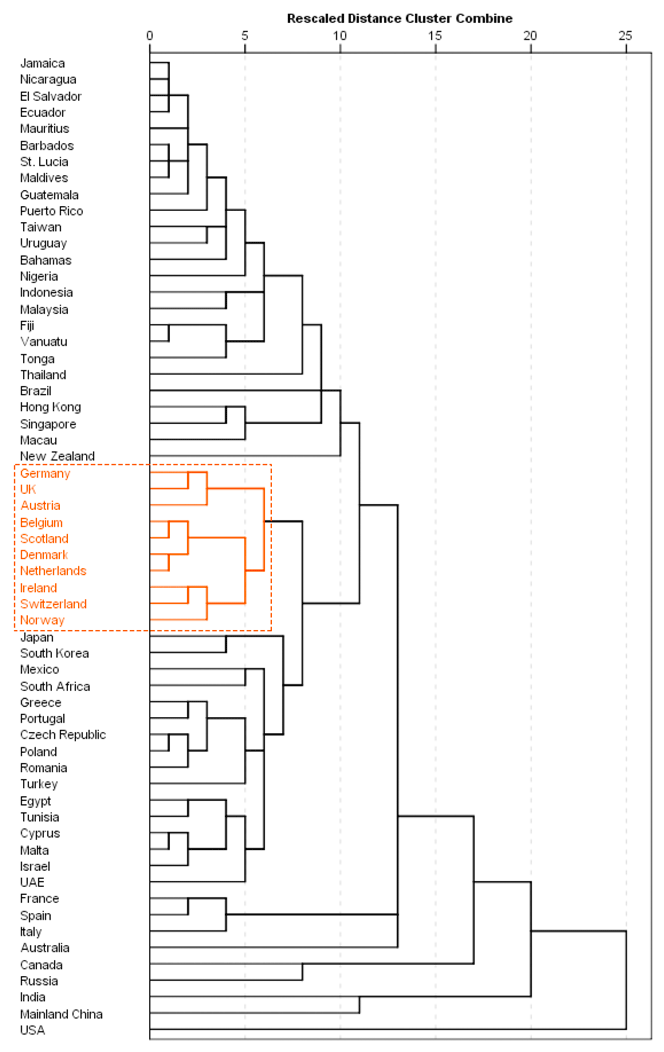
The results of the cluster analysis are illustrated in Figures 2.1 and 2.2. The dendrograms represent clusters of destinations and the distance between clusters. As shown in Figure 2.1, based on the first set of characteristics from the perspective of per capita measures, the most similar destinations to Scotland are the UK (including Scotland to be in line with the definition in the literature), Belgium, the Netherlands, Germany, France, Italy, Austria and Denmark. Figure 2.2 shows the results using the second set of characteristics from the perspective of overall volume and scale measures. In addition to the UK, Belgium, the Netherlands, Germany, Austria and Denmark, which remain as the most similar destinations to Scotland, Ireland, Switzerland and Norway are also found in the same cluster. This shows a fairly robust clustering outcome where most destinations remain the same with different measures used for cluster analysis.
Combining the destinations from both sets of clustering results, the following 11 countries can be considered as the most similar tourism destinations to Scotland: the UK, Belgium, the Netherlands, Germany, France, Italy, Austria and Denmark, Ireland, Switzerland and Norway. The other European destinations can be generally classified in the next most relevant cluster. Therefore, the review of the literature is organised as follows. Section 3.1 overviews 40 publications that reported elasticities for 21 European destinations, 19 European source markets as well as Scotland's top source markets. Section 3.2 provides a more detailed review focusing on 10 articles reported elasticities for the most relevant 11 destinations to Scotland. Section 3.3 reviews four studies that estimated elasticities for commercial accommodation.
2.3 Summary
This section describes the methodology used in this report. The search strategy of the systematic literature review is described. As no empirical study was found to estimate the elasticities for tourism in Scotland, a cluster analysis was conducted to search for evidence from other destinations that are most comparable to Scotland. The analysis identified 11 relevant destinations which form the basis for the literature review in Section 3.
Contact
Email: juanmanuel.scarilli@gov.scot