Education Outcomes for Looked After Children 2020/21
Information on attainment, leaver destinations, attendance and exclusions for school leavers in Scotland who were looked after during the 2020/21 school year.
School exclusions
Headline results
- Exclusion rates for pupils looked after within the year have fallen over the last 11 years, with a marked reduction between 2018/19 (152 exclusions per 1,000 pupils) and 2020/21 (78 exclusions per 1,000 pupils). This is likely to be largely due to the lower amount of time spent in school during the pandemic.
- The exclusion rate for looked after pupils was more than six times the rate for all pupils in 2020/21, but this gap has reduced since 2012/13.
Exclusions data is collected every two years. This section presents data on the numbers and rates of exclusions of the estimated 483 pupils who were looked after within the year at publicly-funded schools, and who experienced an exclusion.
Table 4.1 shows the number of exclusions per 1,000 pupils. As children can be excluded more than once per year, a single child may be counted more than once in these figures. The rate of exclusions among pupils looked after within the year was 78 per 1,000 pupils in 2020/21. This is more than six times as high as the rate of 12 per 1,000 pupils for all pupils.
The exclusion rate was lowest for pupils looked after within the year in primary school in 2020/21, at 20 per 1,000, compared with 122 per 1,000 pupils for those in secondary school and 187 per 1,000 for those attending a special school.
| Sector | 2012/13 | 2014/15 | 2016/17 | 2018/19 | 2020/21 |
|---|---|---|---|---|---|
| All looked after within the year | |||||
| Primary | 83 | 83 | 84 | 56 | 20 |
| Secondary | 467 | 383 | 317 | 230 | 122 |
| Special | 565 | 553 | 355 | 309 | 187 |
| Scotland | 280 | 247 | 210 | 152 | 78 |
| All pupils | |||||
| Primary | 10 | 9 | 11 | 8 | 4 |
| Secondary | 58 | 50 | 48 | 40 | 22 |
| Special | 148 | 126 | 94 | 62 | 32 |
| Scotland | 33 | 27 | 27 | 22 | 12 |
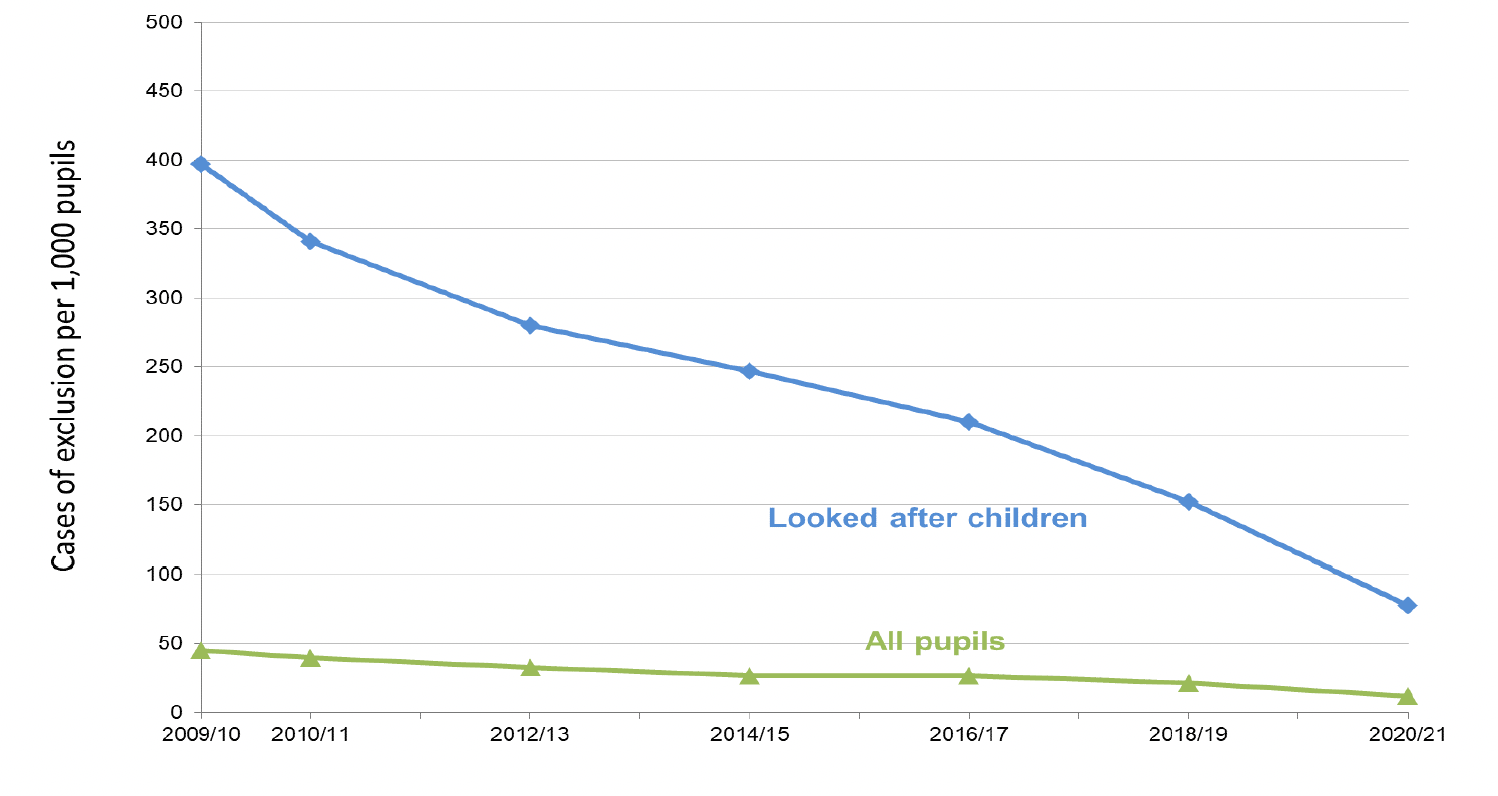
The rate of exclusion cases for looked after pupils fell substantially in previous years, from 397 per 1,000 pupils in 2009/10 to 152 per 1,000 pupils in 2018/19. This was followed by a particularly large reduction between 2018/19 and 2020/21 with the exclusion rate almost halving to 78 per 1,000 for looked after pupils. There was also large reduction seen in the exclusion rate for all pupils between 2018/19 and 2020/21 (Chart 5). This decrease has been seen across all sectors (Table 4.1). Since 2009/10, the gap between all pupils and those who were looked after has narrowed, although the exclusion case rate for pupils looked after within the year still remains much higher than for all pupils.
While the reduction in exclusion cases between 2018/19 and 2020/21 for both looked after children and all pupils continues the trend seen since 2009/10, the particularly low number of exclusion cases during 2020/21 could be largely attributable to the COVID-19 pandemic, with many local authorities citing the lower amount of time spent in school as a reason for the reduction in their case numbers.
Where Table 4.1 presents data on the number of exclusions, including potential multiple counts of the same child, Table 4.2 presents data on the number of individual children excluded; the number of pupils excluded per 1,000 pupils shown in Table 4.2 are therefore lower than the number of exclusions per 1,000 pupils shown in Table 4.1.
In 2020/21, the rate of pupils excluded was 46 per 1,000 pupils for children looked after within the year. This is around five times as high as the rate of 9 per 1,000 pupils for all pupils. Because pupils looked after within the year are five times as likely to be excluded compared with all pupils, but the exclusion case rate is more than six times as high, pupils looked after within the year who are excluded are more likely to be excluded multiple times than all pupils who are excluded.
| Stage | Number of pupils excluded | Rate of pupils excluded per 1,000 pupils |
|---|---|---|
| All looked after within the last year | ||
| Primary | 72 | 15 |
| Secondary | 379 | 73 |
| Special | 32 | 65 |
| Scotland | 483 | 46 |
| All Pupils | ||
| Primary | 1,014 | 3 |
| Secondary | 4,873 | 16 |
| Special | 113 | 16 |
| Scotland | 6,000 | 9 |
Placement type and number of placements
As with attendance rate, there is a similar disparity in rates of exclusion according to the type of accommodation in which pupils looked after within the year are placed. Children in residential accommodation and at home with parents tend to have higher rates of exclusions than those looked after in foster care or with friends or relatives or in other community placements (including with prospective adopters). (Table 4.3).
| Accommodation type | Total exclusions for looked after children | Exclusions case rate per 1,000 pupils who were looked after |
|---|---|---|
| In the community (children with one placement) | ||
| At home with parents | 296 | 112 |
| With friends or relatives | 168 | 54 |
| With foster carers provided by LA | 59 | 31 |
| With foster carers purchased by LA | 17 | 18 |
| In other community(2) | * | * |
| Residential Accommodation (children with one placement) | ||
| In local authority home | 67 | 233 |
| In voluntary home | * | * |
| In other residential(3) | 41 | 189 |
| More than one placement | 164 | 120 |
| All looked after within the last year | 825 | 78 |
(1) Cells containing * represent small numbers that have been suppressed to maintain confidentiality.
(2) Includes supported accommodation and with prospective adopters.
(3) Includes in residential school, in secure care accommodation, and crisis care.
Pupils who were looked after within the year with a greater number of placements tended to have a higher rate of exclusion (Table 4.4). There were 72 cases of exclusion per 1,000 pupils for pupils with only one placement, increasing to 381 cases of exclusion per 1,000 pupils for pupils with five or more placements.
| Number of placements | Total exclusions for looked after children | Exclusions case rate per 1,000 pupils who were looked after |
|---|---|---|
| All looked after within the last year | ||
| 1 | 661 | 72 |
| 2 | 108 | 103 |
| 3 | 38 | 159 |
| 4 | 10 | 179 |
| 5 or more | 8 | 381 |
| Scotland | 825 | 78 |
Contact
Email: children.statistics@gov.scot