Education Outcomes for Looked After Children 2020/21
Information on attainment, leaver destinations, attendance and exclusions for school leavers in Scotland who were looked after during the 2020/21 school year.
School Attendance
Headline results
- The attendance rate for looked after children increased from 86.8% in 2018/19 to 87.9% in 2020/21, despite a slight decrease in attendance for pupils overall from 93% in 2018/19 to 92% in 2020/21.
- The attendance rate for pupils looked after in a foster care placement was higher than the attendance rate for all pupils.
Information on attendance and absence is collected biennially, and covers all publicly funded local authority schools in Scotland and Jordanhill, the grant-aided mainstream school. It does not cover grant-aided special schools or independent schools. An extract of pupils' attendance records for the whole school year is usually obtained from schools' management information systems. However, during the 2020/21 school year daily extracts of pupils' attendance reports were taken by Scottish Government to monitor impact of the COVID-19 pandemic on schools. 12 of the 32 local authorities chose to use this daily data for the 2020/21 attendance and absence collection rather than having a new extract taken covering the whole year. This section compares attendance for all pupils with 10,603 pupils who were looked after within the last year.
Impact of the COVID-19 pandemic on attendance
During 2020/21 there was disruption to school attendance caused by the COVID-19 pandemic. This disruption included the closure of most school buildings in Scotland between January and April 2021, other school closures following local outbreaks, and individual pupils being absent with COVID-19 or when self-isolating.
While school buildings were closed to pupils, education continued via home-learning for the majority of pupils. Vulnerable pupils who would benefit from being in school and children of key workers were allowed to attend school buildings. To account for these changed circumstances, new attendance and absence codes were made available to schools to allow them to more accurately record COVID-19 related absence and home learning provision. Schools then pass this information to Local Authorities and the Scottish Government as part of this national data collection. Due to the fast pace of their introduction, it is known that use of these codes was inconsistent between different schools and local authorities, including a general under-reporting of absence from home learning.
The attendance rates for the times when schools were open to pupils is not affected by the known under-reporting of absence from home-learning, and is methodologically consistent with attendance rates from previous years. Therefore the reporting and commentary in this section refers only to the times in which schools were open to pupils, unless stated otherwise.
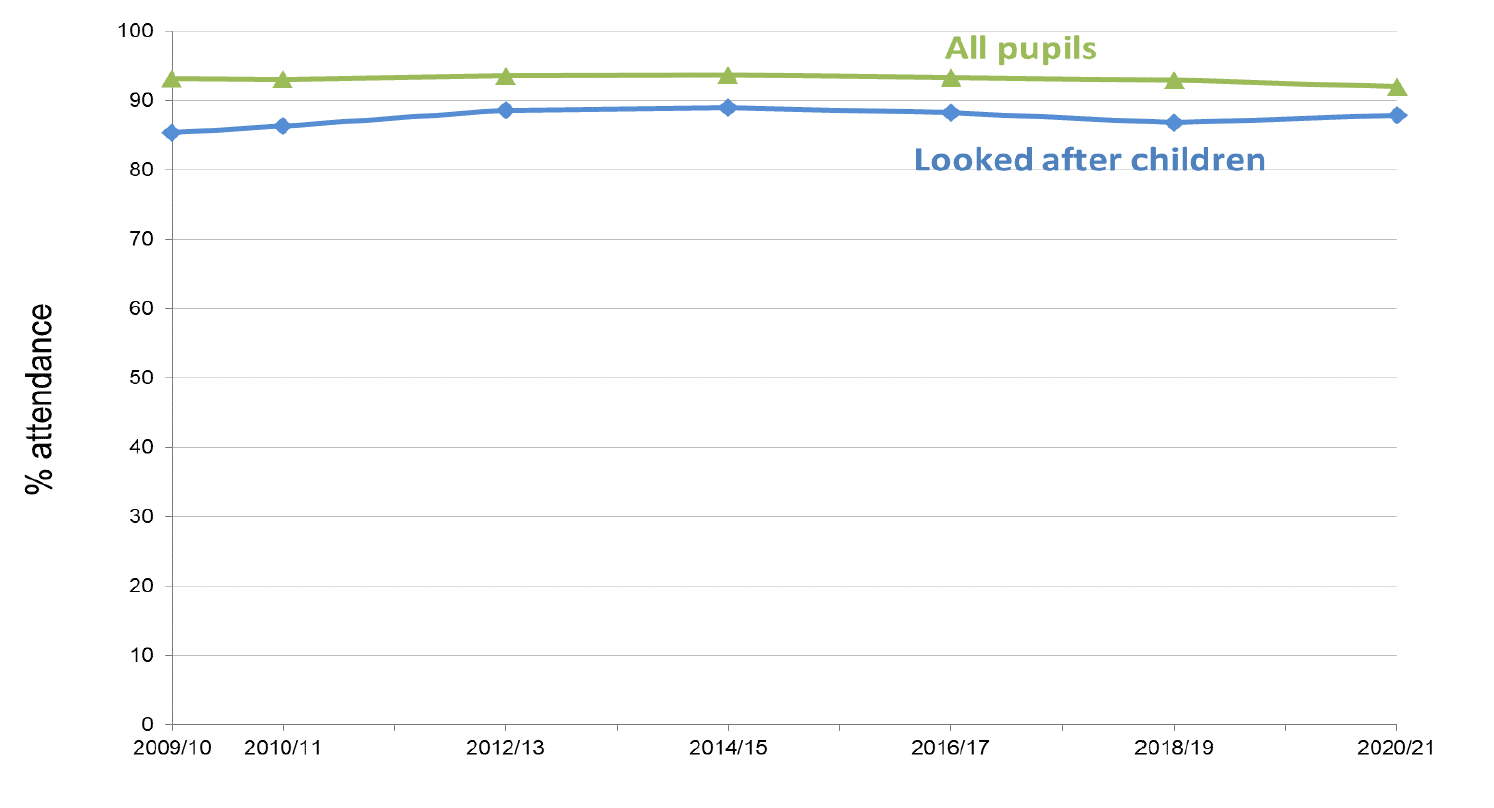
Chart 4 shows that the rate of attendance for pupils looked after within the year has been consistently below the rate for all pupils, however this gap is notably smaller than for other indicators. The gap in attendance rate between these groups decreased slightly between 2018/19 and 2020/21 from 6.2 percentage points in 2018/19 (93.0% for all pupils and 86.8% for looked after pupils) to 4.1 percentage points in 2020/21 (92.0% for all pupils and 87.9% for looked after pupils).
Sector
| Stage/ Sector | Pupils looked after within the last year | All Pupils |
|---|---|---|
| Primary | 91.9 | 94.0 |
| Secondary | 83.4 | 89.1 |
| Special | 86.8 | 89.3 |
| Scotland | 87.9 | 92.0 |
(1) All figures have been updated to account for improved data identifiers. While the data in these tables are comparable, figures should not be compared with previously published figures.
(2) Due to the effects of rounding some totals will not equal the sum of their parts.
(3) The figures reported for 2020/21 refer to attendance during the periods in which schools were open to all pupils.
Looked after children had a lower attendance rate than all pupils in all school sectors (Table 3.1). This difference is smallest for primary schools, with the attendance rate for pupils looked after within the year and all pupils being 91.9% and 94.0% respectively in 2020/21.
For special schools, the attendance rate for pupils looked after within the year was 86.8%, while the rate for all pupils was 89.3%.
In secondary schools, the difference in attendance rate between looked after children and all pupils was greater than in primary schools and special schools. Pupils looked after within the year had an attendance rate of 83.4%, compared with a rate of 89.1% for all pupils. However, the gap in attendance rates between looked after pupils and all pupils in secondary schools had narrowed to 5.7 percentage points in 2020/21 (from 9.7 percentage points in 2018/19).
Placement type and sex
Table 3.2 shows the attendance rates for pupils looked after within the year by their type of placement and sex. For this table figures are shown for the period in which schools were open to all pupils, as well as when schools were closed for most pupils due to COVID-19 restrictions but home learning was available. When schools were open, the highest attendance rates were for young people in 'other community' placements (including those with prospective adopters) and in a foster care placement, both provided by and purchased by local authorities. The attendance rates of 95.3%, 95.0% and 95.1% respectively for these pupils were higher than the rate for all pupils (92.0%). When schools were open, pupils looked after at home with their parents (78.0%) had the lowest attendance rates.
When schools were closed there was less variation in attendance rates (for home learning), with all accommodation types having had at least 95.6% attendance. When schools were closed, the highest attendance rates were for young people in 'other community' placements (including those with prospective adopters) and in a foster care placement, both provided by and purchased by local authorities. The attendance rates of 99.7%, 99.4% and 95.5% respectively for these pupils was similar to the rate for all pupils (99.4%). When schools were closed, pupils in voluntary homes (95.6%) had the lowest attendance rates. However, as noted above, there was an under-reporting of absence when schools were closed. Therefore attendance rates reported for 'Schools Closed (Home Learning)' will be higher than the actual attendance rates, and any variation between groups could be reflective of differences in the recording of attendance as opposed to variation in attendance itself.
There was very little difference in attendance by sex. When schools were open, female pupils who were looked after within the year had a slightly higher attendance rate than male pupils looked after within the year, with an attendance rate of 88.2% compared with 87.6%. For pupils looked after in all residential accommodation placement types, however, males had a higher rate of attendance.
| Schools open | Schools Closed (Home Learning) (1) | |||||
|---|---|---|---|---|---|---|
| Accommodation type | Female | Male | Total | Female | Male | Total |
| In the community (children with one placement) | ||||||
| At home with parents | 78.3 | 77.7 | 78.0 | 97.4 | 97.5 | 97.5 |
| With friends or relatives | 90.0 | 89.4 | 89.7 | 99.2 | 98.7 | 99.0 |
| With foster carers provided by LA | 95.0 | 95.0 | 95.0 | 99.4 | 99.3 | 99.4 |
| With foster carers purchased by LA | 95.5 | 94.9 | 95.1 | 99.5 | 99.6 | 99.5 |
| In other community(2) | 95.3 | 95.3 | 95.3 | 99.8 | 99.6 | 99.7 |
| Residential Accommodation (children with one placement) | ||||||
| In local authority home | 84.2 | 87.6 | 86.3 | 97.8 | 97.7 | 97.7 |
| In voluntary home | 84.1 | 87.6 | 86.8 | 98.9 | 94.3 | 95.6 |
| In other residential(3) | 87.9 | 88.9 | 88.5 | 99.0 | 99.1 | 99.0 |
| More than one placement | 87.9 | 87.2 | 87.5 | 97.8 | 98.4 | 98.1 |
| All looked after within the last year | 88.2 | 87.6 | 87.9 | 98.7 | 98.5 | 98.6 |
| All Pupils | 92.0 | 92.1 | 92.0 | 99.4 | 99.4 | 99.4 |
(1) Refers to the period during the COVID-19 pandemic in which schools were closed for most pupils and home learning was commenced.
(2) Includes 'with prospective adopters'.
(3) Includes 'in residential school', 'in secure care accommodation', and 'crisis care'.
Number of placements
It should be noted that the majority of pupils looked after within the last year had only one placement (83.2% in 2020/21) . Pupils looked after within the year who experienced one or two placements had higher rates of attendance than pupils with three or more placements (Table 3.3). This pattern was similar for both male and female pupils. Attendance rates were highest among pupils with two placements (88.4%) and one placement (87.9%) and lowest for those with five or more placements (77.0%).
| Number of placements | Female | Male | Total |
|---|---|---|---|
| 1 | 88.2 | 87.7 | 87.9 |
| 2 | 89.1 | 87.8 | 88.4 |
| 3 | 84.9 | 85.1 | 85.0 |
| 4 | 82.7 | 86.4 | 84.4 |
| 5 or more | 76.9 | 77.2 | 77.0 |
| All looked after within the last year | 88.2 | 87.6 | 87.9 |
Contact
Email: children.statistics@gov.scot