We use cookies to collect anonymous data to help us improve your site browsing
experience.
Click 'Accept all cookies' to agree to all cookies that collect anonymous data.
To only allow the cookies that make the site work, click 'Use essential cookies only.' Visit 'Set cookie preferences' to control specific cookies.
7.1 Promotions' contribution to discretionary food products sales
7.1 The total expenditure (E) for discretionary category i for year t was estimated as:
7.2 Where the indices k=1,2,3,4 and 5 indicate full price, temporary price reduction, multi-buy, Y for £X and other promotions is the weight assigned to the purchase and E is the expenditure, j index represents the product and n1, n2, n3, n4 and n5 are the number of products belonging to category i, purchased under full price and each promotion type.
7.3 The above computation allowed us to compute the growth rate on the purchases (or sales) by discretionary food categories during the period 2013 to 2018 and also the importance (i.e., share) of each promotion in the total category sales.
7.4 The next step was to compute the contribution to the annual sales growth () on the expenditure category by full price sales and each type of promotion. This is presented in (3):
7.5 Where the symbol '^' indicates growth rate.
7.2 Demand models
Inter-category model
7.6 The addressed questions were how sensitive the purchase of food and drink discretionary categories are to the banning of advertising their price promotions. In addition, which foods act as substitutes for the discretionary foods and what the impact is in calorific and nutritional terms from the restricted products.
7.7 The method follows Dreze et al. (2004), who modified the share equations of Deaton and Muellbauer's Almost Ideal Demand System (AIDS) consumer demand model (Deaton and Muellbauer, 1980) including indicators of promotions.
7.8 For the analysis, the expenditure, price, and promotion for each category were computed for each household. Category prices and promotions were computed as weighted-averages of the individual products purchased by the households (h). These were computed as follows:
7.9 The weights associated with product s, , will be calculated as follow:
7.10 The model comprised the estimation of the shares of consumers' budget spent on category g in time t (Wgt) given by (5):
7.11 where is the expenditure share allocated to category g by household h, are the prices encountered by household h for each of the n categories (j=1..n), is the expenditure of household h and is a price index. The fact that the information is calculated at the level of the household partially reduced the quality problems brought by aggregation.
7.12 The price index was approximated by the Stone price index (i.e. ), making the budget share equation to be linear in the parameters. The system (5) was estimated by iterative seemingly unrelated regressions and imposing constraints related to adding up, homogeneity and symmetry (6)[7]:
7.13 For the analysis, the expenditure, prices, and promotions variables for each category were computed. As mentioned, the model comprises the estimation of the shares of households' budget spent on category g in time t (), given by:
7.14 The procedure estimates the change in the households' budget shares on category g in time t () when the advertising of promotions have been set equal to zero (i.e., . Since the income and the prices are kept constant, for any group, the nutritional changes for nutrient i, for food category g, due to the measures were evaluated at the means of the variables using the following formula (7):
7.15 Where D is the number of discretionary categories, is the average promotion for food category j, is the average expenditure for the group, is the average price of category g and is nutrient i coefficient (e.g., saturates per 100 grams) of category g. Note that promotions for products that are not discretionary are still in place.
Substitution towards non-discretionary food and drink
7.16 The purpose of this analysis is to investigate the effects on purchases of other food and drink products that happen due to changes of purchased of discretionary products following promotion restriction. In this context, the interest is whether there would be a potential reallocation of money to other food products with an impact on the purchase of nutrients.
7.17 This was investigated using the inter-category demand model results, which provided estimates of the change in quantities and nutrition of other products when the advertising of price promotions is banned. The analysis assumed that the promotions of other food and drink products remained the same (i.e., their advertising is not banned).
Intra-category models
7.18 The purpose of this part of the work was to analyse how sensitive the purchases of discretionary products are to changes in prices and the advertising of promotions within their category. This follows the assumption that product substitution may occur within the product category (i.e., within the discretionary products) and this may bring changes in terms of nutrients.
7.19 In terms of methods, these were the same as those used for inter-category models but considering the new groups and without disaggregating the expenditure on other food and drink or non-food categories. Note that because of the different composition of the model, the results will not be the same as the inter-category results and the focus is on purchasing changes within the discretionary groups.
7.3 Choice experiment
7.20 In the choice experiment, the effect of restricting the promotion of price discounts is assessed by comparing the changes across treatments of the number of chosen units of the three considered discretionary products as well as consumers' WTP. For each product, nine alternatives were considered in the choice experiment (for example chocolate with low fat and low sugar, low fat and moderate sugar, moderate fat and low sugar, moderate fat and moderate sugar, high fat and low sugar, high fat and moderate sugar, low fat and high sugar, moderate fat and high sugar, high fat and high sugar).
7.21 To ease the presentation the nine alternatives of each discretionary product they were grouped in two categories: healthy (e.g., chocolate with low fat and low sugar, low fat and moderate sugar, moderate fat and low sugar, and moderate fat and moderate sugar) and less healthy (e.g., chocolate with high fat and low sugar, high fat and moderate sugar, low fat and high sugar, moderate fat and high sugar, high fat and high sugar).
7.22 The analyses consisted of descriptive analysis and econometric analysis. In the descriptive analysis, the number of chosen units of the healthy and less healthy alternatives of chocolate, biscuits, and crisps in each treatment was computed. Consumers' attitudes and their purchasing habits were also explored.
7.23 The econometric analysis was used to estimate consumers' WTP for the alternatives of discretionary products considered in the choice experiment. Due to the nature of choice analysis, the estimated WTP is the price premium that consumers are willing to pay for the alternative of interest (i.e., alternative with low fat and low sugar, low fat and moderate sugar, moderate fat and low sugar, moderate fat and moderate sugar, high fat and low sugar, high fat and moderate sugar, low fat and high sugar, moderate fat and high sugar, high fat and high sugar) relative to the alternative that is high in fat and high in sugar/salt.
7.24 Consumers' WTP for the categories healthy/less healthy was computed as the mean of consumers' WTP for the alternatives classified in that category. For example, consumers' WTP for healthy biscuits is calculated as the sum of their WTP for the healthier biscuit alternatives (i.e., low fat and low sugar, low fat and moderate sugar, moderate fat and low sugar, and moderate fat and moderate sugar) divided by four. Consumers' WTP for less healthy biscuits is calculated as the sum of their WTP for the less healthy biscuit alternatives (i.e., high fat and low sugar, high fat and moderate sugar, low fat and high sugar, and moderate fat and high sugar) divided by four.
7.25 To estimate consumers' preferences and WTP for the different alternatives of the food products considered in this study, the random parameter logit model (RPL) was used.
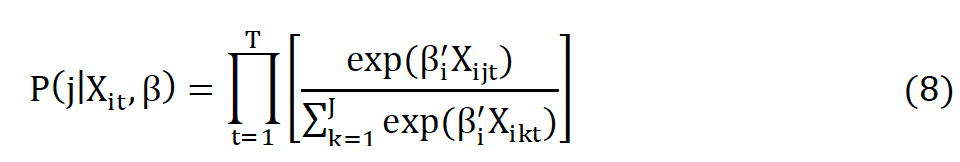
7.26 Train (1998) proposed the RPL to allow individuals' preferences to be heterogeneous and the assumption of the Independence of Irrelevant Alternatives to be relaxed, which limited previous choice models (e.g., conditional logit). In the RPL, at least some of the parameters are specified as random. In other words, each individual is considered to have a unique set of preferences, reflected in the individual parameters β_i. In the RPL, the conditional choice probability that individual i choose an alternative j at a choice occasion t is specified as in (8):
7.27 where β denotes the K×1 vector of unknown utility parameters that are associated with the product attributes X_ijt. All the parameters associated with the non-price attributes (e.g., brand, nutrition) were assumed random and normally distributed. The parameter associated with price attribute was specified as random and log normally distributed to avoid obtaining unrealistic positive values for the price parameter.
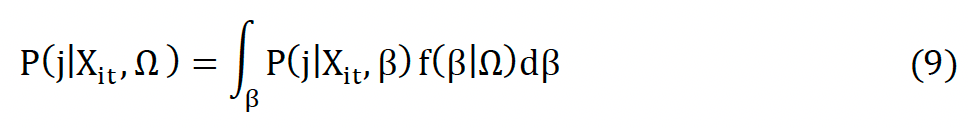
7.28 The unconditional choice probability (9) is the expected value of the logit probability (i.e., expression (8)) integrated over all possible values of and weighted by the density of (i.e., f(β|Ω))
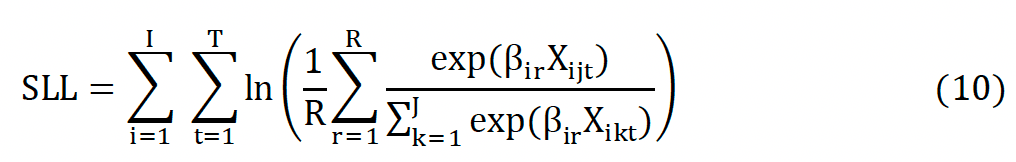
7.29 Since the unconditional choice probability does not have a closed form solution, it is therefore approximated through simulation methods. In particular, R draws of β_ir were taken from the distribution f(β|Ω). For each draw, the choice probability was calculated. Then the resulting probabilities from the R draws were averaged. The simulated log-likelihood (SLL) for all respondents is given by (10):
7.30 In addition to the estimation of respondents' choice probabilities and preferences (i.e., marginal utilities), the results from the estimation of the RPL were used to compute respondents' willingness to pay for all the alternatives of the three discretionary foods as well as their healthier counterparts. Respondents' willingness to pay (11) was expressed as the negative ratio of the non-price attribute coefficient to the price coefficient:
7.31 The effect of banning advertising price promotions was then assessed by comparing the changes in respondents' choices and WTP. In particular, the effect of the price discount was assessed comparing the results obtained in treatment 1 and 2. The effect of advertising only the price discount on the healthy products was investigated comparing the results in treatment 2 and 3. Finally, the effect of advertising the price discount on both healthy and less healthy alternatives was analysed comparing the result in treatment 2 and 4.
7.4 Market shares by category
Table A1: Sales at full price and promotion by discretionary foods
Years
2013
2014
2015
2016
2017
2018
Take home confectionery
Full price
51.6
52.2
52.3
54.1
58.1
59.0
Temporary price reduction
36.9
37.1
38.0
36.2
33.2
32.9
Multibuy
0.9
1.0
0.4
0.6
0.3
0.3
Y for £X
9.8
9.1
8.8
8.6
8.1
7.7
Other promotions
0.7
0.5
0.5
0.5
0.3
0.2
Biscuits
Full price
56.5
54.2
51.7
55.2
59.7
60.5
Temporary price reduction
35.7
35.2
36.3
37.1
35.3
34.0
Multibuy
1.4
0.5
0.4
0.1
0.2
0.9
Y for £X
5.4
9.2
10.8
6.7
4.0
4.2
Other promotions
1.0
1.0
0.8
0.9
0.8
0.5
Take home savouries
Full price
48.8
47.4
48.9
48.3
52.8
54.2
Temporary price reduction
29.1
31.0
35.5
38.6
35.9
35.2
Multibuy
3.7
3.6
0.9
0.4
0.2
0.0
Y for £X
17.4
17.1
14.3
11.9
10.3
9.9
Other promotions
1.0
0.9
0.4
0.8
0.9
0.6
Ambient cakes and pastries
Full price
71.6
71.6
71.0
73.2
75.2
77.1
Temporary price reduction
15.5
15.4
18.5
19.0
18.0
16.4
Multibuy
0.4
0.6
0.2
0.3
0.3
0.3
Y for £X
12.0
11.9
10.1
7.3
6.4
6.0
Other promotions
0.5
0.5
0.2
0.2
0.1
0.1
Total puddings and desserts
Full price
57.5
56.4
56.4
57.7
61.0
62.8
Temporary price reduction
21.2
22.7
24.3
25.3
22.4
24.6
Multibuy
2.3
1.1
0.6
0.9
1.8
1.4
Y for £X
15.2
15.8
14.2
11.0
9.3
8.5
Other promotions
3.7
4.0
4.5
5.1
5.5
2.6
Regular soft drinks
Full price
46.8
46.5
45.6
47.6
53.3
57.6
Temporary price reduction
26.0
25.6
27.2
30.2
31.4
30.0
Multibuy
4.4
2.7
1.9
0.2
0.1
0.0
Y for £X
21.4
23.6
24.1
20.6
13.8
11.0
Other promotions
1.3
1.5
1.1
1.4
1.4
1.3
Edible ices and ice cream
Full price
52.3
54.7
52.3
53.6
53.5
52.6
Temporary price reduction
33.2
29.9
33.0
36.0
35.4
33.8
Multibuy
0.1
0.4
0.1
0.1
0.0
0.1
Y for £X
13.6
14.2
12.7
8.4
9.5
12.3
Other promotions
0.8
0.8
1.9
1.9
1.5
1.2
Source: Own elaboration based on Kantar Worldpanel data.
Table A2: Market shares - All categories
Years
2013
2014
2015
2016
2017
2018
Total (%)
100.00
100.00
100.00
100.00
100.00
100.00
Take home confectionery
6.40
6.10
5.60
5.24
4.86
4.57
Full price
3.30
3.19
2.93
2.84
2.82
2.70
Under promotions
3.10
2.91
2.67
2.41
2.04
1.87
Biscuits
4.59
4.25
3.81
3.40
3.12
2.83
Full price
2.59
2.30
1.97
1.88
1.86
1.71
Under promotions
2.00
1.95
1.84
1.52
1.26
1.12
Take home savouries
3.80
3.62
3.35
2.96
2.65
2.61
Full price
1.86
1.72
1.64
1.43
1.40
1.42
Under promotions
1.95
1.90
1.71
1.53
1.25
1.20
Cakes, pastries, and sugar morning goods
6.14
5.68
5.36
4.87
4.36
4.07
Full price
4.39
4.07
3.80
3.56
3.28
3.13
Under promotions
1.74
1.61
1.56
1.30
1.08
0.93
Total puddings and desserts
1.92
1.84
1.73
1.56
1.38
1.22
Full price
1.10
1.04
0.97
0.90
0.84
0.77
Under promotions
0.81
0.80
0.75
0.66
0.54
0.46
Take home sugary drinks
4.11
3.81
3.25
2.97
2.68
2.50
Full price
2.17
2.01
1.69
1.59
1.58
1.56
Under promotions
1.93
1.80
1.55
1.38
1.11
0.95
Edible ices and ice creams
1.52
1.50
1.36
1.25
1.13
1.12
Full price
0.79
0.82
0.71
0.67
0.61
0.59
Under promotions
0.72
0.68
0.65
0.58
0.53
0.53
Dairy products
9.07
8.99
9.26
9.09
8.76
8.54
Full price
6.10
5.77
5.94
6.25
6.13
6.08
Under promotions
2.97
3.22
3.33
2.83
2.63
2.46
Meat and fish
12.07
12.52
12.75
13.50
14.63
14.91
Full price
8.15
8.49
8.59
9.11
10.32
10.61
Under promotions
3.92
4.03
4.17
4.39
4.31
4.30
Fats and eggs
3.48
3.44
3.26
3.05
2.93
2.87
Full price
2.18
2.03
1.87
1.79
1.96
1.93
Under promotions
1.30
1.42
1.39
1.26
0.98
0.94
Fruit
4.27
4.38
4.88
5.81
6.52
6.42
Full price
3.25
3.27
3.54
4.18
4.50
4.44
Under promotions
1.02
1.10
1.34
1.63
2.02
1.97
Vegetables
6.00
5.71
5.85
5.89
6.14
6.06
Full price
4.68
4.06
4.35
4.31
4.67
4.70
Under promotions
1.32
1.64
1.49
1.58
1.47
1.36
Grains
5.54
5.78
5.57
5.31
5.13
4.94
Full price
3.87
3.91
3.73
3.67
3.74
3.64
Under promotions
1.67
1.87
1.84
1.63
1.39
1.30
Prepared ready to eat foods
7.73
8.64
9.90
10.87
11.80
12.39
Full price
4.30
4.84
5.56
6.38
7.27
7.76
Under promotions
3.43
3.80
4.34
4.48
4.54
4.63
Sugar and preserves
1.54
1.50
1.44
1.46
1.52
1.49
Full price
1.21
1.12
1.03
1.10
1.15
1.14
Under promotions
0.33
0.38
0.41
0.36
0.37
0.35
Condiments and sauces
2.13
2.18
2.21
2.13
2.07
2.06
Full price
1.31
1.33
1.37
1.37
1.35
1.38
Under promotions
0.82
0.85
0.84
0.76
0.71
0.68
Low calorie, soft drinks and juices
5.55
5.33
5.35
5.22
5.19
5.32
Full price
2.34
2.25
2.28
2.37
2.58
2.86
Under promotions
3.21
3.08
3.07
2.85
2.61
2.46
Alcoholic beverages
14.15
14.75
15.08
15.43
15.11
16.08
Full price
8.24
8.54
8.50
8.96
9.47
11.60
Under promotions
5.91
6.21
6.58
6.47
5.64
4.48
Table A3: Market shares - Take home confectionery
Years
2013
2014
2015
2016
2017
2018
Total (%)
100.00
100.00
100.00
100.00
100.00
100.00
Take home confectionery
6.40
6.10
5.60
5.24
4.86
4.57
Full price
3.30
3.19
2.93
2.84
2.82
2.70
Under promotions
3.10
2.91
2.67
2.41
2.04
1.87
Biscuits
4.59
4.25
3.81
3.40
3.12
2.83
Full price
2.59
2.30
1.97
1.88
1.86
1.71
Under promotions
2.00
1.95
1.84
1.52
1.26
1.12
Take home savouries
3.80
3.62
3.35
2.96
2.65
2.61
Full price
1.86
1.72
1.64
1.43
1.40
1.42
Under promotions
1.95
1.90
1.71
1.53
1.25
1.20
Cakes, pastries, and sugar morning goods
6.14
5.68
5.36
4.87
4.36
4.07
Full price
4.39
4.07
3.80
3.56
3.28
3.13
Under promotions
1.74
1.61
1.56
1.30
1.08
0.93
Total puddings and desserts
1.92
1.84
1.73
1.56
1.38
1.22
Full price
1.10
1.04
0.97
0.90
0.84
0.77
Under promotions
0.81
0.80
0.75
0.66
0.54
0.46
Take home sugary drinks
4.11
3.81
3.25
2.97
2.68
2.50
Full price
2.17
2.01
1.69
1.59
1.58
1.56
Under promotions
1.93
1.80
1.55
1.38
1.11
0.95
Edible ices and ice creams
1.52
1.50
1.36
1.25
1.13
1.12
Full price
0.79
0.82
0.71
0.67
0.61
0.59
Under promotions
0.72
0.68
0.65
0.58
0.53
0.53
Dairy products
9.07
8.99
9.26
9.09
8.76
8.54
Full price
6.10
5.77
5.94
6.25
6.13
6.08
Under promotions
2.97
3.22
3.33
2.83
2.63
2.46
Meat and fish
12.07
12.52
12.75
13.50
14.63
14.91
Full price
8.15
8.49
8.59
9.11
10.32
10.61
Under promotions
3.92
4.03
4.17
4.39
4.31
4.30
Fats and eggs
3.48
3.44
3.26
3.05
2.93
2.87
Full price
2.18
2.03
1.87
1.79
1.96
1.93
Under promotions
1.30
1.42
1.39
1.26
0.98
0.94
Fruit
4.27
4.38
4.88
5.81
6.52
6.42
Full price
3.25
3.27
3.54
4.18
4.50
4.44
Under promotions
1.02
1.10
1.34
1.63
2.02
1.97
Vegetables
6.00
5.71
5.85
5.89
6.14
6.06
Full price
4.68
4.06
4.35
4.31
4.67
4.70
Under promotions
1.32
1.64
1.49
1.58
1.47
1.36
Grains
5.54
5.78
5.57
5.31
5.13
4.94
Full price
3.87
3.91
3.73
3.67
3.74
3.64
Under promotions
1.67
1.87
1.84
1.63
1.39
1.30
Prepared ready to eat foods
7.73
8.64
9.90
10.87
11.80
12.39
Full price
4.30
4.84
5.56
6.38
7.27
7.76
Under promotions
3.43
3.80
4.34
4.48
4.54
4.63
Sugar and preserves
1.54
1.50
1.44
1.46
1.52
1.49
Full price
1.21
1.12
1.03
1.10
1.15
1.14
Under promotions
0.33
0.38
0.41
0.36
0.37
0.35
Condiments and sauces
2.13
2.18
2.21
2.13
2.07
2.06
Full price
1.31
1.33
1.37
1.37
1.35
1.38
Under promotions
0.82
0.85
0.84
0.76
0.71
0.68
Low calorie, soft drinks and juices
5.55
5.33
5.35
5.22
5.19
5.32
Full price
2.34
2.25
2.28
2.37
2.58
2.86
Under promotions
3.21
3.08
3.07
2.85
2.61
2.46
Alcoholic beverages
14.15
14.75
15.08
15.43
15.11
16.08
Full price
8.24
8.54
8.50
8.96
9.47
11.60
Under promotions
5.91
6.21
6.58
6.47
5.64
4.48
Table A4: Market shares - Biscuits
Years
2013
2014
2015
2016
2017
2018
Total (%)
100.00
100.00
100.00
100.00
100.00
100.00
Cereal and fruit bars
10.72
10.75
11.46
10.42
10.25
11.42
Full price
4.91
4.63
5.03
4.73
5.01
6.00
Under promotions
5.81
6.12
6.43
5.69
5.23
5.43
Chocolate biscuit bars and children biscuits
25.08
23.69
23.46
22.93
22.66
22.12
Full price
11.90
10.96
10.24
10.95
12.81
13.18
Under promotions
13.18
12.73
13.22
11.99
9.85
8.95
Everyday biscuits and treats
28.22
28.94
29.00
29.14
29.32
29.13
Full price
18.30
17.46
16.40
17.99
19.15
18.97
Under promotions
9.93
11.48
12.60
11.16
10.18
10.15
Crackers and crispbreads
14.08
14.71
14.53
14.43
13.94
13.39
Full price
10.42
10.53
10.25
10.35
10.35
10.16
Under promotions
3.66
4.18
4.28
4.09
3.59
3.24
Special treats and seasonal biscuits
13.32
13.81
14.36
15.83
16.30
16.40
Full price
6.78
6.80
6.71
8.11
8.34
7.83
Under promotions
6.53
7.01
7.65
7.72
7.96
8.57
Healthier biscuits
8.59
8.10
7.19
7.24
7.53
7.53
Full price
4.18
3.82
3.08
3.06
4.04
4.32
Under promotions
4.40
4.28
4.12
4.18
3.49
3.21
Table A5: Market shares - Take home savouries
Years
2013
2014
2015
2016
2017
2018
Total (%)
100.00
100.00
100.00
100.00
100.00
100.00
Crisps
49.33
48.20
46.55
44.96
44.16
43.10
Private label
9.08
9.30
9.87
9.98
10.50
9.90
Full price
5.90
6.59
7.00
6.75
7.27
7.24
Under promotions
3.18
2.71
2.86
3.23
3.23
2.66
Branded
40.25
38.90
36.68
34.97
33.66
33.20
Full price
15.82
14.40
13.64
12.25
13.13
13.84
Under promotions
24.43
24.50
23.04
22.72
20.54
19.36
Savoury snacks
39.31
39.79
40.07
41.12
41.62
42.84
Private label
8.17
7.88
8.13
8.64
8.91
9.42
Full price
6.50
6.40
7.03
7.24
7.78
8.27
Under promotions
1.67
1.48
1.11
1.39
1.12
1.15
Branded
31.13
31.91
31.93
32.48
32.72
33.43
Full price
12.12
10.99
11.36
12.16
14.01
13.93
Under promotions
19.01
20.92
20.57
20.32
18.70
19.49
Nuts
8.62
8.79
9.42
9.32
9.71
9.83
Full price
6.48
6.77
7.25
7.09
7.68
7.73
Under promotions
2.14
2.02
2.17
2.23
2.04
2.09
Popcorn
2.74
3.22
3.97
4.60
4.50
4.23
Full price
1.97
2.29
2.62
2.83
2.92
3.22
Under promotions
0.77
0.93
1.35
1.77
1.58
1.01
Table A6: Market shares - Cakes, pastries and higher fats and sugar morning goods
Years
2013
2014
2015
2016
2017
2018
Total (%)
100.00
100.00
100.00
100.00
100.00
100.00
Cakes
21.21
22.00
22.37
22.40
22.86
23.36
Private label
12.88
13.23
13.77
14.18
14.74
14.72
Full price
9.82
9.97
10.40
10.56
11.44
11.12
Under promotions
3.05
3.26
3.37
3.62
3.29
3.59
Branded
8.33
8.77
8.60
8.23
8.12
8.65
Full price
4.73
5.20
4.95
4.92
4.98
5.50
Under promotions
3.61
3.58
3.65
3.31
3.14
3.14
Pastries
19.41
18.33
18.28
18.37
18.55
18.82
Private label
13.59
12.89
12.95
13.43
12.83
12.43
Full price
9.90
9.67
9.57
10.10
9.69
9.94
Under promotions
3.69
3.22
3.38
3.33
3.13
2.49
Branded
5.81
5.43
5.33
4.94
5.73
6.39
Full price
3.29
3.15
2.86
2.63
2.92
3.48
Under promotions
2.52
2.28
2.47
2.31
2.81
2.91
Morning goods
59.38
59.67
59.36
59.23
58.59
57.81
Private label
39.97
38.87
39.13
39.06
38.33
37.58
Full price
30.44
29.83
30.27
30.99
32.11
32.34
Under promotions
9.54
9.04
8.85
8.07
6.22
5.24
Branded
19.41
20.81
20.23
20.16
20.26
20.23
Full price
13.41
13.79
12.91
14.01
14.02
14.67
Under promotions
5.99
7.01
7.32
6.16
6.24
5.56
Table A7: Market shares - Total puddings and desserts
Years
2013
2014
2015
2016
2017
2018
Total (%)
100.00
100.00
100.00
100.00
100.00
100.00
Ambient bakery products, canned goods and frozen confectionery
11.18
10.60
10.79
9.25
8.99
8.56
Full price
7.21
6.56
6.88
6.08
6.24
5.75
Under promotions
3.97
4.04
3.92
3.17
2.75
2.81
Sweet home cooking
22.25
21.99
20.81
20.90
20.69
20.23
Full price
13.13
12.97
12.39
13.34
14.25
14.23
Under promotions
9.12
9.03
8.42
7.56
6.44
6.00
Chilled convenience
58.15
59.19
61.12
63.15
64.02
64.08
Private label
36.36
37.23
38.45
40.15
42.95
42.24
Full price
24.56
25.38
25.19
26.49
27.44
28.40
Under promotions
11.80
11.85
13.26
13.66
15.51
13.83
Branded
21.78
21.96
22.67
23.00
21.07
21.85
Full price
7.51
6.81
7.76
7.58
8.50
9.26
Under promotions
14.28
15.15
14.91
15.42
12.57
12.59
Products with healthy claims
8.43
8.22
7.28
6.70
6.30
7.13
Full price
5.08
4.64
4.16
4.21
4.59
5.14
Under promotions
3.35
3.57
3.12
2.49
1.71
2.00
Table A8: Market shares - Take home drinks
Years
2013
2014
2015
2016
2017
2018
Total (%)
100.00
100.00
100.00
100.00
100.00
100.00
Mineral water
7.61
8.91
9.02
9.44
9.06
8.41
Full price
5.16
6.09
5.95
6.23
6.35
5.92
Under promotions
2.46
2.82
3.06
3.21
2.72
2.49
Soft drinks
34.52
33.47
32.33
32.43
33.09
31.71
Full price
15.77
15.24
14.93
15.35
17.39
17.59
Under promotions
18.75
18.24
17.40
17.08
15.70
14.12
Juices
8.73
8.20
7.65
6.48
6.19
5.45
Full price
6.00
5.42
4.63
4.00
4.60
4.72
Under promotions
2.73
2.78
3.02
2.49
1.58
0.73
Other drinks
7.04
7.07
6.15
5.71
5.81
5.19
Full price
3.71
3.64
3.27
3.30
3.45
3.34
Under promotions
3.33
3.43
2.89
2.41
2.36
1.85
Drinks with healthy claims
42.10
42.35
44.85
45.94
45.85
49.24
Full price
16.21
16.15
16.84
18.73
21.51
26.06
Under promotions
25.89
26.20
28.01
27.21
24.34
23.18
Table A9: Market shares - Edible ices and ice cream
Years
2013
2014
2015
2016
2017
2018
Total (%)
100.00
100.00
100.00
100.00
100.00
100.00
Premium ice creams
32.32
31.21
33.07
33.84
33.40
32.09
Private label
7.65
8.13
8.55
8.54
8.81
8.31
Full price
4.04
4.80
5.90
5.70
6.21
5.82
Under promotions
3.61
3.33
2.64
2.84
2.59
2.49
Branded
24.67
23.09
24.52
25.30
24.59
23.79
Full price
10.00
9.91
9.43
9.48
10.28
9.21
Under promotions
14.67
13.17
15.10
15.82
14.31
14.58
Lollies
31.95
33.44
33.37
35.36
38.63
39.80
Private label
10.68
10.81
10.25
10.83
12.04
12.93
Full price
8.09
8.58
8.05
9.72
10.66
11.19
Under promotions
2.59
2.23
2.20
1.11
1.39
1.75
Branded
21.27
22.63
23.12
24.53
26.59
26.87
Full price
6.06
7.72
6.23
7.19
6.54
6.90
Under promotions
15.21
14.91
16.89
17.34
20.05
19.97
Other ice cream
30.06
29.63
27.90
25.85
24.03
24.98
Private label
15.11
16.39
15.04
14.10
12.83
13.41
Full price
13.32
14.03
13.05
12.21
11.18
11.75
Under promotions
1.79
2.37
1.99
1.90
1.65
1.66
Branded
14.95
13.24
12.85
11.75
11.20
11.57
Full price
6.67
5.80
5.62
5.54
5.42
5.43
Under promotions
8.28
7.44
7.23
6.21
5.79
6.14
Frozen confectionary
5.68
5.71
5.66
4.95
3.94
3.12
Full price
4.15
3.90
4.07
3.71
3.24
2.35
Under promotions
1.53
1.81
1.60
1.23
0.70
0.78
7.5 Tables with detailed results
7.5.1 Complete sample (net results)
Table A10: Policy simulation - by
SIMD (Changes are in per capita per week terms)
Group
Category
Discretionary foods
Other foods and drinks
Total
Take home confectionery
Biscuits
Take home savouries
Cakes pastries and sugar morning goods
Total puddings and desserts
Take home sugary drinks
Edible ices and ice cream
Total
SIMD 1
△ in share
-0.011
-0.006
-0.005
-0.001
-0.003
-0.010
-0.003
-0.039
0.038
-0.002
△ in expenditure (£)
-0.281
-0.158
-0.135
-0.035
-0.072
-0.251
-0.086
-1.019
0.971
-0.047
△ in quantity (Kg)
-0.105
-0.029
-0.017
-0.027
-0.014
-0.233
-0.025
-0.451
0.205
-0.246
△ in energy (kcal)
-484.278
-134.022
-89.496
-49.712
-29.672
-66.280
-53.114
-906.574
374.420
-532.154
△ in protein(g)
-5.133
-1.833
-1.278
-1.234
-0.453
-0.339
-0.659
-10.929
13.969
3.040
△ in carbohydrate(g)
-68.967
-18.422
-9.356
-7.801
-3.992
-15.506
-6.324
-130.368
23.007
-107.361
△ in sugar(g)
-56.409
-8.689
-0.770
-2.612
-2.864
-14.474
-5.276
-91.094
8.854
-82.241
△ in fat(g)
-21.205
-5.698
-5.081
-1.604
-1.286
-0.116
-2.750
-37.741
22.318
-15.423
△ in saturates(g)
-12.347
-2.847
-0.577
-0.624
-0.762
-0.056
-1.885
-19.098
8.897
-10.201
△ in fibre(g)
-1.528
-0.984
-0.705
-0.450
-0.119
-0.154
-0.142
-4.082
2.481
-1.601
△ in sodium(g)
-0.107
-0.074
-0.108
-0.043
-0.013
-0.021
-0.013
-0.379
0.491
0.112
SIMD 2
△ in share
-0.010
-0.008
-0.004
-0.005
-0.003
-0.006
-0.004
-0.039
0.042
0.002
△ in expenditure (£)
-0.270
-0.219
-0.113
-0.127
-0.082
-0.171
-0.107
-1.088
1.152
0.064
△ in quantity (Kg)
-0.088
-0.038
-0.014
-0.094
-0.015
-0.156
-0.031
-0.437
0.232
-0.205
△ in energy (kcal)
-412.075
-177.817
-74.068
-176.716
-30.322
-44.852
-64.202
-980.051
338.030
-642.021
△ in protein(g)
-4.314
-2.456
-1.109
-4.467
-0.463
-0.196
-0.808
-13.814
7.940
-5.875
△ in carbohydrate(g)
-57.653
-24.469
-7.549
-27.845
-4.255
-10.475
-7.741
-139.987
23.160
-116.827
△ in sugar(g)
-47.419
-11.676
-0.601
-9.230
-3.066
-9.921
-6.450
-88.363
9.977
-78.386
△ in fat(g)
-18.425
-7.501
-4.262
-5.616
-1.239
-0.072
-3.283
-40.399
17.181
-23.218
△ in saturates(g)
-10.812
-3.800
-0.487
-2.113
-0.721
-0.028
-2.234
-20.195
6.798
-13.397
△ in fibre(g)
-1.426
-1.431
-0.603
-1.608
-0.133
-0.108
-0.187
-5.495
3.211
-2.284
△ in sodium(g)
-0.090
-0.098
-0.086
-0.157
-0.013
-0.014
-0.017
-0.476
0.322
-0.154
SIMD 3
△ in share
-0.008
-0.006
-0.005
-0.006
-0.004
-0.008
-0.003
-0.040
0.036
-0.005
△ in expenditure (£)
-0.214
-0.178
-0.148
-0.159
-0.103
-0.219
-0.095
-1.114
0.987
-0.128
△ in quantity (Kg)
-0.068
-0.030
-0.019
-0.115
-0.019
-0.190
-0.028
-0.470
0.185
-0.285
△ in energy (kcal)
-324.424
-142.497
-96.067
-215.381
-40.646
-56.498
-58.696
-934.209
297.199
-637.010
△ in protein(g)
-3.524
-1.940
-1.487
-4.909
-0.623
-0.214
-0.757
-13.455
5.094
-8.361
△ in carbohydrate(g)
-44.089
-19.545
-9.798
-33.594
-5.494
-13.316
-6.993
-132.829
19.287
-113.542
△ in sugar(g)
-36.938
-9.214
-0.788
-11.752
-3.857
-12.778
-5.908
-81.235
8.878
-72.357
△ in fat(g)
-14.928
-6.082
-5.501
-7.019
-1.768
-0.065
-3.036
-38.399
16.630
-21.770
△ in saturates(g)
-8.704
-3.067
-0.632
-2.705
-1.029
-0.025
-2.064
-18.226
6.283
-11.943
△ in fibre(g)
-1.096
-1.071
-0.789
-1.894
-0.169
-0.139
-0.156
-5.314
2.633
-2.681
△ in sodium(g)
-0.069
-0.080
-0.114
-0.182
-0.017
-0.019
-0.017
-0.499
0.264
-0.234
Table A11: Policy simulation - by
SIMD (cont.) (Changes are in per capita per week terms)
Group
Category
Discretionary foods
Other foods and drinks
Total
Take home confectionery
Biscuits
Take home savouries
Cakes pastries and sugar morning goods
Total puddings and desserts
Take home sugary drinks
Edible ices and ice cream
Total
SIMD 4
△ in share
-0.009
-0.006
-0.005
-0.005
-0.002
-0.006
-0.002
-0.035
0.033
-0.001
△ in expenditure (£)
-0.236
-0.152
-0.144
-0.138
-0.061
-0.163
-0.066
-0.960
0.921
-0.039
△ in quantity (Kg)
-0.070
-0.025
-0.018
-0.097
-0.011
-0.135
-0.019
-0.376
0.178
-0.198
△ in energy (kcal)
-326.295
-118.485
-90.861
-182.334
-23.645
-41.766
-40.569
-823.955
243.447
-580.507
△ in protein(g)
-3.525
-1.644
-1.380
-4.510
-0.354
-0.148
-0.518
-12.079
9.598
-2.481
△ in carbohydrate(g)
-45.123
-16.283
-9.306
-28.686
-3.158
-9.869
-4.837
-117.262
22.558
-94.704
△ in sugar(g)
-37.065
-7.579
-0.859
-9.548
-2.236
-9.206
-4.075
-70.567
10.074
-60.492
△ in fat(g)
-14.769
-5.018
-5.201
-5.854
-1.042
-0.045
-2.097
-34.026
10.573
-23.453
△ in saturates(g)
-8.622
-2.492
-0.604
-2.271
-0.611
-0.020
-1.425
-16.045
4.026
-12.019
△ in fibre(g)
-1.139
-0.943
-0.758
-1.700
-0.103
-0.083
-0.110
-4.835
3.117
-1.718
△ in sodium(g)
-0.071
-0.068
-0.106
-0.156
-0.010
-0.012
-0.011
-0.434
0.292
-0.142
SIMD 5
△ in share
-0.010
-0.007
-0.006
-0.005
-0.004
-0.005
-0.006
-0.043
0.034
-0.009
△ in expenditure (£)
-0.299
-0.188
-0.176
-0.134
-0.119
-0.146
-0.174
-1.234
0.983
-0.251
△ in quantity (Kg)
-0.082
-0.031
-0.022
-0.089
-0.020
-0.119
-0.049
-0.413
0.206
-0.207
△ in energy (kcal)
-387.232
-143.807
-111.205
-165.886
-46.013
-36.011
-107.040
-997.193
310.283
-686.909
△ in protein(g)
-4.283
-2.056
-1.686
-4.059
-0.666
-0.153
-1.376
-14.279
8.453
-5.826
△ in carbohydrate(g)
-52.021
-19.721
-11.503
-26.252
-6.122
-8.472
-12.328
-136.419
20.714
-115.705
△ in sugar(g)
-42.897
-8.926
-0.894
-8.395
-4.291
-8.054
-10.416
-83.873
12.335
-71.538
△ in fat(g)
-18.193
-6.072
-6.297
-5.213
-2.049
-0.047
-5.716
-43.587
17.128
-26.460
△ in saturates(g)
-10.721
-3.012
-0.702
-2.029
-1.184
-0.023
-3.937
-21.608
7.436
-14.173
△ in fibre(g)
-1.419
-1.145
-0.964
-1.581
-0.208
-0.069
-0.273
-5.659
2.713
-2.946
△ in sodium(g)
-0.080
-0.085
-0.130
-0.147
-0.019
-0.008
-0.029
-0.497
0.263
-0.235
Table A12: Policy simulation - by rural urban (Changes are in per capita per week terms)
Group
Category
Discretionary foods
Other foods and drinks
Total
Take home confectionery
Biscuits
Take home savouries
Cakes pastries and sugar morning goods
Total puddings and desserts
Take home sugary drinks
Edible ices and ice cream
Total
Lg. Urb. Areas
△ in share
-0.010
-0.009
-0.005
-0.006
-0.003
-0.007
-0.005
-0.043
0.043
0.000
△ in expenditure (£)
-0.275
-0.231
-0.135
-0.150
-0.083
-0.176
-0.125
-1.175
1.170
-0.005
△ in quantity (Kg)
-0.085
-0.039
-0.017
-0.107
-0.015
-0.150
-0.035
-0.449
0.218
-0.231
△ in energy (kcal)
-398.688
-182.969
-86.452
-200.438
-32.230
-44.510
-77.104
-1022.390
340.328
-682.062
△ in protein(g)
-4.286
-2.544
-1.307
-4.940
-0.482
-0.212
-0.976
-14.747
11.173
-3.574
△ in carbohydrate(g)
-54.794
-25.029
-8.827
-31.468
-4.264
-10.434
-9.021
-143.837
22.984
-120.853
△ in sugar(g)
-44.930
-11.686
-0.702
-10.104
-3.012
-9.982
-7.543
-87.959
10.097
-77.862
△ in fat(g)
-18.290
-7.799
-4.958
-6.357
-1.445
-0.074
-4.066
-42.990
18.520
-24.470
△ in saturates(g)
-10.717
-3.896
-0.559
-2.439
-0.833
-0.036
-2.763
-21.243
7.190
-14.053
△ in fibre(g)
-1.369
-1.419
-0.720
-1.889
-0.142
-0.094
-0.213
-5.846
2.976
-2.869
△ in sodium(g)
-0.085
-0.102
-0.100
-0.177
-0.014
-0.011
-0.021
-0.510
0.403
-0.107
Oth. Urb. Areas
△ in share
-0.009
-0.006
-0.005
-0.004
-0.004
-0.008
-0.004
-0.039
0.035
-0.003
△ in expenditure (£)
-0.252
-0.161
-0.128
-0.106
-0.098
-0.216
-0.105
-1.067
0.976
-0.091
△ in quantity (Kg)
-0.081
-0.028
-0.016
-0.075
-0.018
-0.197
-0.031
-0.446
0.200
-0.246
△ in energy (kcal)
-379.735
-129.499
-84.549
-140.533
-38.621
-57.250
-63.818
-894.005
268.323
-625.682
△ in protein(g)
-4.103
-1.786
-1.254
-3.379
-0.578
-0.243
-0.812
-12.155
5.817
-6.338
△ in carbohydrate(g)
-52.594
-17.836
-8.763
-22.027
-5.231
-13.437
-7.606
-127.494
18.324
-109.170
△ in sugar(g)
-43.464
-8.494
-0.735
-7.540
-3.738
-12.722
-6.422
-83.115
10.271
-72.845
△ in fat(g)
-17.131
-5.472
-4.806
-4.588
-1.666
-0.074
-3.295
-37.033
13.771
-23.262
△ in saturates(g)
-10.018
-2.748
-0.549
-1.755
-0.982
-0.033
-2.258
-18.342
5.665
-12.677
△ in fibre(g)
-1.280
-1.008
-0.690
-1.261
-0.162
-0.142
-0.169
-4.712
2.706
-2.006
△ in sodium(g)
-0.082
-0.073
-0.101
-0.120
-0.017
-0.021
-0.017
-0.430
0.204
-0.226
Ac. Sm. Towns
△ in share
-0.009
-0.006
-0.005
-0.002
-0.002
-0.009
-0.003
-0.035
0.027
-0.008
△ in expenditure (£)
-0.215
-0.147
-0.129
-0.047
-0.055
-0.216
-0.083
-0.892
0.679
-0.213
△ in quantity (Kg)
-0.070
-0.026
-0.016
-0.035
-0.011
-0.181
-0.025
-0.364
0.171
-0.193
△ in energy (kcal)
-325.244
-119.344
-83.795
-64.923
-23.095
-52.620
-52.335
-721.356
297.603
-423.753
△ in protein(g)
-3.437
-1.670
-1.184
-1.707
-0.350
-0.128
-0.669
-9.144
13.170
4.026
△ in carbohydrate(g)
-45.974
-16.331
-8.806
-10.340
-3.167
-12.501
-6.214
-103.333
21.796
-81.537
△ in sugar(g)
-37.581
-7.522
-0.690
-3.469
-2.222
-11.560
-5.164
-68.209
7.013
-61.196
△ in fat(g)
-14.340
-5.082
-4.735
-2.003
-0.983
-0.040
-2.713
-29.896
17.955
-11.941
△ in saturates(g)
-8.362
-2.549
-0.526
-0.770
-0.562
-0.015
-1.872
-14.656
7.367
-7.290
△ in fibre(g)
-1.112
-0.921
-0.671
-0.624
-0.099
-0.106
-0.144
-3.677
2.971
-0.706
△ in sodium(g)
-0.069
-0.069
-0.101
-0.057
-0.011
-0.015
-0.013
-0.334
0.483
0.149
Table A13: Policy simulation - by rural urban (cont.) (Changes are in per capita per week terms)
Group
Category
Discretionary foods
Other foods and drinks
Total
Take home confectionery
Biscuits
Take home savouries
Cakes pastries and sugar morning goods
Total puddings and desserts
Take home sugary drinks
Edible ices and ice cream
Total
Rm. Sm. Towns
△ in share
-0.012
-0.005
-0.004
-0.005
-0.003
-0.007
-0.004
-0.041
0.043
0.002
△ in expenditure (£)
-0.349
-0.135
-0.114
-0.156
-0.097
-0.199
-0.108
-1.158
1.216
0.058
△ in quantity (Kg)
-0.117
-0.024
-0.014
-0.119
-0.020
-0.181
-0.033
-0.507
0.205
-0.301
△ in energy (kcal)
-544.813
-111.856
-72.223
-221.149
-33.948
-55.898
-62.999
-1102.885
201.904
-900.981
△ in protein(g)
-5.675
-1.488
-1.058
-5.293
-0.594
-0.223
-0.765
-15.096
9.502
-5.594
△ in carbohydrate(g)
-76.504
-15.294
-7.324
-34.820
-5.000
-13.098
-7.971
-160.011
6.974
-153.036
△ in sugar(g)
-63.910
-7.389
-0.549
-11.693
-3.703
-12.348
-6.464
-106.057
8.442
-97.615
△ in fat(g)
-24.183
-4.822
-4.185
-6.959
-1.255
-0.094
-3.061
-44.560
11.291
-33.269
△ in saturates(g)
-14.318
-2.500
-0.478
-2.552
-0.740
-0.025
-2.078
-22.690
4.646
-18.043
△ in fibre(g)
-1.776
-0.722
-0.566
-1.950
-0.135
-0.096
-0.209
-5.453
1.783
-3.671
△ in sodium(g)
-0.123
-0.060
-0.086
-0.196
-0.015
-0.011
-0.017
-0.507
0.368
-0.140
Ac. Rural
△ in share
-0.011
-0.008
-0.006
-0.006
-0.003
-0.006
-0.004
-0.045
0.040
-0.005
△ in expenditure (£)
-0.320
-0.231
-0.156
-0.183
-0.096
-0.168
-0.118
-1.272
1.135
-0.137
△ in quantity (Kg)
-0.092
-0.039
-0.019
-0.131
-0.017
-0.133
-0.034
-0.466
0.249
-0.217
△ in energy (kcal)
-431.785
-179.528
-98.684
-249.656
-35.411
-40.027
-71.014
-1106.105
383.945
-722.160
△ in protein(g)
-4.556
-2.515
-1.574
-6.052
-0.513
-0.165
-0.894
-16.269
8.258
-8.011
△ in carbohydrate(g)
-60.177
-24.705
-10.055
-39.258
-4.791
-9.430
-8.446
-156.862
30.974
-125.887
△ in sugar(g)
-49.408
-11.240
-0.985
-13.155
-3.407
-8.823
-7.152
-94.170
15.893
-78.278
△ in fat(g)
-19.404
-7.537
-5.631
-8.057
-1.535
-0.051
-3.686
-45.901
20.062
-25.839
△ in saturates(g)
-11.380
-3.658
-0.658
-3.237
-0.908
-0.023
-2.517
-22.381
8.542
-13.839
△ in fibre(g)
-1.513
-1.572
-0.862
-2.267
-0.165
-0.094
-0.188
-6.662
3.737
-2.925
△ in sodium(g)
-0.094
-0.102
-0.113
-0.219
-0.015
-0.018
-0.019
-0.579
0.324
-0.255
Rm. Rural
△ in share
-0.006
-0.004
-0.004
-0.003
-0.002
-0.005
-0.003
-0.026
0.025
0.000
△ in expenditure (£)
-0.182
-0.108
-0.109
-0.074
-0.058
-0.149
-0.074
-0.754
0.742
-0.012
△ in quantity (Kg)
-0.057
-0.019
-0.014
-0.054
-0.011
-0.129
-0.024
-0.308
0.196
-0.112
△ in energy (kcal)
-270.189
-89.955
-69.708
-102.299
-24.052
-39.291
-50.235
-645.728
305.723
-340.006
△ in protein(g)
-2.993
-1.250
-1.100
-2.430
-0.365
-0.149
-0.672
-8.959
11.037
2.078
△ in carbohydrate(g)
-36.019
-12.449
-7.021
-16.231
-3.315
-9.214
-5.908
-90.158
18.980
-71.177
△ in sugar(g)
-30.516
-5.560
-0.549
-5.325
-2.221
-8.501
-5.013
-57.685
12.404
-45.281
△ in fat(g)
-12.637
-3.775
-4.031
-3.168
-1.019
-0.052
-2.630
-27.311
20.741
-6.570
△ in saturates(g)
-7.294
-1.927
-0.490
-1.258
-0.592
-0.018
-1.772
-13.349
7.882
-5.467
△ in fibre(g)
-1.028
-0.671
-0.562
-0.921
-0.095
-0.075
-0.128
-3.480
2.918
-0.562
△ in sodium(g)
-0.057
-0.055
-0.082
-0.088
-0.010
-0.009
-0.014
-0.315
0.292
-0.024
Table A14: Policy simulation - by income (Changes are in per capita per week terms)
Group
Category
Discretionary foods
Other foods and drinks
Total
Take home confectionery
Biscuits
Take home savouries
Cakes pastries and sugar morning goods
Total puddings and desserts
Take home sugary drinks
Edible ices and ice cream
Total
£0 - £29,999
△ in share
-0.009
-0.006
-0.004
-0.004
-0.003
-0.007
-0.004
-0.038
0.036
-0.002
△ in expenditure (£)
-0.265
-0.174
-0.118
-0.128
-0.096
-0.191
-0.106
-1.077
1.032
-0.046
△ in quantity (Kg)
-0.087
-0.031
-0.015
-0.098
-0.019
-0.168
-0.032
-0.449
0.202
-0.248
△ in energy (kcal)
-404.984
-145.911
-77.204
-180.854
-38.131
-49.115
-67.378
-963.578
315.251
-648.326
△ in protein(g)
-4.304
-1.989
-1.152
-4.425
-0.583
-0.240
-0.848
-13.541
8.134
-5.406
△ in carbohydrate(g)
-56.425
-20.039
-7.907
-28.375
-5.154
-11.497
-8.041
-137.438
23.373
-114.065
△ in sugar(g)
-46.285
-9.479
-0.639
-9.818
-3.649
-10.890
-6.726
-87.485
10.992
-76.492
△ in fat(g)
-18.230
-6.204
-4.429
-5.860
-1.649
-0.082
-3.481
-39.936
16.412
-23.524
△ in saturates(g)
-10.650
-3.136
-0.508
-2.255
-0.963
-0.036
-2.385
-19.934
6.286
-13.648
△ in fibre(g)
-1.372
-1.102
-0.627
-1.625
-0.165
-0.123
-0.187
-5.201
2.957
-2.244
△ in sodium(g)
-0.089
-0.081
-0.090
-0.154
-0.016
-0.017
-0.018
-0.465
0.304
-0.161
£30,000 - £39,999
△ in share
-0.010
-0.009
-0.006
-0.005
-0.002
-0.010
-0.004
-0.045
0.039
-0.007
△ in expenditure (£)
-0.273
-0.242
-0.145
-0.122
-0.063
-0.254
-0.097
-1.195
1.018
-0.178
△ in quantity (Kg)
-0.085
-0.041
-0.018
-0.085
-0.011
-0.221
-0.028
-0.490
0.169
-0.321
△ in energy (kcal)
-401.354
-189.467
-93.778
-161.393
-24.417
-68.411
-58.661
-997.482
229.394
-768.088
△ in protein(g)
-4.345
-2.625
-1.388
-3.789
-0.363
-0.204
-0.766
-13.481
6.373
-7.107
△ in carbohydrate(g)
-54.870
-25.904
-9.713
-25.243
-3.337
-16.231
-6.805
-142.102
8.459
-133.643
△ in sugar(g)
-45.925
-12.143
-0.756
-8.499
-2.372
-15.157
-5.763
-90.615
6.056
-84.559
△ in fat(g)
-18.313
-8.087
-5.333
-5.243
-1.044
-0.068
-3.106
-41.194
13.100
-28.094
△ in saturates(g)
-10.773
-4.056
-0.594
-2.027
-0.609
-0.030
-2.119
-20.208
4.927
-15.281
△ in fibre(g)
-1.373
-1.509
-0.779
-1.471
-0.105
-0.122
-0.148
-5.507
1.586
-3.920
△ in sodium(g)
-0.084
-0.108
-0.112
-0.138
-0.010
-0.015
-0.016
-0.483
0.222
-0.261
£40,000 - £49,999
△ in share
-0.008
-0.006
-0.007
-0.003
-0.003
-0.006
-0.005
-0.037
0.028
-0.009
△ in expenditure (£)
-0.222
-0.148
-0.185
-0.070
-0.070
-0.154
-0.128
-0.976
0.743
-0.233
△ in quantity (Kg)
-0.066
-0.024
-0.023
-0.044
-0.012
-0.128
-0.034
-0.331
0.157
-0.174
△ in energy (kcal)
-311.351
-110.500
-116.979
-83.642
-26.003
-39.205
-72.529
-760.210
212.307
-547.903
△ in protein(g)
-3.380
-1.602
-1.809
-2.183
-0.385
-0.129
-0.912
-10.400
6.134
-4.266
△ in carbohydrate(g)
-42.861
-15.365
-12.059
-13.365
-3.569
-9.171
-8.628
-105.017
3.765
-101.253
△ in sugar(g)
-35.741
-6.910
-1.043
-3.814
-2.530
-8.649
-7.295
-65.982
5.778
-60.204
△ in fat(g)
-14.128
-4.547
-6.633
-2.528
-1.104
-0.038
-3.766
-32.744
15.023
-17.720
△ in saturates(g)
-8.230
-2.205
-0.774
-0.976
-0.643
-0.016
-2.570
-15.413
7.182
-8.232
△ in fibre(g)
-1.063
-0.963
-0.996
-0.813
-0.113
-0.074
-0.184
-4.206
1.068
-3.138
△ in sodium(g)
-0.065
-0.066
-0.139
-0.078
-0.011
-0.009
-0.019
-0.387
0.174
-0.213
Table A15: Policy simulation - by income (cont.) (Changes are in per capita per week terms)
Group
Category
Discretionary foods
Other foods and drinks
Total
Take home confectionery
Biscuits
Take home savouries
Cakes pastries and sugar morning goods
Total puddings and desserts
Take home sugary drinks
Edible ices and ice cream
Total
£50,000 - £59,999
△ in share
-0.012
-0.007
-0.008
-0.008
-0.002
-0.010
-0.004
-0.051
0.043
-0.008
△ in expenditure (£)
-0.296
-0.184
-0.198
-0.208
-0.061
-0.267
-0.094
-1.308
1.093
-0.215
△ in quantity (Kg)
-0.089
-0.029
-0.024
-0.135
-0.010
-0.231
-0.025
-0.544
0.281
-0.263
△ in energy (kcal)
-417.866
-135.630
-124.342
-254.091
-22.931
-66.865
-52.972
-1074.697
478.036
-596.661
△ in protein(g)
-4.535
-1.898
-1.848
-6.124
-0.339
-0.214
-0.669
-15.627
15.179
-0.449
△ in carbohydrate(g)
-57.761
-18.755
-13.095
-40.031
-3.060
-15.905
-6.366
-154.974
48.308
-106.666
△ in sugar(g)
-47.726
-8.660
-1.253
-12.360
-2.225
-15.084
-5.371
-92.678
16.684
-75.994
△ in fat(g)
-18.855
-5.699
-6.963
-7.835
-1.020
-0.058
-2.716
-43.146
23.796
-19.351
△ in saturates(g)
-11.024
-2.829
-0.785
-2.999
-0.591
-0.022
-1.820
-20.070
10.519
-9.550
△ in fibre(g)
-1.422
-1.035
-1.045
-2.346
-0.096
-0.111
-0.157
-6.211
5.500
-0.710
△ in sodium(g)
-0.091
-0.079
-0.148
-0.235
-0.010
-0.015
-0.015
-0.593
0.599
0.006
£60,000 - over
△ in share
-0.009
-0.005
-0.007
-0.006
-0.003
-0.006
-0.002
-0.037
0.040
0.003
△ in expenditure (£)
-0.221
-0.123
-0.192
-0.168
-0.075
-0.145
-0.043
-0.967
1.036
0.070
△ in quantity (Kg)
-0.056
-0.018
-0.023
-0.107
-0.012
-0.115
-0.012
-0.343
0.249
-0.093
△ in energy (kcal)
-264.238
-85.255
-117.609
-201.419
-28.967
-33.448
-24.528
-755.466
396.502
-358.963
△ in protein(g)
-3.063
-1.279
-1.878
-4.665
-0.402
-0.091
-0.329
-11.706
8.578
-3.128
△ in carbohydrate(g)
-34.690
-11.505
-11.900
-31.718
-3.820
-7.926
-2.889
-104.447
27.984
-76.464
△ in sugar(g)
-28.549
-5.236
-1.095
-10.110
-2.675
-7.542
-2.427
-57.633
17.937
-39.696
△ in fat(g)
-12.694
-3.657
-6.750
-6.383
-1.315
-0.023
-1.281
-32.102
26.208
-5.894
△ in saturates(g)
-7.506
-1.760
-0.765
-2.473
-0.768
-0.006
-0.857
-14.135
11.156
-2.979
△ in fibre(g)
-1.063
-0.701
-0.991
-2.054
-0.122
-0.066
-0.066
-5.062
3.919
-1.143
△ in sodium(g)
-0.052
-0.049
-0.141
-0.177
-0.012
-0.011
-0.007
-0.450
0.297
-0.154
Table A16: Policy simulation - by life stage (Changes are in per capita per week terms)
Group
Category
Discretionary foods
Other foods and drinks
Total
Take home confectionery
Biscuits
Take home savouries
Cakes pastries and sugar morning goods
Total puddings and desserts
Take home sugary drinks
Edible ices and ice cream
Total
Pre-family
△ in share
-0.011
-0.006
-0.007
-0.004
-0.002
-0.009
-0.003
-0.043
0.046
0.003
△ in expenditure (£)
-0.304
-0.175
-0.195
-0.122
-0.067
-0.261
-0.087
-1.211
1.308
0.098
△ in quantity (Kg)
-0.097
-0.028
-0.024
-0.086
-0.011
-0.215
-0.022
-0.482
0.252
-0.231
△ in energy (kcal)
-443.897
-128.472
-119.928
-160.636
-25.155
-69.288
-48.163
-995.538
407.662
-587.876
△ in protein(g)
-4.974
-1.869
-1.838
-3.778
-0.373
-0.257
-0.622
-13.711
16.299
2.588
△ in carbohydrate(g)
-61.355
-17.588
-12.604
-25.366
-3.348
-16.312
-5.690
-142.263
31.908
-110.355
△ in sugar(g)
-48.884
-8.150
-1.083
-7.705
-2.426
-15.404
-4.750
-88.402
14.567
-73.835
△ in fat(g)
-20.405
-5.421
-6.708
-4.959
-1.120
-0.091
-2.513
-41.217
20.253
-20.964
△ in saturates(g)
-11.998
-2.610
-0.750
-1.894
-0.653
-0.038
-1.686
-19.630
7.926
-11.705
△ in fibre(g)
-1.519
-1.084
-1.034
-1.671
-0.108
-0.113
-0.125
-5.654
3.400
-2.254
△ in sodium(g)
-0.090
-0.075
-0.145
-0.145
-0.010
-0.014
-0.013
-0.493
0.489
-0.003
Young family
△ in share
-0.015
-0.009
-0.009
-0.006
-0.003
-0.007
-0.003
-0.051
0.048
-0.003
△ in expenditure (£)
-0.267
-0.158
-0.166
-0.101
-0.048
-0.118
-0.055
-0.914
0.868
-0.047
△ in quantity (Kg)
-0.089
-0.026
-0.022
-0.061
-0.010
-0.101
-0.016
-0.324
0.218
-0.107
△ in energy (kcal)
-423.320
-119.690
-109.971
-115.954
-20.153
-32.967
-31.416
-853.472
363.371
-490.100
△ in protein(g)
-4.665
-1.653
-1.463
-2.687
-0.314
-0.134
-0.393
-11.309
10.350
-0.959
△ in carbohydrate(g)
-58.030
-16.812
-11.967
-18.148
-2.825
-7.766
-3.865
-119.414
27.445
-91.968
△ in sugar(g)
-48.815
-7.894
-0.947
-5.534
-2.101
-7.440
-3.177
-75.909
11.846
-64.063
△ in fat(g)
-19.183
-4.914
-6.079
-3.638
-0.834
-0.049
-1.572
-36.270
20.733
-15.538
△ in saturates(g)
-11.214
-2.397
-0.666
-1.417
-0.482
-0.020
-1.067
-17.263
8.709
-8.554
△ in fibre(g)
-1.408
-0.933
-0.852
-1.072
-0.075
-0.063
-0.091
-4.494
3.248
-1.245
△ in sodium(g)
-0.088
-0.067
-0.138
-0.110
-0.009
-0.007
-0.008
-0.427
0.327
-0.100
Middle family
△ in share
-0.008
-0.005
-0.004
-0.006
-0.003
-0.006
-0.004
-0.037
0.029
-0.009
△ in expenditure (£)
-0.165
-0.106
-0.089
-0.113
-0.060
-0.126
-0.082
-0.741
0.569
-0.172
△ in quantity (Kg)
-0.062
-0.017
-0.012
-0.071
-0.011
-0.115
-0.023
-0.311
0.148
-0.163
△ in energy (kcal)
-293.937
-81.000
-58.991
-133.918
-26.087
-32.359
-47.745
-674.037
293.982
-380.055
△ in protein(g)
-3.218
-1.134
-0.836
-3.191
-0.394
-0.135
-0.611
-9.519
13.837
4.318
△ in carbohydrate(g)
-40.492
-11.233
-6.263
-21.060
-3.490
-7.639
-5.809
-95.984
20.791
-75.193
△ in sugar(g)
-34.144
-5.487
-0.531
-6.428
-2.533
-7.257
-4.837
-61.217
5.922
-55.295
△ in fat(g)
-13.277
-3.381
-3.306
-4.214
-1.151
-0.042
-2.411
-27.783
18.740
-9.043
△ in saturates(g)
-7.731
-1.667
-0.366
-1.633
-0.643
-0.018
-1.654
-13.714
7.311
-6.402
△ in fibre(g)
-0.948
-0.637
-0.482
-1.233
-0.112
-0.071
-0.135
-3.618
2.514
-1.104
△ in sodium(g)
-0.063
-0.044
-0.072
-0.126
-0.011
-0.007
-0.013
-0.337
0.441
0.104
Table A17: Policy simulation - by life stage (cont.) (Changes are in per capita per week terms)
Group
Category
Discretionary foods
Other foods and drinks
Total
Take home confectionery
Biscuits
Take home savouries
Cakes pastries and sugar morning goods
Total puddings and desserts
Take home sugary drinks
Edible ices and ice cream
Total
Older family
△ in share
-0.006
-0.006
-0.002
-0.005
-0.005
-0.009
-0.005
-0.039
0.032
-0.007
△ in expenditure (£)
-0.116
-0.126
-0.045
-0.095
-0.104
-0.187
-0.101
-0.774
0.635
-0.139
△ in quantity (Kg)
-0.043
-0.021
-0.006
-0.063
-0.020
-0.173
-0.028
-0.354
0.094
-0.260
△ in energy (kcal)
-199.729
-99.703
-30.720
-120.390
-41.595
-51.055
-60.175
-603.368
145.723
-457.645
△ in protein(g)
-2.191
-1.364
-0.452
-2.815
-0.663
-0.205
-0.749
-8.439
4.821
-3.619
△ in carbohydrate(g)
-27.663
-13.895
-3.200
-18.812
-5.585
-12.103
-7.345
-88.604
6.890
-81.714
△ in sugar(g)
-22.909
-6.647
-0.271
-5.934
-3.988
-11.488
-6.148
-57.384
2.326
-55.058
△ in fat(g)
-9.018
-4.143
-1.742
-3.830
-1.790
-0.076
-3.042
-23.640
7.027
-16.613
△ in saturates(g)
-5.238
-2.051
-0.193
-1.449
-1.031
-0.037
-2.084
-12.083
1.709
-10.375
△ in fibre(g)
-0.634
-0.776
-0.253
-1.140
-0.170
-0.098
-0.156
-3.227
1.178
-2.049
△ in sodium(g)
-0.044
-0.055
-0.038
-0.108
-0.019
-0.011
-0.015
-0.288
0.182
-0.106
45+ no children
△ in share
-0.008
-0.006
-0.003
-0.004
-0.003
-0.006
-0.004
-0.035
0.031
-0.004
△ in expenditure (£)
-0.258
-0.193
-0.100
-0.137
-0.100
-0.190
-0.120
-1.098
0.977
-0.122
△ in quantity (Kg)
-0.076
-0.034
-0.012
-0.107
-0.018
-0.164
-0.037
-0.450
0.180
-0.270
△ in energy (kcal)
-356.788
-160.459
-64.560
-198.665
-38.124
-46.595
-78.070
-943.262
247.887
-695.375
△ in protein(g)
-3.753
-2.199
-1.009
-4.976
-0.570
-0.208
-0.993
-13.708
5.322
-8.386
△ in carbohydrate(g)
-49.464
-21.895
-6.424
-31.266
-5.164
-10.896
-9.152
-134.262
15.786
-118.476
△ in sugar(g)
-40.795
-10.177
-0.524
-10.967
-3.608
-10.243
-7.737
-84.051
9.206
-74.845
△ in fat(g)
-16.115
-6.878
-3.763
-6.446
-1.646
-0.065
-4.104
-39.017
13.147
-25.870
△ in saturates(g)
-9.435
-3.502
-0.442
-2.486
-0.969
-0.028
-2.809
-19.670
5.442
-14.228
△ in fibre(g)
-1.253
-1.225
-0.533
-1.761
-0.167
-0.123
-0.212
-5.274
2.360
-2.915
△ in sodium(g)
-0.078
-0.091
-0.073
-0.166
-0.016
-0.019
-0.021
-0.464
0.223
-0.241
7.5.2 Other food and drinks
Table A18: Policy simulation - other food and drinks - by
SIMD (Changes are in per capita per week terms)
Group
Other food and drinks
Dairy products
Meat and fish
Fats and eggs
Fruit
Vegetables
Grains
Prepared ready to eat foods
Sugar and preserves
Condiments and sauces
Low calorie soft drinks and juices
Alcoholic beverages
Total
SIMD 1
△ in share
0.004
0.008
0.002
0.003
0.004
0.002
0.006
0.001
0.001
0.000
0.008
0.038
△ in expenditure (£)
0.095
0.200
0.059
0.070
0.099
0.041
0.161
0.014
0.027
-0.011
0.217
0.971
△ in quantity (Kg)
0.026
0.026
0.023
0.019
0.042
0.014
0.030
0.003
0.002
-0.002
0.022
0.205
△ in energy (kcal)
45.589
49.146
108.898
16.839
25.076
38.284
54.997
8.714
2.932
-0.885
24.830
374.420
△ in protein(g)
2.551
5.516
0.736
0.298
0.940
1.170
2.570
0.126
0.063
-0.026
0.025
13.969
△ in carbohydrate(g)
1.603
0.872
0.152
2.569
4.125
6.698
5.127
1.301
0.346
-0.150
0.364
23.007
△ in sugar(g)
1.339
0.174
0.105
2.370
1.750
0.864
0.919
0.954
0.200
-0.103
0.281
8.854
△ in fat(g)
3.194
2.618
11.729
0.600
0.456
0.651
2.615
0.333
0.134
-0.021
0.008
22.318
△ in saturates(g)
2.035
0.995
4.573
0.109
0.091
0.196
0.743
0.138
0.032
-0.017
0.003
8.897
△ in fibre(g)
0.042
0.101
0.020
0.326
0.893
0.568
0.482
0.042
0.037
-0.028
0.000
2.481
△ in sodium(g)
0.069
0.125
0.064
0.003
0.020
0.040
0.120
0.006
0.043
-0.001
0.001
0.491
SIMD 2
△ in share
0.002
0.002
0.002
0.003
0.008
0.002
0.000
0.000
0.001
0.002
0.019
0.042
△ in expenditure (£)
0.062
0.053
0.062
0.083
0.219
0.046
0.014
0.007
0.032
0.044
0.530
1.152
△ in quantity (Kg)
0.017
0.007
0.023
0.022
0.089
0.015
0.002
0.001
0.003
0.006
0.047
0.232
△ in energy (kcal)
28.590
12.359
107.670
17.788
53.416
42.492
4.443
3.832
4.482
3.251
59.707
338.030
△ in protein(g)
1.623
1.359
0.742
0.311
2.136
1.275
0.206
0.048
0.088
0.105
0.046
7.940
△ in carbohydrate(g)
1.008
0.216
0.146
2.972
8.571
7.450
0.415
0.598
0.534
0.523
0.727
23.160
△ in sugar(g)
0.853
0.044
0.102
2.747
3.373
1.073
0.077
0.447
0.309
0.376
0.576
9.977
△ in fat(g)
1.993
0.672
11.598
0.532
1.001
0.729
0.212
0.136
0.207
0.083
0.017
17.181
△ in saturates(g)
1.271
0.254
4.505
0.102
0.205
0.220
0.061
0.058
0.049
0.064
0.008
6.798
△ in fibre(g)
0.028
0.025
0.018
0.369
1.910
0.634
0.040
0.017
0.053
0.117
0.000
3.211
△ in sodium(g)
0.044
0.030
0.065
0.004
0.043
0.042
0.010
0.004
0.075
0.003
0.003
0.322
SIMD 3
△ in share
0.001
0.002
0.003
0.005
0.005
0.002
-0.002
0.000
0.002
0.001
0.019
0.036
△ in expenditure (£)
0.015
0.045
0.071
0.133
0.132
0.055
-0.057
-0.013
0.058
0.034
0.513
0.987
△ in quantity (Kg)
0.004
0.006
0.026
0.035
0.054
0.019
-0.010
-0.002
0.005
0.004
0.045
0.185
△ in energy (kcal)
6.923
10.474
126.355
32.021
33.371
52.046
-18.337
-6.813
7.582
2.363
51.213
297.199
△ in protein(g)
0.384
1.153
0.789
0.591
1.264
1.577
-0.851
-0.092
0.149
0.081
0.049
5.094
△ in carbohydrate(g)
0.233
0.187
0.191
4.963
5.415
9.085
-1.720
-1.023
0.894
0.385
0.677
19.287
△ in sugar(g)
0.203
0.037
0.131
4.504
2.464
1.285
-0.326
-0.795
0.543
0.272
0.560
8.878
△ in fat(g)
0.491
0.568
13.635
1.117
0.624
0.892
-0.867
-0.257
0.354
0.056
0.016
16.630
△ in saturates(g)
0.312
0.214
5.382
0.211
0.126
0.251
-0.242
-0.103
0.080
0.044
0.007
6.283
△ in fibre(g)
0.006
0.021
0.021
0.632
1.141
0.819
-0.166
-0.032
0.089
0.100
0.000
2.633
△ in sodium(g)
0.010
0.026
0.075
0.007
0.027
0.050
-0.040
-0.004
0.109
0.002
0.003
0.264
Table A19: Policy simulation - other food and drinks - by
SIMD (cont.) (Changes are in per capita per week terms)
Group
Other food and drinks
Dairy products
Meat and fish
Fats and eggs
Fruit
Vegetables
Grains
Prepared ready to eat foods
Sugar and preserves
Condiments and sauces
Low calorie soft drinks and juices
Alcoholic beverages
Total
SIMD 4
△ in share
0.001
0.009
0.001
0.003
0.007
0.002
-0.003
0.001
0.002
0.003
0.008
0.033
△ in expenditure (£)
0.020
0.239
0.027
0.083
0.197
0.063
-0.095
0.023
0.047
0.092
0.224
0.921
△ in quantity (Kg)
0.005
0.029
0.009
0.020
0.074
0.020
-0.016
0.004
0.004
0.012
0.016
0.178
△ in energy (kcal)
8.777
53.615
44.710
17.186
45.439
57.259
-28.201
13.852
5.583
6.851
18.376
243.447
△ in protein(g)
0.476
5.853
0.290
0.299
1.769
1.718
-1.353
0.187
0.106
0.235
0.018
9.598
△ in carbohydrate(g)
0.317
0.940
0.061
2.774
7.003
9.978
-2.589
2.082
0.624
1.104
0.262
22.558
△ in sugar(g)
0.264
0.194
0.040
2.542
3.134
1.433
-0.517
1.586
0.387
0.800
0.212
10.074
△ in fat(g)
0.618
2.934
4.821
0.553
1.009
1.006
-1.336
0.517
0.277
0.168
0.006
10.573
△ in saturates(g)
0.395
1.107
1.939
0.100
0.198
0.283
-0.390
0.209
0.059
0.124
0.003
4.026
△ in fibre(g)
0.009
0.118
0.008
0.351
1.613
0.891
-0.272
0.065
0.067
0.268
0.000
3.117
△ in sodium(g)
0.013
0.132
0.026
0.005
0.039
0.055
-0.062
0.008
0.069
0.007
0.001
0.292
SIMD 5
△ in share
0.004
0.005
0.002
0.007
0.006
0.002
-0.004
0.000
0.001
0.000
0.011
0.034
△ in expenditure (£)
0.113
0.129
0.059
0.208
0.162
0.047
-0.117
0.013
0.041
0.006
0.321
0.983
△ in quantity (Kg)
0.029
0.014
0.020
0.051
0.057
0.015
-0.019
0.002
0.003
0.001
0.032
0.206
△ in energy (kcal)
50.094
26.650
95.752
41.863
33.539
42.499
-32.191
7.256
4.942
0.464
39.416
310.283
△ in protein(g)
2.817
3.018
0.615
0.745
1.293
1.293
-1.561
0.095
0.089
0.017
0.032
8.453
△ in carbohydrate(g)
1.676
0.415
0.122
6.798
5.168
7.363
-2.933
1.087
0.521
0.076
0.421
20.714
△ in sugar(g)
1.468
0.090
0.085
6.295
2.384
1.050
-0.613
0.849
0.323
0.055
0.348
12.335
△ in fat(g)
3.546
1.431
10.323
1.309
0.745
0.746
-1.529
0.275
0.260
0.010
0.011
17.128
△ in saturates(g)
2.262
0.528
4.304
0.237
0.149
0.213
-0.441
0.117
0.054
0.008
0.005
7.436
△ in fibre(g)
0.047
0.055
0.015
0.885
1.200
0.706
-0.307
0.034
0.057
0.023
0.000
2.713
△ in sodium(g)
0.073
0.065
0.053
0.010
0.026
0.038
-0.070
0.006
0.059
0.000
0.002
0.263
Table A20: Policy simulation - other food and drinks - by rural urban (Changes are in per capita per week terms)
Group
Other food and drinks
Dairy products
Meat and fish
Fats and eggs
Fruit
Vegetables
Grains
Prepared ready to eat foods
Sugar and preserves
Condiments and sauces
Low calorie soft drinks and juices
Alcoholic beverages
Total
Lg. Urb. Areas
△ in share
0.002
0.007
0.002
0.004
0.005
0.002
0.002
0.000
0.002
0.003
0.013
0.043
△ in expenditure (£)
0.056
0.182
0.060
0.116
0.142
0.053
0.065
0.008
0.045
0.083
0.359
1.170
△ in quantity (Kg)
0.015
0.022
0.021
0.030
0.053
0.017
0.011
0.001
0.004
0.011
0.034
0.218
△ in energy (kcal)
25.722
40.556
99.495
24.551
31.433
46.095
19.365
4.741
5.496
5.748
37.127
340.328
△ in protein(g)
1.477
4.546
0.720
0.440
1.223
1.413
0.945
0.068
0.109
0.190
0.041
11.173
△ in carbohydrate(g)
0.833
0.679
0.131
3.929
4.830
8.003
1.756
0.695
0.604
0.982
0.541
22.984
△ in sugar(g)
0.723
0.142
0.088
3.619
2.150
1.065
0.334
0.527
0.355
0.693
0.401
10.097
△ in fat(g)
1.818
2.179
10.700
0.794
0.700
0.809
0.922
0.185
0.274
0.129
0.011
18.520
△ in saturates(g)
1.158
0.817
4.183
0.154
0.142
0.231
0.263
0.075
0.059
0.103
0.005
7.190
△ in fibre(g)
0.024
0.085
0.017
0.510
1.133
0.720
0.181
0.023
0.070
0.214
0.000
2.976
△ in sodium(g)
0.039
0.102
0.057
0.006
0.026
0.045
0.042
0.004
0.075
0.005
0.002
0.403
Oth. Urb. Areas
△ in share
0.002
0.002
0.002
0.005
0.008
0.001
-0.004
0.000
0.001
0.000
0.017
0.035
△ in expenditure (£)
0.059
0.069
0.054
0.139
0.208
0.033
-0.109
0.004
0.036
0.004
0.481
0.976
△ in quantity (Kg)
0.016
0.009
0.019
0.037
0.083
0.011
-0.019
0.001
0.003
0.001
0.040
0.200
△ in energy (kcal)
27.381
15.835
92.481
30.344
50.553
31.045
-35.196
2.117
4.511
0.294
48.959
268.323
△ in protein(g)
1.517
1.766
0.608
0.526
1.949
0.928
-1.643
0.027
0.088
0.010
0.041
5.817
△ in carbohydrate(g)
1.009
0.275
0.130
4.989
8.275
5.441
-3.308
0.321
0.533
0.047
0.611
18.324
△ in sugar(g)
0.833
0.056
0.091
4.600
3.436
0.791
-0.633
0.241
0.319
0.033
0.504
10.271
△ in fat(g)
1.906
0.851
9.968
0.940
0.922
0.532
-1.658
0.079
0.210
0.007
0.014
13.771
△ in saturates(g)
1.214
0.321
4.001
0.175
0.184
0.159
-0.482
0.034
0.048
0.006
0.006
5.665
△ in fibre(g)
0.026
0.033
0.015
0.624
1.780
0.471
-0.320
0.010
0.054
0.013
0.000
2.706
△ in sodium(g)
0.040
0.039
0.054
0.007
0.041
0.030
-0.077
0.002
0.066
0.000
0.003
0.204
Ac. Sm. Towns
△ in share
0.003
0.012
0.002
0.000
0.007
0.003
-0.005
0.000
0.004
0.003
-0.003
0.027
△ in expenditure (£)
0.077
0.311
0.054
-0.006
0.178
0.083
-0.121
0.006
0.090
0.079
-0.073
0.679
△ in quantity (Kg)
0.020
0.038
0.020
-0.001
0.073
0.028
-0.021
0.001
0.008
0.010
-0.006
0.171
△ in energy (kcal)
34.727
71.684
97.065
-1.326
43.239
77.856
-38.772
3.788
11.330
5.640
-7.628
297.603
△ in protein(g)
1.952
7.858
0.622
-0.023
1.693
2.402
-1.763
0.048
0.216
0.171
-0.005
13.170
△ in carbohydrate(g)
1.173
1.206
0.141
-0.198
6.860
13.530
-3.618
0.600
1.260
0.925
-0.084
21.796
△ in sugar(g)
1.014
0.245
0.089
-0.183
2.868
1.856
-0.693
0.462
0.758
0.669
-0.071
7.013
△ in fat(g)
2.456
3.928
10.471
-0.049
0.842
1.342
-1.857
0.132
0.567
0.126
-0.002
17.955
△ in saturates(g)
1.567
1.491
4.008
-0.009
0.170
0.376
-0.514
0.054
0.126
0.097
-0.001
7.367
△ in fibre(g)
0.028
0.134
0.018
-0.025
1.564
1.230
-0.365
0.017
0.134
0.237
0.000
2.971
△ in sodium(g)
0.052
0.179
0.059
0.000
0.038
0.076
-0.084
0.002
0.154
0.006
0.000
0.483
Table A21: Policy simulation - other food and drinks - by rural urban (cont.) (Changes are in per capita per week terms)
Group
Other food and drinks
Dairy products
Meat and fish
Fats and eggs
Fruit
Vegetables
Grains
Prepared ready to eat foods
Sugar and preserves
Condiments and sauces
Low calorie soft drinks and juices
Alcoholic beverages
Total
Rm. Sm. Towns
△ in share
0.004
0.005
0.000
0.004
0.005
-0.004
0.008
0.000
0.001
0.005
0.013
0.043
△ in expenditure (£)
0.102
0.146
0.009
0.122
0.154
-0.101
0.237
-0.003
0.026
0.142
0.382
1.216
△ in quantity (Kg)
0.026
0.019
0.003
0.031
0.066
-0.034
0.042
-0.001
0.003
0.018
0.031
0.205
△ in energy (kcal)
47.236
35.495
15.611
27.106
42.299
-92.801
80.112
-2.306
3.370
10.068
35.712
201.904
△ in protein(g)
2.505
3.676
0.109
0.476
1.702
-2.834
3.484
-0.035
0.069
0.319
0.032
9.502
△ in carbohydrate(g)
1.598
0.713
0.021
4.359
6.508
-15.989
7.739
-0.326
0.432
1.489
0.432
6.974
△ in sugar(g)
1.337
0.140
0.014
4.007
2.677
-2.493
1.240
-0.246
0.280
1.131
0.356
8.442
△ in fat(g)
3.399
1.993
1.680
0.868
0.880
-1.662
3.799
-0.096
0.142
0.278
0.008
11.291
△ in saturates(g)
2.178
0.760
0.605
0.139
0.171
-0.471
1.057
-0.035
0.036
0.202
0.004
4.646
△ in fibre(g)
0.050
0.078
0.003
0.547
1.515
-1.488
0.706
-0.011
0.036
0.347
0.000
1.783
△ in sodium(g)
0.071
0.088
0.009
0.004
0.038
-0.092
0.195
-0.001
0.045
0.008
0.002
0.368
Ac. Rural
△ in share
0.004
0.001
0.002
0.007
0.007
0.003
-0.002
0.001
0.002
0.001
0.014
0.040
△ in expenditure (£)
0.114
0.025
0.068
0.197
0.210
0.073
-0.066
0.030
0.055
0.020
0.408
1.135
△ in quantity (Kg)
0.030
0.003
0.023
0.048
0.079
0.025
-0.011
0.005
0.005
0.002
0.039
0.249
△ in energy (kcal)
49.793
5.641
115.944
40.377
48.760
70.348
-19.558
18.052
6.637
1.648
46.303
383.945
△ in protein(g)
2.737
0.630
0.703
0.724
1.815
2.109
-0.925
0.244
0.121
0.058
0.042
8.258
△ in carbohydrate(g)
1.749
0.092
0.155
6.548
7.655
12.288
-1.798
2.700
0.706
0.262
0.618
30.974
△ in sugar(g)
1.543
0.020
0.101
6.014
3.628
1.750
-0.393
2.093
0.435
0.188
0.513
15.893
△ in fat(g)
3.512
0.306
12.523
1.292
1.054
1.224
-0.934
0.677
0.348
0.042
0.018
20.062
△ in saturates(g)
2.240
0.114
5.264
0.244
0.208
0.352
-0.265
0.273
0.073
0.031
0.008
8.542
△ in fibre(g)
0.048
0.012
0.017
0.838
1.666
1.121
-0.186
0.083
0.074
0.063
0.000
3.737
△ in sodium(g)
0.072
0.014
0.066
0.010
0.038
0.065
-0.043
0.013
0.086
0.002
0.003
0.324
Rm. Rural
△ in share
0.001
0.009
0.002
0.007
0.007
0.000
0.000
0.001
0.000
-0.001
-0.001
0.025
△ in expenditure (£)
0.019
0.275
0.069
0.198
0.212
0.001
0.006
0.016
-0.005
-0.027
-0.024
0.742
△ in quantity (Kg)
0.005
0.034
0.023
0.050
0.085
0.000
0.001
0.002
0.000
-0.003
-0.002
0.196
△ in energy (kcal)
9.098
63.772
123.795
49.705
53.242
1.148
1.936
8.205
-0.611
-1.884
-2.683
305.723
△ in protein(g)
0.480
6.790
0.628
0.946
2.048
0.034
0.092
0.091
-0.012
-0.058
-0.002
11.037
△ in carbohydrate(g)
0.317
1.189
0.178
7.488
8.469
0.202
0.177
1.379
-0.074
-0.313
-0.031
18.980
△ in sugar(g)
0.278
0.247
0.137
6.723
4.173
0.028
0.034
1.084
-0.045
-0.228
-0.027
12.404
△ in fat(g)
0.651
3.541
13.412
1.811
1.034
0.019
0.093
0.251
-0.028
-0.043
-0.001
20.741
△ in saturates(g)
0.416
1.341
5.516
0.302
0.209
0.005
0.026
0.108
-0.007
-0.034
0.000
7.882
△ in fibre(g)
0.009
0.132
0.019
0.944
1.811
0.018
0.018
0.036
-0.006
-0.062
0.000
2.918
△ in sodium(g)
0.013
0.157
0.074
0.010
0.040
0.001
0.004
0.005
-0.009
-0.002
0.000
0.292
Table A22: Policy simulation - other food and drinks - by income (Changes are in per capita per week terms)
Group
Other food and drinks
Dairy products
Meat and fish
Fats and eggs
Fruit
Vegetables
Grains
Prepared ready to eat foods
Sugar and preserves
Condiments and sauces
Low calorie soft drinks and juices
Alcoholic beverages
Total
£0 - £29,999
△ in share
0.001
0.004
0.002
0.005
0.005
0.002
0.000
0.000
0.001
0.002
0.014
0.036
△ in expenditure (£)
0.029
0.117
0.058
0.131
0.145
0.051
-0.008
0.013
0.033
0.053
0.409
1.032
△ in quantity (Kg)
0.008
0.015
0.021
0.036
0.060
0.018
-0.002
0.002
0.003
0.007
0.034
0.202
△ in energy (kcal)
13.493
27.801
101.447
31.566
36.261
49.647
-2.713
7.926
4.002
4.152
41.669
315.251
△ in protein(g)
0.748
3.029
0.677
0.560
1.389
1.508
-0.127
0.105
0.080
0.132
0.033
8.134
△ in carbohydrate(g)
0.477
0.505
0.146
5.007
5.938
8.669
-0.251
1.215
0.482
0.683
0.502
23.373
△ in sugar(g)
0.405
0.101
0.100
4.589
2.537
1.205
-0.047
0.920
0.287
0.479
0.415
10.992
△ in fat(g)
0.948
1.515
10.929
1.053
0.659
0.853
-0.130
0.289
0.182
0.101
0.012
16.412
△ in saturates(g)
0.605
0.572
4.320
0.193
0.134
0.251
-0.037
0.120
0.043
0.080
0.005
6.286
△ in fibre(g)
0.012
0.060
0.017
0.616
1.277
0.763
-0.024
0.036
0.047
0.153
0.000
2.957
△ in sodium(g)
0.020
0.069
0.061
0.006
0.028
0.050
-0.006
0.006
0.063
0.004
0.002
0.304
£30,000 - £39,999
△ in share
-0.001
0.007
0.002
0.002
0.007
-0.001
-0.001
0.001
0.002
-0.001
0.021
0.039
△ in expenditure (£)
-0.018
0.197
0.054
0.058
0.184
-0.013
-0.038
0.017
0.041
-0.023
0.560
1.018
△ in quantity (Kg)
-0.005
0.024
0.019
0.015
0.070
-0.004
-0.007
0.003
0.004
-0.003
0.054
0.169
△ in energy (kcal)
-8.236
44.079
95.260
11.117
42.499
-12.231
-11.852
9.813
5.407
-1.726
55.263
229.394
△ in protein(g)
-0.454
4.985
0.616
0.198
1.706
-0.370
-0.558
0.137
0.106
-0.061
0.068
6.373
△ in carbohydrate(g)
-0.278
0.712
0.133
1.849
6.640
-2.131
-1.112
1.451
0.586
-0.276
0.885
8.459
△ in sugar(g)
-0.238
0.142
0.095
1.713
2.947
-0.292
-0.222
1.103
0.341
-0.202
0.670
6.056
△ in fat(g)
-0.586
2.362
10.268
0.334
0.862
-0.213
-0.556
0.375
0.276
-0.042
0.019
13.100
△ in saturates(g)
-0.374
0.893
4.209
0.060
0.165
-0.059
-0.163
0.158
0.061
-0.032
0.009
4.927
△ in fibre(g)
-0.008
0.087
0.015
0.242
1.511
-0.195
-0.112
0.049
0.064
-0.069
0.000
1.586
△ in sodium(g)
-0.012
0.105
0.053
0.003
0.037
-0.012
-0.027
0.007
0.065
-0.002
0.004
0.222
£40,000 - £49,999
△ in share
0.007
0.002
0.002
0.004
0.006
-0.001
-0.004
-0.001
0.001
-0.001
0.013
0.028
△ in expenditure (£)
0.185
0.065
0.052
0.095
0.161
-0.027
-0.103
-0.021
0.018
-0.014
0.331
0.743
△ in quantity (Kg)
0.046
0.008
0.017
0.022
0.059
-0.009
-0.017
-0.003
0.002
-0.002
0.033
0.157
△ in energy (kcal)
80.293
13.925
86.389
18.244
36.539
-23.667
-29.934
-10.462
2.178
-0.879
39.680
212.307
△ in protein(g)
4.581
1.575
0.500
0.320
1.379
-0.714
-1.422
-0.133
0.041
-0.032
0.040
6.134
△ in carbohydrate(g)
2.730
0.217
0.102
2.985
5.589
-4.111
-2.800
-1.584
0.228
-0.138
0.547
3.765
△ in sugar(g)
2.323
0.046
0.067
2.757
2.522
-0.592
-0.567
-1.237
0.138
-0.102
0.421
5.778
△ in fat(g)
5.618
0.751
9.355
0.569
0.839
-0.423
-1.403
-0.389
0.116
-0.022
0.013
15.023
△ in saturates(g)
3.574
0.281
3.726
0.106
0.169
-0.124
-0.404
-0.160
0.023
-0.016
0.006
7.182
△ in fibre(g)
0.083
0.028
0.014
0.385
1.266
-0.362
-0.285
-0.048
0.026
-0.038
0.000
1.068
△ in sodium(g)
0.122
0.034
0.049
0.004
0.031
-0.022
-0.065
-0.006
0.027
-0.001
0.002
0.174
Table A23: Policy simulation - other food and drinks - by income (cont.) (Changes are in per capita per week terms)
Group
Other food and drinks
Dairy products
Meat and fish
Fats and eggs
Fruit
Vegetables
Grains
Prepared ready to eat foods
Sugar and preserves
Condiments and sauces
Low calorie soft drinks and juices
Alcoholic beverages
Total
£50,000 - £59,999
△ in share
0.009
0.002
0.002
0.005
0.011
0.009
-0.002
0.000
0.005
0.000
0.001
0.043
△ in expenditure (£)
0.231
0.052
0.062
0.135
0.283
0.228
-0.056
0.012
0.121
-0.005
0.027
1.093
△ in quantity (Kg)
0.057
0.006
0.021
0.031
0.098
0.063
-0.009
0.002
0.010
-0.001
0.003
0.281
△ in energy (kcal)
102.254
11.157
100.527
23.851
59.038
172.987
-16.204
6.698
14.777
-0.281
3.232
478.036
△ in protein(g)
5.775
1.245
0.667
0.384
2.418
5.126
-0.781
0.091
0.262
-0.009
0.003
15.179
△ in carbohydrate(g)
3.527
0.197
0.129
4.165
8.703
30.425
-1.490
1.007
1.654
-0.047
0.038
48.308
△ in sugar(g)
2.974
0.043
0.087
3.856
3.744
4.431
-0.292
0.766
1.080
-0.035
0.031
16.684
△ in fat(g)
7.173
0.598
10.832
0.625
1.407
2.935
-0.766
0.254
0.743
-0.006
0.001
23.796
△ in saturates(g)
4.563
0.226
4.425
0.140
0.284
0.846
-0.217
0.104
0.154
-0.005
0.000
10.519
△ in fibre(g)
0.103
0.024
0.017
0.519
2.130
2.673
-0.156
0.032
0.171
-0.011
0.000
5.500
△ in sodium(g)
0.152
0.028
0.060
0.008
0.054
0.165
-0.034
0.004
0.162
0.000
0.000
0.599
£60,000 - over
△ in share
0.009
-0.002
0.004
0.014
0.007
0.002
-0.005
0.001
0.002
0.003
0.005
0.040
△ in expenditure (£)
0.244
-0.057
0.093
0.357
0.173
0.059
-0.121
0.026
0.045
0.090
0.126
1.036
△ in quantity (Kg)
0.059
-0.006
0.031
0.080
0.056
0.018
-0.018
0.003
0.004
0.011
0.012
0.249
△ in energy (kcal)
101.460
-11.107
144.915
72.089
33.089
52.228
-30.943
11.259
5.463
5.257
12.792
396.502
△ in protein(g)
5.724
-1.307
1.054
1.381
1.226
1.549
-1.545
0.159
0.101
0.220
0.014
8.578
△ in carbohydrate(g)
3.402
-0.154
0.167
10.345
4.738
9.089
-2.789
1.589
0.569
0.857
0.169
27.984
△ in sugar(g)
2.963
-0.040
0.111
9.459
2.317
1.409
-0.612
1.215
0.357
0.621
0.136
17.937
△ in fat(g)
7.173
-0.582
15.593
2.772
0.925
0.912
-1.456
0.471
0.284
0.113
0.003
26.208
△ in saturates(g)
4.564
-0.213
5.992
0.489
0.182
0.248
-0.429
0.190
0.052
0.080
0.002
11.156
△ in fibre(g)
0.102
-0.021
0.021
1.566
1.210
0.872
-0.307
0.057
0.073
0.346
0.000
3.919
△ in sodium(g)
0.147
-0.027
0.072
0.028
0.025
0.043
-0.068
0.007
0.064
0.005
0.001
0.297
Table A24: Policy simulation - other food and drinks - by life stage (Changes are in per capita per week terms)
Group
Other food and drinks
Dairy products
Meat and fish
Fats and eggs
Fruit
Vegetables
Grains
Prepared ready to eat foods
Sugar and preserves
Condiments and sauces
Low calorie soft drinks and juices
Alcoholic beverages
Total
Pre-family
△ in share
0.005
0.008
0.001
0.007
0.003
0.002
0.007
0.001
0.000
0.001
0.010
0.046
△ in expenditure (£)
0.139
0.213
0.037
0.205
0.081
0.070
0.210
0.033
0.001
0.030
0.289
1.308
△ in quantity (Kg)
0.037
0.026
0.014
0.051
0.028
0.022
0.035
0.005
0.000
0.004
0.029
0.252
△ in energy (kcal)
62.677
46.318
60.820
44.797
17.558
58.572
62.652
20.021
0.142
2.015
32.090
407.662
△ in protein(g)
3.663
5.437
0.492
0.804
0.717
1.794
2.947
0.336
0.003
0.065
0.040
16.299
△ in carbohydrate(g)
2.114
0.800
0.075
6.539
2.615
10.122
5.930
2.731
0.015
0.339
0.629
31.908
△ in sugar(g)
1.806
0.178
0.049
6.004
1.266
1.379
1.114
2.041
0.008
0.250
0.471
14.567
△ in fat(g)
4.363
2.363
6.522
1.716
0.402
1.048
2.911
0.857
0.007
0.044
0.019
20.253
△ in saturates(g)
2.774
0.877
2.387
0.309
0.078
0.304
0.839
0.313
0.002
0.035
0.009
7.926
△ in fibre(g)
0.066
0.099
0.010
0.896
0.623
0.919
0.613
0.109
0.002
0.065
0.000
3.400
△ in sodium(g)
0.097
0.114
0.033
0.016
0.017
0.056
0.139
0.012
0.002
0.002
0.002
0.489
Young family
△ in share
0.007
0.006
0.004
0.006
0.010
0.005
-0.006
0.001
0.002
0.001
0.013
0.048
△ in expenditure (£)
0.129
0.108
0.066
0.100
0.186
0.094
-0.109
0.022
0.028
0.010
0.234
0.868
△ in quantity (Kg)
0.033
0.014
0.026
0.025
0.075
0.032
-0.020
0.003
0.003
0.002
0.025
0.218
△ in energy (kcal)
59.257
27.067
122.552
21.134
46.133
88.491
-40.791
10.293
4.152
0.691
24.392
363.371
△ in protein(g)
3.334
3.001
0.860
0.354
1.786
2.542
-1.817
0.149
0.079
0.022
0.039
10.350
△ in carbohydrate(g)
2.155
0.432
0.183
3.429
7.048
15.713
-3.983
1.471
0.453
0.108
0.438
27.445
△ in sugar(g)
1.772
0.095
0.121
3.131
3.212
2.370
-0.636
1.114
0.274
0.085
0.308
11.846
△ in fat(g)
4.111
1.478
13.198
0.677
1.038
1.474
-1.896
0.417
0.211
0.017
0.009
20.733
△ in saturates(g)
2.616
0.556
5.076
0.123
0.210
0.441
-0.527
0.155
0.042
0.012
0.004
8.709
△ in fibre(g)
0.065
0.052
0.021
0.435
1.642
1.268
-0.359
0.051
0.052
0.021
0.000
3.248
△ in sodium(g)
0.089
0.066
0.070
0.005
0.039
0.082
-0.079
0.006
0.047
0.001
0.002
0.327
Middle family
△ in share
0.002
0.013
0.002
0.001
0.007
0.002
0.009
0.000
0.001
0.001
-0.009
0.029
△ in expenditure (£)
0.049
0.251
0.046
0.012
0.133
0.045
0.176
0.009
0.011
0.013
-0.175
0.569
△ in quantity (Kg)
0.013
0.032
0.018
0.003
0.051
0.015
0.031
0.001
0.001
0.002
-0.019
0.148
△ in energy (kcal)
22.865
61.010
85.214
2.285
31.307
41.556
60.962
3.802
1.674
0.876
-17.569
293.982
△ in protein(g)
1.277
6.626
0.573
0.038
1.259
1.179
2.798
0.049
0.030
0.028
-0.021
13.837
△ in carbohydrate(g)
0.824
1.136
0.114
0.391
4.765
7.350
5.738
0.544
0.178
0.147
-0.396
20.791
△ in sugar(g)
0.684
0.242
0.075
0.363
2.052
1.168
1.028
0.420
0.112
0.112
-0.331
5.922
△ in fat(g)
1.594
3.326
9.197
0.065
0.688
0.717
2.897
0.157
0.088
0.018
-0.008
18.740
△ in saturates(g)
1.018
1.245
3.761
0.014
0.137
0.217
0.828
0.062
0.019
0.014
-0.004
7.311
△ in fibre(g)
0.023
0.135
0.015
0.048
1.095
0.586
0.540
0.018
0.020
0.034
0.000
2.514
△ in sodium(g)
0.034
0.152
0.052
0.001
0.028
0.039
0.119
0.002
0.017
0.001
-0.001
0.441
Table A25: Policy simulation - other food and drinks - by life stage (cont.) (Changes are in per capita per week terms)
Group
Other food and drinks
Dairy products
Meat and fish
Fats and eggs
Fruit
Vegetables
Grains
Prepared ready to eat foods
Sugar and preserves
Condiments and sauces
Low calorie soft drinks and juices
Alcoholic beverages
Total
Older family
△ in share
-0.005
0.011
0.002
0.000
0.004
0.001
0.000
0.001
0.001
0.003
0.015
0.032
△ in expenditure (£)
-0.101
0.216
0.033
0.007
0.071
0.013
-0.008
0.012
0.027
0.062
0.305
0.635
△ in quantity (Kg)
-0.028
0.029
0.012
0.002
0.031
0.004
-0.001
0.002
0.003
0.009
0.033
0.094
△ in energy (kcal)
-50.138
54.015
60.975
1.566
18.609
11.392
-2.750
6.047
3.832
4.638
37.535
145.723
△ in protein(g)
-2.860
6.016
0.333
0.029
0.766
0.332
-0.127
0.080
0.070
0.148
0.035
4.821
△ in carbohydrate(g)
-1.750
0.982
0.081
0.241
2.908
2.001
-0.259
0.905
0.448
0.779
0.554
6.890
△ in sugar(g)
-1.447
0.192
0.053
0.222
1.111
0.303
-0.045
0.682
0.287
0.535
0.431
2.326
△ in fat(g)
-3.490
2.886
6.609
0.055
0.364
0.198
-0.130
0.229
0.183
0.108
0.014
7.027
△ in saturates(g)
-2.232
1.099
2.509
0.010
0.074
0.061
-0.036
0.093
0.037
0.086
0.007
1.709
△ in fibre(g)
-0.044
0.109
0.011
0.031
0.669
0.162
-0.024
0.026
0.044
0.193
0.000
1.178
△ in sodium(g)
-0.078
0.138
0.037
0.000
0.018
0.011
-0.006
0.004
0.051
0.004
0.002
0.182
45+ no children
△ in share
0.002
0.002
0.002
0.004
0.005
0.001
-0.003
0.000
0.002
0.001
0.015
0.031
△ in expenditure (£)
0.055
0.067
0.052
0.127
0.167
0.023
-0.081
0.002
0.051
0.038
0.476
0.977
△ in quantity (Kg)
0.015
0.008
0.018
0.033
0.066
0.008
-0.014
0.000
0.004
0.004
0.037
0.180
△ in energy (kcal)
24.752
14.846
86.438
28.119
39.401
22.338
-23.897
1.194
5.710
2.854
46.133
247.887
△ in protein(g)
1.354
1.631
0.551
0.505
1.480
0.690
-1.150
0.015
0.113
0.097
0.036
5.322
△ in carbohydrate(g)
0.854
0.254
0.121
4.566
6.433
3.881
-2.169
0.188
0.683
0.462
0.514
15.786
△ in sugar(g)
0.738
0.051
0.084
4.198
2.757
0.525
-0.446
0.143
0.407
0.324
0.425
9.206
△ in fat(g)
1.758
0.811
9.320
0.888
0.744
0.386
-1.145
0.042
0.261
0.071
0.011
13.147
△ in saturates(g)
1.121
0.306
3.785
0.163
0.150
0.109
-0.331
0.018
0.061
0.055
0.005
5.442
△ in fibre(g)
0.022
0.031
0.014
0.573
1.390
0.361
-0.223
0.005
0.067
0.119
0.000
2.360
△ in sodium(g)
0.036
0.036
0.051
0.006
0.029
0.022
-0.055
0.001
0.092
0.003
0.002
0.223
7.5.3 Take home confectionery
Table A26: Policy simulation - take home confectionery (Changes are in per capita per week terms)
Group
Category
Total
Chocolate confectionery
Egg, novelty and seasonal sweets
Sugar confectionery
Other confectionery
Private label
Branded
Private label
Branded
All in sample
△ in share
0.000
-0.006
0.000
-0.001
-0.001
0
-0.008
△ in expenditure (£)
-0.009
-0.161
-0.013
-0.014
-0.027
0.007
-0.217
△ in quantity (Kg)
-0.003
-0.037
-0.007
-0.016
-0.023
0.002
-0.084
△ in energy (kcal)
-14.403
-190.083
-37.052
-62.109
-85.422
4.23
-384.838
△ in protein(g)
-0.171
-2.191
-0.448
-0.385
-0.659
0.024
-3.830
△ in carbohydrate(g)
-1.520
-22.201
-4.203
-13.515
-18.680
1.283
-58.836
△ in sugar(g)
-1.348
-20.12
-3.944
-10.108
-14.504
0.18
-49.843
△ in fat(g)
-0.829
-10.095
-2.033
-0.745
-0.892
0.067
-14.527
△ in saturates(g)
-0.478
-5.873
-1.215
-0.423
-0.551
0.041
-8.500
△ in fibre(g)
-0.089
-0.711
-0.116
-0.068
-0.100
0.018
-1.066
△ in sodium(g)
-0.002
-0.042
-0.007
-0.016
-0.020
0.001
-0.086
Table A27: Policy simulation - take home confectionery - by
SIMD (Changes are in per capita per week terms)
Group
Category
Total
Chocolate confectionery
Egg, novelty and seasonal sweets
Sugar confectionery
Other confectionery
Private label
Branded
Private label
Branded
SIMD 1
△ in share
-0.001
-0.007
-0.001
-0.001
-0.001
0.000
-0.010
△ in expenditure (£)
-0.017
-0.185
-0.019
-0.020
-0.022
0.011
-0.253
△ in quantity (Kg)
-0.006
-0.051
-0.011
-0.025
-0.020
0.003
-0.109
△ in energy (kcal)
-29.769
-256.233
-58.902
-94.727
-73.460
6.777
-506.313
△ in protein(g)
-0.347
-2.959
-0.707
-0.537
-0.530
0.032
-5.048
△ in carbohydrate(g)
-3.272
-30.762
-6.802
-20.907
-16.412
2.156
-75.999
△ in sugar(g)
-2.902
-27.699
-6.367
-15.622
-12.781
0.240
-65.131
△ in fat(g)
-1.662
-13.258
-3.173
-1.054
-0.627
0.103
-19.671
△ in saturates(g)
-0.950
-7.666
-1.908
-0.613
-0.383
0.060
-11.461
△ in fibre(g)
-0.151
-0.899
-0.176
-0.093
-0.082
0.031
-1.369
△ in sodium(g)
-0.006
-0.059
-0.011
-0.023
-0.016
0.001
-0.114
SIMD 2
△ in share
0.000
-0.006
0.000
0.000
-0.001
0.000
-0.008
△ in expenditure (£)
-0.005
-0.177
-0.010
-0.010
-0.032
0.001
-0.234
△ in quantity (Kg)
-0.002
-0.043
-0.006
-0.012
-0.027
0.000
-0.089
△ in energy (kcal)
-8.142
-217.644
-29.497
-45.124
-103.050
0.417
-403.040
△ in protein(g)
-0.095
-2.471
-0.360
-0.282
-0.734
0.002
-3.939
△ in carbohydrate(g)
-0.847
-25.567
-3.325
-10.043
-22.361
0.126
-62.017
△ in sugar(g)
-0.753
-23.132
-3.134
-7.533
-17.378
0.021
-51.910
△ in fat(g)
-0.475
-11.506
-1.625
-0.451
-1.175
0.006
-15.226
△ in saturates(g)
-0.272
-6.738
-0.975
-0.254
-0.700
0.004
-8.936
△ in fibre(g)
-0.052
-0.816
-0.092
-0.055
-0.128
0.002
-1.142
△ in sodium(g)
-0.001
-0.049
-0.005
-0.010
-0.027
0.000
-0.092
SIMD 3
△ in share
0.000
-0.006
-0.001
0.000
-0.001
0.000
-0.008
△ in expenditure (£)
-0.009
-0.169
-0.014
-0.012
-0.024
0.004
-0.225
△ in quantity (Kg)
-0.003
-0.040
-0.008
-0.014
-0.020
0.001
-0.085
△ in energy (kcal)
-14.897
-207.370
-41.569
-54.873
-76.648
2.610
-392.748
△ in protein(g)
-0.179
-2.411
-0.501
-0.353
-0.573
0.020
-3.996
△ in carbohydrate(g)
-1.586
-23.998
-4.748
-12.066
-16.648
0.698
-58.348
△ in sugar(g)
-1.430
-21.802
-4.440
-8.858
-12.852
0.145
-49.238
△ in fat(g)
-0.855
-11.110
-2.277
-0.591
-0.865
0.056
-15.641
△ in saturates(g)
-0.494
-6.442
-1.360
-0.348
-0.516
0.033
-9.127
△ in fibre(g)
-0.087
-0.769
-0.133
-0.052
-0.085
0.012
-1.113
△ in sodium(g)
-0.003
-0.045
-0.008
-0.012
-0.017
0.001
-0.084
Table A28: Policy simulation - take home confectionery - by
SIMD (cont.) (Changes are in per capita per week terms)
Group
Category
Total
Chocolate confectionery
Egg, novelty and seasonal sweets
Sugar confectionery
Other confectionery
Private label
Branded
Private label
Branded
SIMD 4
△ in share
0.000
-0.005
0.000
-0.001
-0.001
0.000
-0.007
△ in expenditure (£)
-0.010
-0.134
-0.008
-0.016
-0.031
0.009
-0.189
△ in quantity (Kg)
-0.003
-0.029
-0.004
-0.019
-0.027
0.003
-0.078
△ in energy (kcal)
-13.992
-147.758
-22.326
-72.187
-97.807
6.120
-347.951
△ in protein(g)
-0.168
-1.706
-0.265
-0.461
-0.839
0.033
-3.407
△ in carbohydrate(g)
-1.440
-17.084
-2.552
-15.234
-21.843
1.854
-56.299
△ in sugar(g)
-1.266
-15.527
-2.389
-11.505
-16.832
0.231
-47.288
△ in fat(g)
-0.818
-7.913
-1.218
-1.062
-0.780
0.103
-11.689
△ in saturates(g)
-0.474
-4.599
-0.723
-0.591
-0.478
0.064
-6.800
△ in fibre(g)
-0.094
-0.570
-0.069
-0.079
-0.115
0.020
-0.907
△ in sodium(g)
-0.002
-0.032
-0.004
-0.022
-0.022
0.002
-0.081
SIMD 5
△ in share
0.000
-0.005
0.000
0.000
-0.001
0.000
-0.007
△ in expenditure (£)
-0.011
-0.143
-0.012
-0.013
-0.029
0.009
-0.200
△ in quantity (Kg)
-0.003
-0.029
-0.006
-0.015
-0.024
0.003
-0.075
△ in energy (kcal)
-14.677
-150.083
-32.732
-58.664
-92.649
5.604
-343.201
△ in protein(g)
-0.177
-1.741
-0.405
-0.359
-0.800
0.036
-3.446
△ in carbohydrate(g)
-1.557
-17.195
-3.609
-12.679
-19.634
1.808
-52.866
△ in sugar(g)
-1.364
-15.644
-3.402
-9.511
-15.421
0.184
-45.156
△ in fat(g)
-0.840
-8.110
-1.834
-0.731
-1.209
0.065
-12.659
△ in saturates(g)
-0.489
-4.732
-1.096
-0.407
-0.828
0.041
-7.511
△ in fibre(g)
-0.094
-0.587
-0.107
-0.072
-0.111
0.025
-0.947
△ in sodium(g)
-0.002
-0.032
-0.006
-0.014
-0.021
0.001
-0.074
Table A29: Policy simulation - take home confectionery - by rural urban (Changes are in per capita per week terms)
Group
Category
Total
Chocolate confectionery
Egg, noveltyandseasonalsweets
Sugar confectionery
Otherconfectionery
Privatelabel
Branded
Privatelabel
Branded
Lg. Urb. Areas
△ in share
0.000
-0.007
0.000
0.000
-0.001
0.000
-0.008
△ in expenditure (£)
-0.008
-0.180
-0.012
-0.012
-0.030
0.013
-0.230
△ in quantity (Kg)
-0.002
-0.043
-0.007
-0.014
-0.026
0.004
-0.087
△ in energy (kcal)
-11.700
-217.646
-34.810
-51.914
-97.536
8.682
-404.924
△ in protein(g)
-0.136
-2.530
-0.418
-0.350
-0.690
0.047
-4.076
△ in carbohydrate(g)
-1.205
-25.438
-3.950
-11.236
-21.562
2.729
-60.662
△ in sugar(g)
-1.069
-23.096
-3.706
-8.463
-16.817
0.340
-52.810
△ in fat(g)
-0.688
-11.537
-1.907
-0.631
-0.941
0.123
-15.579
△ in saturates(g)
-0.403
-6.722
-1.138
-0.354
-0.579
0.074
-9.123
△ in fibre(g)
-0.074
-0.801
-0.108
-0.055
-0.111
0.027
-1.122
△ in sodium(g)
-0.002
-0.048
-0.006
-0.014
-0.024
0.002
-0.092
Oth. Urb. Areas
△ in share
0.000
-0.006
-0.001
-0.001
-0.001
0.000
-0.008
△ in expenditure (£)
-0.010
-0.155
-0.017
-0.015
-0.025
0.003
-0.219
△ in quantity (Kg)
-0.003
-0.037
-0.009
-0.019
-0.021
0.001
-0.088
△ in energy (kcal)
-15.365
-188.114
-48.534
-70.458
-78.746
1.732
-399.486
△ in protein(g)
-0.185
-2.156
-0.593
-0.448
-0.647
0.011
-4.019
△ in carbohydrate(g)
-1.639
-21.987
-5.482
-15.447
-17.060
0.512
-61.104
△ in sugar(g)
-1.455
-19.915
-5.150
-11.549
-13.223
0.076
-51.217
△ in fat(g)
-0.879
-9.987
-2.673
-0.805
-0.872
0.030
-15.186
△ in saturates(g)
-0.502
-5.800
-1.605
-0.457
-0.548
0.018
-8.894
△ in fibre(g)
-0.091
-0.693
-0.152
-0.079
-0.096
0.008
-1.103
△ in sodium(g)
-0.003
-0.042
-0.009
-0.016
-0.018
0.000
-0.087
Ac. Sm. Towns
△ in share
0.000
-0.006
0.000
-0.001
-0.001
0.000
-0.008
△ in expenditure (£)
-0.002
-0.148
-0.011
-0.015
-0.028
0.001
-0.203
△ in quantity (Kg)
-0.001
-0.034
-0.006
-0.018
-0.023
0.000
-0.082
△ in energy (kcal)
-3.536
-173.742
-33.151
-70.214
-87.313
0.723
-367.233
△ in protein(g)
-0.043
-1.999
-0.402
-0.358
-0.670
0.004
-3.467
△ in carbohydrate(g)
-0.375
-20.317
-3.733
-15.533
-18.999
0.204
-58.753
△ in sugar(g)
-0.330
-18.385
-3.504
-11.418
-14.639
0.039
-48.236
△ in fat(g)
-0.200
-9.222
-1.830
-0.748
-0.977
0.014
-12.963
△ in saturates(g)
-0.116
-5.336
-1.093
-0.434
-0.580
0.009
-7.551
△ in fibre(g)
-0.023
-0.652
-0.105
-0.074
-0.101
0.005
-0.950
△ in sodium(g)
-0.001
-0.038
-0.006
-0.016
-0.019
0.000
-0.080
Table A30: Policy simulation - take home confectionery - by rural urban (cont.) (Changes are in per capita per week terms)
Group
Category
Total
Chocolate confectionery
Egg, novelty and seasonal sweets
Sugar confectionery
Other confectionery
Private label
Branded
Private label
Branded
Rm. Sm. Towns
△ in share
-0.001
-0.007
-0.001
0.000
-0.001
0.000
-0.010
△ in expenditure (£)
-0.018
-0.207
-0.017
-0.012
-0.028
-0.001
-0.283
△ in quantity (Kg)
-0.006
-0.050
-0.010
-0.014
-0.024
0.000
-0.104
△ in energy (kcal)
-28.798
-254.950
-52.659
-54.294
-90.134
-0.462
-481.297
△ in protein(g)
-0.320
-2.971
-0.616
-0.276
-0.569
-0.002
-4.754
△ in carbohydrate(g)
-3.309
-30.440
-6.098
-12.248
-19.036
-0.154
-71.285
△ in sugar(g)
-2.936
-27.549
-5.748
-9.419
-14.910
-0.021
-60.584
△ in fat(g)
-1.545
-13.263
-2.837
-0.481
-1.291
-0.005
-19.422
△ in saturates(g)
-0.910
-7.842
-1.691
-0.277
-0.767
-0.003
-11.489
△ in fibre(g)
-0.178
-0.903
-0.166
-0.053
-0.097
-0.002
-1.400
△ in sodium(g)
-0.005
-0.060
-0.010
-0.011
-0.023
0.000
-0.109
Ac. Rural
△ in share
0.000
-0.005
0.000
0.000
-0.001
0.000
-0.007
△ in expenditure (£)
-0.010
-0.146
-0.008
-0.009
-0.026
0.011
-0.187
△ in quantity (Kg)
-0.003
-0.031
-0.004
-0.010
-0.021
0.003
-0.066
△ in energy (kcal)
-14.912
-155.876
-21.878
-38.545
-77.947
7.010
-302.148
△ in protein(g)
-0.182
-1.750
-0.267
-0.219
-0.627
0.033
-3.012
△ in carbohydrate(g)
-1.553
-18.255
-2.484
-8.095
-17.405
2.195
-45.596
△ in sugar(g)
-1.372
-16.539
-2.329
-5.991
-13.459
0.244
-39.446
△ in fat(g)
-0.866
-8.282
-1.201
-0.597
-0.636
0.106
-11.476
△ in saturates(g)
-0.493
-4.854
-0.713
-0.338
-0.398
0.069
-6.727
△ in fibre(g)
-0.092
-0.620
-0.068
-0.043
-0.091
0.023
-0.891
△ in sodium(g)
-0.003
-0.034
-0.004
-0.012
-0.018
0.002
-0.069
Rm. Rural
△ in share
-0.001
-0.005
0.000
-0.001
-0.001
0.000
-0.008
△ in expenditure (£)
-0.029
-0.153
-0.004
-0.018
-0.043
0.004
-0.244
△ in quantity (Kg)
-0.010
-0.034
-0.002
-0.022
-0.038
0.001
-0.106
△ in energy (kcal)
-52.647
-175.533
-12.549
-83.400
-139.424
2.243
-461.310
△ in protein(g)
-0.638
-2.095
-0.147
-0.549
-1.009
0.014
-4.422
△ in carbohydrate(g)
-5.677
-19.869
-1.461
-18.775
-31.210
0.672
-76.320
△ in sugar(g)
-5.051
-17.968
-1.357
-14.084
-24.432
0.097
-62.794
△ in fat(g)
-2.969
-9.574
-0.674
-0.708
-1.184
0.033
-15.075
△ in saturates(g)
-1.689
-5.508
-0.396
-0.418
-0.705
0.021
-8.695
△ in fibre(g)
-0.364
-0.726
-0.042
-0.090
-0.144
0.013
-1.353
△ in sodium(g)
-0.009
-0.038
-0.002
-0.022
-0.029
0.001
-0.100
Table A31: Policy simulation - take home confectionery - by income (Changes are in per capita per week terms)
Group
Category
Total
Chocolate confectionery
Egg, novelty and seasonal sweets
Sugar confectionery
Other confectionery
Private label
Branded
Private label
Branded
£0 - £29,999
△ in share
0.000
-0.006
-0.001
0.000
-0.001
0.000
-0.009
△ in expenditure (£)
-0.010
-0.181
-0.015
-0.014
-0.030
0.008
-0.244
△ in quantity (Kg)
-0.003
-0.043
-0.009
-0.017
-0.026
0.002
-0.096
△ in energy (kcal)
-16.605
-221.193
-45.022
-65.067
-99.069
4.882
-442.074
△ in protein(g)
-0.195
-2.551
-0.544
-0.372
-0.727
0.027
-4.361
△ in carbohydrate(g)
-1.764
-25.899
-5.118
-14.193
-21.677
1.482
-67.169
△ in sugar(g)
-1.563
-23.468
-4.801
-10.617
-16.797
0.197
-57.049
△ in fat(g)
-0.953
-11.720
-2.467
-0.788
-1.051
0.080
-16.898
△ in saturates(g)
-0.548
-6.817
-1.474
-0.446
-0.635
0.049
-9.871
△ in fibre(g)
-0.100
-0.821
-0.142
-0.070
-0.113
0.021
-1.224
△ in sodium(g)
-0.003
-0.049
-0.008
-0.016
-0.024
0.001
-0.100
£30,000 - £39,999
△ in share
0.000
-0.005
0.000
0.000
-0.001
0.000
-0.007
△ in expenditure (£)
-0.007
-0.132
-0.009
-0.009
-0.021
0.003
-0.174
△ in quantity (Kg)
-0.002
-0.030
-0.005
-0.010
-0.017
0.001
-0.064
△ in energy (kcal)
-10.274
-155.641
-27.487
-39.139
-63.528
1.907
-294.163
△ in protein(g)
-0.124
-1.777
-0.337
-0.237
-0.506
0.013
-2.968
△ in carbohydrate(g)
-1.118
-18.093
-3.082
-8.641
-14.083
0.547
-44.469
△ in sugar(g)
-1.000
-16.438
-2.896
-6.443
-10.989
0.095
-37.671
△ in fat(g)
-0.577
-8.305
-1.516
-0.408
-0.558
0.034
-11.328
△ in saturates(g)
-0.339
-4.857
-0.905
-0.245
-0.346
0.020
-6.672
△ in fibre(g)
-0.059
-0.582
-0.087
-0.043
-0.075
0.009
-0.837
△ in sodium(g)
-0.002
-0.034
-0.005
-0.009
-0.013
0.000
-0.062
£40,000 - £49,999
△ in share
0.000
-0.005
0.000
-0.001
-0.001
0.000
-0.007
△ in expenditure (£)
-0.012
-0.138
-0.008
-0.018
-0.023
0.005
-0.194
△ in quantity (Kg)
-0.003
-0.031
-0.004
-0.021
-0.019
0.002
-0.077
△ in energy (kcal)
-16.795
-158.377
-22.228
-78.313
-70.149
3.526
-342.337
△ in protein(g)
-0.197
-1.814
-0.270
-0.583
-0.565
0.020
-3.409
△ in carbohydrate(g)
-1.759
-18.559
-2.520
-17.462
-15.592
1.101
-54.790
△ in sugar(g)
-1.573
-16.817
-2.377
-13.145
-12.049
0.172
-45.789
△ in fat(g)
-0.976
-8.393
-1.221
-0.714
-0.607
0.044
-11.867
△ in saturates(g)
-0.556
-4.871
-0.730
-0.404
-0.346
0.027
-6.880
△ in fibre(g)
-0.104
-0.589
-0.068
-0.083
-0.090
0.015
-0.919
△ in sodium(g)
-0.003
-0.035
-0.004
-0.016
-0.015
0.001
-0.072
Table A32: Policy simulation - take home confectionery - by income (cont.) (Changes are in per capita per week terms)
Group
Category
Total
Chocolate confectionery
Egg, novelty and seasonal sweets
Sugar confectionery
Other confectionery
Private label
Branded
Private label
Branded
£50,000 - £59,999
△ in share
0.000
-0.006
0.000
-0.001
-0.001
0.001
-0.007
△ in expenditure (£)
0.001
-0.158
-0.002
-0.016
-0.024
0.019
-0.180
△ in quantity (Kg)
0.000
-0.036
-0.001
-0.017
-0.020
0.005
-0.070
△ in energy (kcal)
1.255
-186.128
-5.527
-68.486
-74.523
11.491
-321.917
△ in protein(g)
0.015
-2.173
-0.066
-0.506
-0.558
0.069
-3.219
△ in carbohydrate(g)
0.134
-21.671
-0.635
-13.949
-16.761
3.506
-49.376
△ in sugar(g)
0.117
-19.562
-0.593
-10.382
-13.062
0.520
-42.960
△ in fat(g)
0.071
-9.909
-0.300
-1.184
-0.579
0.159
-11.741
△ in saturates(g)
0.042
-5.759
-0.179
-0.653
-0.365
0.100
-6.814
△ in fibre(g)
0.008
-0.706
-0.016
-0.083
-0.093
0.047
-0.844
△ in sodium(g)
0.000
-0.041
-0.001
-0.025
-0.015
0.002
-0.080
£60,000 - over
△ in share
-0.001
-0.003
-0.001
-0.001
-0.001
0.000
-0.006
△ in expenditure (£)
-0.025
-0.073
-0.023
-0.016
-0.018
0.003
-0.152
△ in quantity (Kg)
-0.006
-0.014
-0.011
-0.018
-0.014
0.001
-0.061
△ in energy (kcal)
-30.008
-71.750
-56.609
-67.011
-55.684
1.691
-279.371
△ in protein(g)
-0.381
-0.849
-0.680
-0.537
-0.636
0.007
-3.077
△ in carbohydrate(g)
-2.831
-8.129
-6.355
-14.765
-10.780
0.549
-42.311
△ in sugar(g)
-2.459
-7.355
-5.948
-11.052
-8.536
0.065
-35.284
△ in fat(g)
-1.853
-3.911
-3.148
-0.655
-1.110
0.021
-10.656
△ in saturates(g)
-1.066
-2.254
-1.891
-0.358
-0.828
0.013
-6.384
△ in fibre(g)
-0.244
-0.302
-0.184
-0.076
-0.069
0.005
-0.869
△ in sodium(g)
-0.004
-0.015
-0.010
-0.014
-0.013
0.000
-0.057
Table A33: Policy simulation - take home confectionery - by life stage (Changes are in per capita per week terms)
Group
Category
Total
Chocolate confectionery
Egg, novelty and seasonal sweets
Sugar confectionery
Other confectionery
Private label
Branded
Private label
Branded
Pre-family
△ in share
-0.001
-0.007
-0.001
0.000
-0.001
0.000
-0.009
△ in expenditure (£)
-0.015
-0.201
-0.015
-0.014
-0.024
0.004
-0.265
△ in quantity (Kg)
-0.004
-0.048
-0.008
-0.016
-0.021
0.001
-0.096
△ in energy (kcal)
-23.245
-246.232
-43.837
-59.127
-78.503
2.232
-448.711
△ in protein(g)
-0.289
-2.918
-0.531
-0.419
-0.781
0.007
-4.931
△ in carbohydrate(g)
-2.399
-28.153
-4.895
-13.409
-16.824
0.793
-64.887
△ in sugar(g)
-2.149
-25.614
-4.561
-9.892
-12.954
0.057
-55.112
△ in fat(g)
-1.358
-13.312
-2.438
-0.430
-0.881
0.018
-18.401
△ in saturates(g)
-0.770
-7.766
-1.445
-0.261
-0.639
0.011
-10.871
△ in fibre(g)
-0.156
-0.900
-0.142
-0.051
-0.095
0.007
-1.337
△ in sodium(g)
-0.004
-0.055
-0.008
-0.011
-0.015
0.000
-0.093
Young family
△ in share
-0.001
-0.007
-0.001
-0.001
-0.001
0.000
-0.010
△ in expenditure (£)
-0.014
-0.127
-0.012
-0.010
-0.022
-0.002
-0.187
△ in quantity (Kg)
-0.005
-0.030
-0.007
-0.012
-0.018
0.000
-0.073
△ in energy (kcal)
-26.633
-154.863
-37.597
-44.211
-67.310
-1.061
-331.673
△ in protein(g)
-0.315
-1.823
-0.460
-0.331
-0.489
-0.008
-3.426
△ in carbohydrate(g)
-2.871
-17.942
-4.216
-9.999
-15.256
-0.321
-50.605
△ in sugar(g)
-2.578
-16.281
-3.960
-7.518
-11.785
-0.050
-42.173
△ in fat(g)
-1.512
-8.279
-2.082
-0.323
-0.465
-0.014
-12.675
△ in saturates(g)
-0.854
-4.801
-1.256
-0.172
-0.295
-0.008
-7.386
△ in fibre(g)
-0.151
-0.563
-0.121
-0.056
-0.083
-0.006
-0.979
△ in sodium(g)
-0.005
-0.035
-0.007
-0.007
-0.013
0.000
-0.067
Middle family
△ in share
-0.001
-0.008
-0.001
-0.001
-0.002
0.000
-0.011
△ in expenditure (£)
-0.011
-0.157
-0.011
-0.014
-0.033
-0.001
-0.227
△ in quantity (Kg)
-0.004
-0.044
-0.006
-0.016
-0.029
0.000
-0.099
△ in energy (kcal)
-18.569
-224.894
-31.562
-59.512
-107.253
-0.886
-442.677
△ in protein(g)
-0.225
-2.657
-0.385
-0.404
-0.747
-0.006
-4.424
△ in carbohydrate(g)
-2.014
-26.149
-3.573
-13.502
-24.133
-0.269
-69.641
△ in sugar(g)
-1.804
-23.837
-3.356
-10.145
-18.969
-0.042
-58.153
△ in fat(g)
-1.046
-11.982
-1.736
-0.433
-0.850
-0.014
-16.061
△ in saturates(g)
-0.603
-6.935
-1.033
-0.253
-0.518
-0.008
-9.350
△ in fibre(g)
-0.097
-0.799
-0.100
-0.066
-0.121
-0.004
-1.186
△ in sodium(g)
-0.004
-0.053
-0.006
-0.010
-0.020
0.000
-0.092
Table A34: Policy simulation - take home confectionery - by life stage (cont.) (Changes are in per capita per week terms)
Group
Category
Total
Chocolate confectionery
Egg, novelty and seasonal sweets
Sugar confectionery
Other confectionery
Private label
Branded
Private label
Branded
Older family
△ in share
0.000
-0.005
-0.001
0.000
-0.001
0.000
-0.007
△ in expenditure (£)
0.001
-0.095
-0.013
-0.009
-0.023
0.009
-0.131
△ in quantity (Kg)
0.000
-0.026
-0.007
-0.011
-0.020
0.003
-0.061
△ in energy (kcal)
1.923
-134.549
-36.468
-42.237
-74.401
6.868
-278.865
△ in protein(g)
0.024
-1.616
-0.431
-0.235
-0.549
0.038
-2.768
△ in carbohydrate(g)
0.201
-15.620
-4.170
-9.372
-16.506
2.019
-43.448
△ in sugar(g)
0.177
-14.184
-3.893
-7.039
-12.845
0.346
-37.438
△ in fat(g)
0.111
-7.169
-1.990
-0.442
-0.685
0.117
-10.058
△ in saturates(g)
0.063
-4.142
-1.182
-0.245
-0.417
0.069
-5.855
△ in fibre(g)
0.012
-0.469
-0.114
-0.045
-0.090
0.026
-0.680
△ in sodium(g)
0.000
-0.031
-0.007
-0.010
-0.017
0.001
-0.063
45+ no children
△ in share
0.000
-0.005
0.000
0.000
-0.001
0.000
-0.007
△ in expenditure (£)
-0.009
-0.168
-0.012
-0.015
-0.029
0.010
-0.222
△ in quantity (Kg)
-0.002
-0.037
-0.007
-0.018
-0.024
0.003
-0.085
△ in energy (kcal)
-12.430
-186.376
-34.604
-68.969
-91.452
7.213
-386.619
△ in protein(g)
-0.145
-2.105
-0.419
-0.406
-0.686
0.043
-3.718
△ in carbohydrate(g)
-1.310
-21.936
-3.949
-14.720
-19.811
2.090
-59.637
△ in sugar(g)
-1.156
-19.834
-3.715
-11.021
-15.389
0.326
-50.789
△ in fat(g)
-0.717
-9.838
-1.888
-0.973
-1.053
0.134
-14.335
△ in saturates(g)
-0.417
-5.734
-1.130
-0.550
-0.628
0.082
-8.377
△ in fibre(g)
-0.078
-0.717
-0.107
-0.077
-0.105
0.033
-1.051
△ in sodium(g)
-0.002
-0.041
-0.006
-0.020
-0.024
0.002
-0.090
7.5.4 Biscuits
Table A35: Policy simulation - biscuits - by
SIMD (Changes are in per capita per week terms)
Group
Category
Total
Cereals and fruit bars
Chocolate biscuit bars and children biscuits
Everyday biscuits and treats
Crackers and crispbreads
Special treats and seasonal biscuits
Healthier biscuits
SIMD 1
△ in share
-0.001
-0.001
-0.001
0.000
0.000
-0.001
-0.004
△ in expenditure (£)
-0.024
-0.036
-0.017
0.000
0.000
-0.018
-0.094
△ in quantity (Kg)
-0.003
-0.006
-0.005
0.000
0.000
-0.003
-0.017
△ in energy (kcal)
-11.579
-31.247
-21.956
0.181
-0.152
-13.103
-77.855
△ in protein(g)
-0.195
-0.358
-0.272
0.004
-0.002
-0.191
-1.013
△ in carbohydrate(g)
-1.675
-4.077
-3.036
0.029
-0.019
-2.004
-10.782
△ in sugar(g)
-0.793
-2.639
-1.470
0.002
-0.010
-0.827
-5.736
△ in fat(g)
-0.414
-1.473
-0.944
0.005
-0.008
-0.460
-3.294
△ in saturates(g)
-0.169
-0.853
-0.467
0.002
-0.004
-0.142
-1.633
△ in fibre(g)
-0.224
-0.140
-0.124
0.002
-0.001
-0.135
-0.622
△ in sodium(g)
-0.005
-0.011
-0.013
0.000
0.000
-0.008
-0.037
SIMD 2
△ in share
-0.001
-0.002
-0.001
0.000
0.000
-0.001
-0.004
△ in expenditure (£)
-0.028
-0.044
-0.028
0.006
0.000
-0.014
-0.107
△ in quantity (Kg)
-0.003
-0.008
-0.008
0.001
0.000
-0.002
-0.020
△ in energy (kcal)
-13.164
-38.641
-36.907
4.099
0.333
-9.739
-94.019
△ in protein(g)
-0.229
-0.439
-0.453
0.089
0.004
-0.137
-1.164
△ in carbohydrate(g)
-1.949
-5.080
-5.098
0.618
0.041
-1.539
-13.007
△ in sugar(g)
-0.913
-3.306
-2.510
0.062
0.022
-0.681
-7.325
△ in fat(g)
-0.438
-1.806
-1.589
0.131
0.017
-0.326
-4.011
△ in saturates(g)
-0.172
-1.063
-0.803
0.051
0.009
-0.109
-2.086
△ in fibre(g)
-0.288
-0.174
-0.211
0.052
0.001
-0.089
-0.709
△ in sodium(g)
-0.006
-0.014
-0.021
0.004
0.000
-0.006
-0.042
SIMD 3
△ in share
-0.001
-0.001
-0.001
0.000
0.000
-0.001
-0.004
△ in expenditure (£)
-0.035
-0.036
-0.022
0.002
-0.002
-0.018
-0.111
△ in quantity (Kg)
-0.004
-0.006
-0.006
0.000
0.000
-0.003
-0.019
△ in energy (kcal)
-16.088
-31.722
-28.832
0.992
-1.444
-12.764
-89.857
△ in protein(g)
-0.260
-0.363
-0.356
0.022
-0.017
-0.183
-1.157
△ in carbohydrate(g)
-2.361
-4.163
-3.959
0.150
-0.178
-1.986
-12.496
△ in sugar(g)
-1.162
-2.678
-1.910
0.014
-0.094
-0.842
-6.672
△ in fat(g)
-0.564
-1.487
-1.255
0.031
-0.072
-0.439
-3.786
△ in saturates(g)
-0.235
-0.872
-0.629
0.012
-0.039
-0.141
-1.905
△ in fibre(g)
-0.308
-0.145
-0.161
0.013
-0.006
-0.134
-0.742
△ in sodium(g)
-0.007
-0.012
-0.017
0.001
-0.001
-0.007
-0.043
Table A36: Policy simulation - biscuits - by
SIMD (cont.) (Changes are in per capita per week terms)
Group
Category
Total
Cereals and fruit bars
Chocolate biscuit bars and children biscuits
Everyday biscuits and treats
Crackers and crispbreads
Special treats and seasonal biscuits
Healthier biscuits
SIMD 4
△ in share
-0.001
-0.001
-0.001
0.000
0.000
-0.001
-0.004
△ in expenditure (£)
-0.032
-0.032
-0.017
0.001
-0.001
-0.023
-0.105
△ in quantity (Kg)
-0.004
-0.006
-0.005
0.000
0.000
-0.004
-0.017
△ in energy (kcal)
-15.024
-27.622
-21.285
0.537
-0.665
-15.940
-80.000
△ in protein(g)
-0.271
-0.311
-0.262
0.012
-0.008
-0.234
-1.074
△ in carbohydrate(g)
-2.173
-3.654
-2.943
0.082
-0.082
-2.412
-11.182
△ in sugar(g)
-1.064
-2.317
-1.421
0.007
-0.043
-0.998
-5.836
△ in fat(g)
-0.522
-1.285
-0.916
0.017
-0.033
-0.569
-3.309
△ in saturates(g)
-0.192
-0.770
-0.455
0.006
-0.018
-0.171
-1.599
△ in fibre(g)
-0.309
-0.131
-0.123
0.007
-0.003
-0.183
-0.742
△ in sodium(g)
-0.007
-0.011
-0.013
0.001
0.000
-0.009
-0.039
SIMD 5
△ in share
-0.001
-0.001
-0.001
0.000
0.000
0.000
-0.004
△ in expenditure (£)
-0.025
-0.038
-0.021
-0.008
-0.004
-0.013
-0.108
△ in quantity (Kg)
-0.003
-0.007
-0.005
-0.001
-0.001
-0.002
-0.019
△ in energy (kcal)
-11.663
-31.661
-25.931
-5.140
-2.481
-9.314
-86.190
△ in protein(g)
-0.199
-0.363
-0.321
-0.115
-0.030
-0.129
-1.156
△ in carbohydrate(g)
-1.687
-4.183
-3.582
-0.777
-0.303
-1.395
-11.926
△ in sugar(g)
-0.849
-2.719
-1.699
-0.061
-0.161
-0.635
-6.123
△ in fat(g)
-0.418
-1.470
-1.115
-0.161
-0.125
-0.345
-3.634
△ in saturates(g)
-0.162
-0.868
-0.551
-0.059
-0.068
-0.130
-1.838
△ in fibre(g)
-0.207
-0.155
-0.153
-0.067
-0.010
-0.092
-0.683
△ in sodium(g)
-0.005
-0.012
-0.015
-0.006
-0.001
-0.005
-0.044
Table A37: Policy simulation - biscuits - by rural urban (Changes are in per capita per week terms)
Group
Category
Total
Cereals and fruit bars
Chocolate biscuit bars and children biscuits
Everyday biscuits and treats
Crackers and crispbreads
Special treats and seasonal biscuits
Healthier biscuits
Lg. Urb. Areas
△ in share
-0.001
-0.001
-0.001
0.000
0.000
-0.001
-0.004
△ in expenditure (£)
-0.032
-0.039
-0.030
-0.002
0.001
-0.017
-0.119
△ in quantity (Kg)
-0.004
-0.007
-0.008
0.000
0.000
-0.003
-0.021
△ in energy (kcal)
-14.940
-33.746
-36.780
-1.296
0.690
-11.887
-97.957
△ in protein(g)
-0.256
-0.385
-0.453
-0.029
0.008
-0.173
-1.288
△ in carbohydrate(g)
-2.115
-4.404
-5.120
-0.199
0.084
-1.809
-13.562
△ in sugar(g)
-1.037
-2.874
-2.512
-0.018
0.045
-0.748
-7.144
△ in fat(g)
-0.549
-1.592
-1.567
-0.040
0.035
-0.422
-4.135
△ in saturates(g)
-0.227
-0.940
-0.780
-0.015
0.019
-0.128
-2.070
△ in fibre(g)
-0.293
-0.156
-0.216
-0.016
0.003
-0.132
-0.810
△ in sodium(g)
-0.006
-0.012
-0.022
-0.001
0.000
-0.007
-0.048
Oth. Urb. Areas
△ in share
-0.001
-0.001
-0.001
0.000
0.000
-0.001
-0.004
△ in expenditure (£)
-0.028
-0.034
-0.017
-0.002
-0.002
-0.019
-0.102
△ in quantity (Kg)
-0.003
-0.006
-0.005
0.000
0.000
-0.003
-0.018
△ in energy (kcal)
-13.114
-29.721
-22.012
-1.476
-1.236
-13.775
-81.334
△ in protein(g)
-0.232
-0.338
-0.272
-0.033
-0.015
-0.193
-1.083
△ in carbohydrate(g)
-1.934
-3.924
-3.027
-0.226
-0.153
-2.141
-11.404
△ in sugar(g)
-0.943
-2.534
-1.464
-0.019
-0.081
-0.938
-5.980
△ in fat(g)
-0.442
-1.383
-0.954
-0.045
-0.062
-0.476
-3.363
△ in saturates(g)
-0.171
-0.811
-0.478
-0.017
-0.033
-0.163
-1.672
△ in fibre(g)
-0.270
-0.138
-0.124
-0.019
-0.005
-0.132
-0.689
△ in sodium(g)
-0.006
-0.011
-0.013
-0.002
-0.001
-0.008
-0.040
Ac. Sm. Towns
△ in share
-0.001
-0.001
0.000
0.000
0.000
0.000
-0.003
△ in expenditure (£)
-0.021
-0.031
-0.009
0.004
0.004
-0.011
-0.064
△ in quantity (Kg)
-0.002
-0.005
-0.003
0.001
0.001
-0.002
-0.011
△ in energy (kcal)
-10.398
-26.441
-12.031
2.877
2.807
-7.750
-50.937
△ in protein(g)
-0.177
-0.307
-0.150
0.063
0.033
-0.113
-0.650
△ in carbohydrate(g)
-1.498
-3.487
-1.657
0.434
0.345
-1.189
-7.053
△ in sugar(g)
-0.726
-2.218
-0.791
0.036
0.174
-0.502
-4.027
△ in fat(g)
-0.375
-1.229
-0.521
0.092
0.141
-0.269
-2.161
△ in saturates(g)
-0.134
-0.721
-0.262
0.036
0.076
-0.082
-1.088
△ in fibre(g)
-0.187
-0.127
-0.070
0.036
0.011
-0.087
-0.425
△ in sodium(g)
-0.005
-0.010
-0.007
0.003
0.001
-0.004
-0.022
Table A38: Policy simulation - biscuits - by rural urban (cont.) (Changes are in per capita per week terms)
Group
Category
Total
Cereals and fruit bars
Chocolate biscuit bars and children biscuits
Everyday biscuits and treats
Crackers and crispbreads
Special treats and seasonal biscuits
Healthier biscuits
Rm. Sm. Towns
△ in share
-0.001
-0.002
-0.001
0.001
-0.001
-0.001
-0.005
△ in expenditure (£)
-0.030
-0.047
-0.026
0.019
-0.016
-0.042
-0.143
△ in quantity (Kg)
-0.003
-0.008
-0.007
0.003
-0.002
-0.007
-0.025
△ in energy (kcal)
-13.873
-40.800
-33.260
13.254
-11.616
-27.987
-114.281
△ in protein(g)
-0.218
-0.470
-0.398
0.306
-0.136
-0.378
-1.295
△ in carbohydrate(g)
-2.051
-5.421
-4.541
2.079
-1.403
-4.549
-15.886
△ in sugar(g)
-1.018
-3.463
-2.254
0.131
-0.782
-1.855
-9.241
△ in fat(g)
-0.489
-1.879
-1.463
0.375
-0.594
-0.900
-4.950
△ in saturates(g)
-0.209
-1.088
-0.745
0.133
-0.334
-0.270
-2.512
△ in fibre(g)
-0.222
-0.178
-0.170
0.181
-0.047
-0.287
-0.723
△ in sodium(g)
-0.006
-0.015
-0.018
0.016
-0.005
-0.016
-0.044
Ac. Rural
△ in share
-0.001
-0.002
-0.001
0.000
0.000
-0.001
-0.005
△ in expenditure (£)
-0.033
-0.055
-0.029
0.006
-0.007
-0.019
-0.136
△ in quantity (Kg)
-0.004
-0.010
-0.008
0.001
-0.001
-0.003
-0.025
△ in energy (kcal)
-15.158
-47.418
-38.007
4.249
-4.623
-13.885
-114.841
△ in protein(g)
-0.244
-0.543
-0.471
0.089
-0.056
-0.202
-1.427
△ in carbohydrate(g)
-2.271
-6.208
-5.211
0.624
-0.572
-2.052
-15.690
△ in sugar(g)
-1.045
-4.001
-2.487
0.070
-0.297
-0.926
-8.686
△ in fat(g)
-0.499
-2.223
-1.652
0.144
-0.230
-0.522
-4.982
△ in saturates(g)
-0.195
-1.296
-0.805
0.055
-0.122
-0.189
-2.551
△ in fibre(g)
-0.339
-0.213
-0.223
0.054
-0.020
-0.140
-0.881
△ in sodium(g)
-0.007
-0.017
-0.023
0.004
-0.002
-0.008
-0.052
Rm. Rural
△ in share
-0.001
-0.002
-0.001
0.000
0.000
-0.001
-0.005
△ in expenditure (£)
-0.037
-0.060
-0.019
0.003
-0.008
-0.018
-0.138
△ in quantity (Kg)
-0.004
-0.011
-0.005
0.001
-0.001
-0.003
-0.024
△ in energy (kcal)
-16.833
-53.395
-25.275
2.432
-5.652
-12.462
-111.186
△ in protein(g)
-0.275
-0.583
-0.314
0.055
-0.069
-0.187
-1.373
△ in carbohydrate(g)
-2.566
-7.018
-3.490
0.374
-0.695
-1.936
-15.331
△ in sugar(g)
-1.251
-4.417
-1.615
0.026
-0.370
-0.796
-8.423
△ in fat(g)
-0.564
-2.511
-1.089
0.073
-0.282
-0.417
-4.789
△ in saturates(g)
-0.214
-1.540
-0.537
0.025
-0.155
-0.126
-2.547
△ in fibre(g)
-0.244
-0.252
-0.143
0.036
-0.024
-0.137
-0.763
△ in sodium(g)
-0.008
-0.022
-0.016
0.003
-0.003
-0.008
-0.053
Table A39: Policy simulation - biscuits - by income (Changes are in per capita per week terms)
Group
Category
Total
Cereals and fruit bars
Chocolate biscuit bars and children biscuits
Everyday biscuits and treats
Crackers and crispbreads
Special treats and seasonal biscuits
Healthier biscuits
£0 - £29,999
△ in share
-0.001
-0.001
-0.001
0.000
0.000
-0.001
-0.004
△ in expenditure (£)
-0.025
-0.038
-0.025
0.001
-0.003
-0.015
-0.104
△ in quantity (Kg)
-0.003
-0.007
-0.007
0.000
0.000
-0.002
-0.019
△ in energy (kcal)
-11.545
-33.835
-33.545
0.929
-1.812
-10.592
-90.398
△ in protein(g)
-0.192
-0.384
-0.412
0.021
-0.022
-0.151
-1.140
△ in carbohydrate(g)
-1.708
-4.450
-4.636
0.142
-0.223
-1.637
-12.510
△ in sugar(g)
-0.818
-2.874
-2.245
0.012
-0.119
-0.704
-6.748
△ in fat(g)
-0.393
-1.580
-1.445
0.028
-0.091
-0.367
-3.848
△ in saturates(g)
-0.154
-0.932
-0.722
0.011
-0.049
-0.124
-1.970
△ in fibre(g)
-0.237
-0.156
-0.191
0.012
-0.008
-0.105
-0.685
△ in sodium(g)
-0.005
-0.012
-0.020
0.001
-0.001
-0.006
-0.043
£30,000 - £39,999
△ in share
-0.002
-0.002
-0.001
0.000
0.000
-0.001
-0.005
△ in expenditure (£)
-0.043
-0.042
-0.025
0.005
-0.004
-0.021
-0.129
△ in quantity (Kg)
-0.005
-0.007
-0.007
0.001
-0.001
-0.003
-0.022
△ in energy (kcal)
-20.371
-35.529
-32.406
3.241
-2.668
-14.472
-102.205
△ in protein(g)
-0.350
-0.401
-0.408
0.070
-0.031
-0.204
-1.325
△ in carbohydrate(g)
-2.911
-4.662
-4.442
0.490
-0.327
-2.203
-14.055
△ in sugar(g)
-1.426
-2.986
-2.130
0.049
-0.174
-0.938
-7.605
△ in fat(g)
-0.735
-1.670
-1.407
0.103
-0.134
-0.519
-4.363
△ in saturates(g)
-0.299
-0.999
-0.694
0.039
-0.073
-0.169
-2.193
△ in fibre(g)
-0.402
-0.169
-0.187
0.041
-0.011
-0.162
-0.891
△ in sodium(g)
-0.008
-0.014
-0.020
0.004
-0.001
-0.008
-0.047
£40,000 - £49,999
△ in share
-0.001
-0.002
0.000
0.000
0.000
-0.001
-0.004
△ in expenditure (£)
-0.031
-0.042
-0.007
-0.005
-0.002
-0.023
-0.110
△ in quantity (Kg)
-0.004
-0.007
-0.002
-0.001
0.000
-0.004
-0.017
△ in energy (kcal)
-14.535
-35.491
-8.560
-3.522
-1.518
-15.969
-79.594
△ in protein(g)
-0.257
-0.409
-0.106
-0.078
-0.018
-0.239
-1.106
△ in carbohydrate(g)
-2.135
-4.683
-1.186
-0.539
-0.187
-2.443
-11.172
△ in sugar(g)
-1.007
-3.038
-0.575
-0.039
-0.097
-1.018
-5.773
△ in fat(g)
-0.497
-1.651
-0.367
-0.108
-0.076
-0.559
-3.257
△ in saturates(g)
-0.194
-0.959
-0.181
-0.038
-0.041
-0.175
-1.588
△ in fibre(g)
-0.284
-0.162
-0.048
-0.045
-0.007
-0.174
-0.720
△ in sodium(g)
-0.006
-0.013
-0.005
-0.004
-0.001
-0.010
-0.040
Table A40: Policy simulation - biscuits - by income (cont.) (Changes are in per capita per week terms)
Group
Category
Total
Cereals and fruit bars
Chocolate biscuit bars and children biscuits
Everyday biscuits and treats
Crackers and crispbreads
Special treats and seasonal biscuits
Healthier biscuits
£50,000 - £59,999
△ in share
-0.001
-0.001
0.000
0.000
0.000
-0.001
-0.003
△ in expenditure (£)
-0.027
-0.021
-0.009
-0.001
0.002
-0.023
-0.079
△ in quantity (Kg)
-0.003
-0.004
-0.002
0.000
0.000
-0.004
-0.012
△ in energy (kcal)
-12.197
-17.286
-10.486
-0.626
1.027
-15.962
-55.530
△ in protein(g)
-0.209
-0.202
-0.126
-0.014
0.012
-0.230
-0.768
△ in carbohydrate(g)
-1.834
-2.276
-1.447
-0.093
0.126
-2.465
-7.990
△ in sugar(g)
-0.917
-1.432
-0.721
-0.008
0.063
-1.064
-4.078
△ in fat(g)
-0.408
-0.808
-0.454
-0.020
0.052
-0.553
-2.191
△ in saturates(g)
-0.175
-0.461
-0.238
-0.008
0.028
-0.151
-1.005
△ in fibre(g)
-0.214
-0.080
-0.059
-0.008
0.004
-0.163
-0.519
△ in sodium(g)
-0.006
-0.007
-0.006
-0.001
0.000
-0.009
-0.028
£60,000 - over
△ in share
-0.001
-0.002
0.000
0.000
0.000
0.000
-0.003
△ in expenditure (£)
-0.016
-0.044
-0.005
0.002
-0.001
-0.005
-0.069
△ in quantity (Kg)
-0.002
-0.007
-0.001
0.000
0.000
-0.001
-0.011
△ in energy (kcal)
-7.073
-35.779
-5.814
1.102
-0.913
-3.459
-51.936
△ in protein(g)
-0.144
-0.419
-0.072
0.024
-0.011
-0.048
-0.668
△ in carbohydrate(g)
-0.926
-4.691
-0.794
0.166
-0.113
-0.511
-6.869
△ in sugar(g)
-0.503
-3.120
-0.376
0.015
-0.060
-0.241
-4.286
△ in fat(g)
-0.285
-1.678
-0.254
0.035
-0.045
-0.131
-2.359
△ in saturates(g)
-0.099
-0.980
-0.123
0.013
-0.025
-0.045
-1.259
△ in fibre(g)
-0.130
-0.164
-0.034
0.013
-0.004
-0.032
-0.350
△ in sodium(g)
-0.003
-0.013
-0.003
0.001
0.000
-0.002
-0.020
Table A41: Policy simulation - biscuits - by life stage (Changes are in per capita per week terms)
Group
Category
Total
Cereals and fruit bars
Chocolate biscuit bars and children biscuits
Everyday biscuits and treats
Crackers and crispbreads
Special treats and seasonal biscuits
Healthier biscuits
Pre-family
△ in share
-0.001
-0.001
0.000
0.000
0.000
-0.001
-0.002
△ in expenditure (£)
-0.033
-0.017
0.003
0.004
0.005
-0.025
-0.063
△ in quantity (Kg)
-0.004
-0.003
0.001
0.001
0.001
-0.004
-0.009
△ in energy (kcal)
-15.071
-14.822
3.676
2.688
3.676
-17.909
-37.762
△ in protein(g)
-0.284
-0.175
0.046
0.059
0.045
-0.259
-0.567
△ in carbohydrate(g)
-2.085
-1.952
0.502
0.411
0.454
-2.707
-5.377
△ in sugar(g)
-1.052
-1.244
0.245
0.038
0.250
-1.167
-2.929
△ in fat(g)
-0.566
-0.689
0.161
0.083
0.183
-0.648
-1.476
△ in saturates(g)
-0.217
-0.394
0.079
0.030
0.099
-0.206
-0.609
△ in fibre(g)
-0.299
-0.068
0.021
0.034
0.016
-0.205
-0.501
△ in sodium(g)
-0.007
-0.006
0.002
0.003
0.002
-0.010
-0.015
Young family
△ in share
-0.002
-0.002
-0.001
0.000
0.000
-0.001
-0.007
△ in expenditure (£)
-0.037
-0.041
-0.025
-0.003
-0.003
-0.014
-0.123
△ in quantity (Kg)
-0.004
-0.007
-0.007
0.000
0.000
-0.002
-0.021
△ in energy (kcal)
-17.657
-32.425
-33.599
-1.941
-2.150
-10.048
-97.819
△ in protein(g)
-0.276
-0.386
-0.414
-0.041
-0.026
-0.146
-1.289
△ in carbohydrate(g)
-2.686
-4.376
-4.672
-0.299
-0.267
-1.486
-13.786
△ in sugar(g)
-1.281
-2.638
-2.332
-0.034
-0.138
-0.627
-7.049
△ in fat(g)
-0.590
-1.459
-1.434
-0.060
-0.107
-0.375
-4.025
△ in saturates(g)
-0.255
-0.796
-0.710
-0.023
-0.057
-0.127
-1.969
△ in fibre(g)
-0.294
-0.147
-0.191
-0.022
-0.009
-0.105
-0.768
△ in sodium(g)
-0.008
-0.013
-0.019
-0.002
-0.001
-0.006
-0.049
Middle family
△ in share
-0.001
-0.002
-0.001
0.000
0.000
-0.001
-0.005
△ in expenditure (£)
-0.023
-0.045
-0.015
0.006
0.000
-0.018
-0.095
△ in quantity (Kg)
-0.003
-0.008
-0.004
0.001
0.000
-0.003
-0.016
△ in energy (kcal)
-11.269
-37.171
-19.067
3.725
0.140
-12.851
-76.493
△ in protein(g)
-0.194
-0.436
-0.233
0.083
0.002
-0.184
-0.962
△ in carbohydrate(g)
-1.680
-4.899
-2.645
0.565
0.017
-1.962
-10.604
△ in sugar(g)
-0.837
-3.119
-1.338
0.039
0.009
-0.861
-6.106
△ in fat(g)
-0.381
-1.726
-0.817
0.117
0.007
-0.457
-3.257
△ in saturates(g)
-0.148
-0.983
-0.406
0.042
0.004
-0.147
-1.639
△ in fibre(g)
-0.191
-0.169
-0.111
0.046
0.001
-0.133
-0.557
△ in sodium(g)
-0.005
-0.014
-0.011
0.004
0.000
-0.007
-0.033
Table A42: Policy simulation - biscuits - by life stage (cont.) (Changes are in per capita per week terms)
Group
Category
Total
Cereals and fruit bars
Chocolate biscuit bars and children biscuits
Everyday biscuits and treats
Crackers and crispbreads
Special treats and seasonal biscuits
Healthier biscuits
Older family
△ in share
-0.002
-0.001
-0.001
0.000
0.000
-0.001
-0.005
△ in expenditure (£)
-0.034
-0.024
-0.012
-0.003
0.000
-0.017
-0.090
△ in quantity (Kg)
-0.004
-0.004
-0.003
0.000
0.000
-0.003
-0.015
△ in energy (kcal)
-15.987
-20.879
-15.276
-1.766
-0.240
-12.124
-66.272
△ in protein(g)
-0.268
-0.233
-0.189
-0.039
-0.003
-0.178
-0.909
△ in carbohydrate(g)
-2.373
-2.707
-2.146
-0.273
-0.029
-1.917
-9.445
△ in sugar(g)
-1.112
-1.751
-1.075
-0.025
-0.015
-0.788
-4.766
△ in fat(g)
-0.547
-0.993
-0.641
-0.054
-0.012
-0.398
-2.645
△ in saturates(g)
-0.204
-0.583
-0.322
-0.021
-0.006
-0.107
-1.243
△ in fibre(g)
-0.302
-0.094
-0.088
-0.020
-0.001
-0.129
-0.635
△ in sodium(g)
-0.008
-0.007
-0.009
-0.002
0.000
-0.007
-0.034
45+ no children
△ in share
-0.001
-0.001
-0.001
0.000
0.000
0.000
-0.003
△ in expenditure (£)
-0.020
-0.041
-0.027
0.001
-0.003
-0.014
-0.104
△ in quantity (Kg)
-0.002
-0.007
-0.007
0.000
0.000
-0.002
-0.020
△ in energy (kcal)
-9.455
-36.149
-34.725
0.809
-2.364
-9.868
-91.752
△ in protein(g)
-0.162
-0.404
-0.427
0.018
-0.028
-0.139
-1.142
△ in carbohydrate(g)
-1.375
-4.734
-4.781
0.123
-0.290
-1.530
-12.587
△ in sugar(g)
-0.660
-3.110
-2.277
0.010
-0.154
-0.663
-6.853
△ in fat(g)
-0.327
-1.703
-1.503
0.025
-0.119
-0.341
-3.968
△ in saturates(g)
-0.127
-1.030
-0.751
0.009
-0.064
-0.117
-2.080
△ in fibre(g)
-0.208
-0.169
-0.199
0.011
-0.010
-0.097
-0.673
△ in sodium(g)
-0.004
-0.013
-0.021
0.001
-0.001
-0.006
-0.044
7.5.5 Take home savouries
Table A43: Policy simulation - take home savouries - by
SIMD (Changes are in per capita per week terms)
Group
Category
Total
Crisps
Savoury snacks
Nuts
Popcorn
Private label
Branded
Private label
Branded
SIMD 1
△ in share
0.000
-0.003
0.000
-0.003
0.000
0.000
-0.007
△ in expenditure (£)
-0.008
-0.070
-0.005
-0.082
0.003
-0.007
-0.171
△ in quantity (Kg)
-0.001
-0.009
-0.001
-0.009
0.000
-0.001
-0.021
△ in energy (kcal)
-7.078
-47.709
-4.002
-47.419
2.447
-3.772
-107.533
△ in protein(g)
-0.083
-0.579
-0.049
-0.535
0.096
-0.049
-1.200
△ in carbohydrate(g)
-0.746
-5.042
-0.471
-5.415
0.076
-0.529
-12.128
△ in sugar(g)
-0.033
-0.234
-0.029
-0.332
0.032
-0.201
-0.797
△ in fat(g)
-0.406
-2.719
-0.208
-2.581
0.190
-0.149
-5.872
△ in saturates(g)
-0.044
-0.273
-0.021
-0.285
0.030
-0.026
-0.618
△ in fibre(g)
-0.056
-0.376
-0.026
-0.297
0.029
-0.061
-0.787
△ in sodium(g)
-0.007
-0.051
-0.005
-0.072
0.002
-0.003
-0.136
SIMD 2
△ in share
0.000
-0.003
0.000
-0.003
0.000
0.000
-0.006
△ in expenditure (£)
-0.002
-0.072
-0.003
-0.085
0.001
-0.004
-0.165
△ in quantity (Kg)
0.000
-0.009
0.000
-0.010
0.000
-0.001
-0.020
△ in energy (kcal)
-1.604
-47.887
-1.828
-47.831
0.712
-2.373
-100.812
△ in protein(g)
-0.019
-0.584
-0.022
-0.539
0.027
-0.033
-1.169
△ in carbohydrate(g)
-0.170
-5.087
-0.220
-5.545
0.021
-0.326
-11.327
△ in sugar(g)
-0.008
-0.226
-0.014
-0.341
0.009
-0.113
-0.694
△ in fat(g)
-0.092
-2.715
-0.094
-2.556
0.056
-0.096
-5.496
△ in saturates(g)
-0.010
-0.264
-0.010
-0.270
0.009
-0.018
-0.563
△ in fibre(g)
-0.012
-0.387
-0.011
-0.323
0.008
-0.042
-0.766
△ in sodium(g)
-0.002
-0.051
-0.002
-0.071
0.000
-0.002
-0.128
SIMD 3
△ in share
0.000
-0.003
0.000
-0.002
0.000
0.000
-0.006
△ in expenditure (£)
-0.008
-0.079
-0.001
-0.068
-0.002
-0.003
-0.160
△ in quantity (Kg)
-0.001
-0.010
0.000
-0.008
0.000
0.000
-0.020
△ in energy (kcal)
-6.296
-52.003
-0.536
-37.845
-1.385
-1.724
-99.788
△ in protein(g)
-0.074
-0.639
-0.007
-0.471
-0.055
-0.023
-1.268
△ in carbohydrate(g)
-0.665
-5.575
-0.064
-4.294
-0.039
-0.236
-10.873
△ in sugar(g)
-0.029
-0.256
-0.004
-0.275
-0.017
-0.086
-0.667
△ in fat(g)
-0.361
-2.922
-0.027
-2.045
-0.109
-0.071
-5.535
△ in saturates(g)
-0.039
-0.280
-0.003
-0.237
-0.017
-0.011
-0.587
△ in fibre(g)
-0.049
-0.433
-0.003
-0.253
-0.016
-0.028
-0.783
△ in sodium(g)
-0.007
-0.056
-0.001
-0.057
-0.001
-0.002
-0.123
Table A44: Policy simulation - take home savouries - by
SIMD (cont.) (Changes are in per capita per week terms)
Group
Category
Total
Crisps
Savoury snacks
Nuts
Popcorn
Private label
Branded
Private label
Branded
SIMD 4
△ in share
0.000
-0.002
0.000
-0.002
0.000
0.000
-0.006
△ in expenditure (£)
-0.013
-0.067
-0.006
-0.061
0.005
-0.011
-0.152
△ in quantity (Kg)
-0.002
-0.008
-0.001
-0.007
0.001
-0.001
-0.019
△ in energy (kcal)
-10.382
-43.199
-4.240
-33.841
4.184
-5.523
-93.001
△ in protein(g)
-0.123
-0.529
-0.053
-0.392
0.154
-0.075
-1.018
△ in carbohydrate(g)
-1.109
-4.653
-0.509
-3.814
0.139
-0.780
-10.726
△ in sugar(g)
-0.055
-0.236
-0.033
-0.235
0.061
-0.282
-0.779
△ in fat(g)
-0.587
-2.417
-0.215
-1.859
0.326
-0.216
-4.968
△ in saturates(g)
-0.066
-0.236
-0.022
-0.203
0.051
-0.041
-0.517
△ in fibre(g)
-0.086
-0.356
-0.029
-0.217
0.048
-0.091
-0.732
△ in sodium(g)
-0.011
-0.045
-0.006
-0.050
0.003
-0.005
-0.115
SIMD 5
△ in share
0.000
-0.003
0.000
-0.003
0.000
0.000
-0.006
△ in expenditure (£)
-0.012
-0.082
-0.003
-0.077
-0.008
-0.005
-0.187
△ in quantity (Kg)
-0.002
-0.010
0.000
-0.009
-0.001
-0.001
-0.023
△ in energy (kcal)
-9.277
-51.817
-1.815
-43.440
-6.055
-2.673
-115.076
△ in protein(g)
-0.107
-0.642
-0.023
-0.489
-0.227
-0.041
-1.529
△ in carbohydrate(g)
-0.979
-5.628
-0.221
-5.068
-0.198
-0.355
-12.448
△ in sugar(g)
-0.052
-0.262
-0.014
-0.296
-0.078
-0.104
-0.806
△ in fat(g)
-0.532
-2.869
-0.091
-2.304
-0.471
-0.111
-6.377
△ in saturates(g)
-0.057
-0.277
-0.009
-0.238
-0.075
-0.016
-0.672
△ in fibre(g)
-0.080
-0.439
-0.013
-0.312
-0.068
-0.050
-0.961
△ in sodium(g)
-0.009
-0.055
-0.003
-0.064
-0.005
-0.003
-0.138
Table A45: Policy simulation - take home savouries - by rural urban (Changes are in per capita per week terms)
Group
Category
Total
Crisps
Savoury snacks
Nuts
Popcorn
Private label
Branded
Private label
Branded
Lg. Urb. Areas
△ in share
0.000
-0.003
0.000
-0.003
0.000
0.000
-0.006
△ in expenditure (£)
-0.006
-0.078
-0.004
-0.071
-0.002
-0.006
-0.166
△ in quantity (Kg)
-0.001
-0.010
-0.001
-0.008
0.000
-0.001
-0.020
△ in energy (kcal)
-4.667
-50.719
-2.627
-40.097
-1.238
-3.101
-102.449
△ in protein(g)
-0.055
-0.623
-0.033
-0.446
-0.047
-0.044
-1.248
△ in carbohydrate(g)
-0.496
-5.454
-0.313
-4.626
-0.038
-0.422
-11.350
△ in sugar(g)
-0.021
-0.268
-0.020
-0.275
-0.016
-0.144
-0.746
△ in fat(g)
-0.265
-2.840
-0.134
-2.157
-0.097
-0.126
-5.620
△ in saturates(g)
-0.028
-0.279
-0.013
-0.225
-0.015
-0.021
-0.583
△ in fibre(g)
-0.038
-0.419
-0.017
-0.271
-0.015
-0.054
-0.813
△ in sodium(g)
-0.005
-0.053
-0.004
-0.060
-0.001
-0.003
-0.125
Oth. Urb. Areas
△ in share
0.000
-0.003
0.000
-0.003
0.000
0.000
-0.006
△ in expenditure (£)
-0.009
-0.070
-0.005
-0.081
-0.001
-0.008
-0.174
△ in quantity (Kg)
-0.001
-0.009
-0.001
-0.009
0.000
-0.001
-0.022
△ in energy (kcal)
-7.382
-47.096
-3.251
-46.128
-1.230
-4.264
-109.352
△ in protein(g)
-0.086
-0.575
-0.040
-0.531
-0.047
-0.057
-1.336
△ in carbohydrate(g)
-0.777
-5.019
-0.393
-5.320
-0.038
-0.598
-12.145
△ in sugar(g)
-0.039
-0.224
-0.024
-0.336
-0.016
-0.217
-0.855
△ in fat(g)
-0.425
-2.661
-0.164
-2.478
-0.096
-0.168
-5.992
△ in saturates(g)
-0.046
-0.259
-0.017
-0.268
-0.015
-0.031
-0.637
△ in fibre(g)
-0.058
-0.382
-0.021
-0.303
-0.014
-0.071
-0.849
△ in sodium(g)
-0.008
-0.050
-0.005
-0.070
-0.001
-0.004
-0.137
Ac. Sm. Towns
△ in share
-0.001
-0.003
0.000
-0.002
0.000
0.000
-0.006
△ in expenditure (£)
-0.013
-0.083
0.001
-0.056
0.000
-0.004
-0.155
△ in quantity (Kg)
-0.002
-0.011
0.000
-0.006
0.000
0.000
-0.019
△ in energy (kcal)
-10.849
-54.077
1.082
-31.688
-0.047
-1.908
-97.487
△ in protein(g)
-0.124
-0.660
0.013
-0.358
-0.002
-0.027
-1.158
△ in carbohydrate(g)
-1.131
-5.766
0.130
-3.644
-0.001
-0.268
-10.681
△ in sugar(g)
-0.062
-0.278
0.008
-0.219
-0.001
-0.102
-0.653
△ in fat(g)
-0.628
-3.052
0.055
-1.708
-0.004
-0.074
-5.411
△ in saturates(g)
-0.065
-0.294
0.005
-0.183
-0.001
-0.016
-0.553
△ in fibre(g)
-0.087
-0.442
0.007
-0.208
-0.001
-0.031
-0.762
△ in sodium(g)
-0.011
-0.058
0.001
-0.047
0.000
-0.002
-0.116
Table A46: Policy simulation - take home savouries - by rural urban (cont.) (Changes are in per capita per week terms)
Group
Category
Total
Crisps
Savoury snacks
Nuts
Popcorn
Private label
Branded
Private label
Branded
Rm. Sm. Towns
△ in share
-0.001
-0.003
0.000
-0.003
0.000
0.000
-0.007
△ in expenditure (£)
-0.024
-0.093
-0.003
-0.081
0.007
-0.013
-0.207
△ in quantity (Kg)
-0.004
-0.012
0.000
-0.009
0.001
-0.002
-0.025
△ in energy (kcal)
-19.315
-59.588
-2.180
-44.851
5.360
-7.678
-128.252
△ in protein(g)
-0.219
-0.716
-0.026
-0.506
0.209
-0.098
-1.356
△ in carbohydrate(g)
-2.042
-6.303
-0.249
-5.083
0.156
-0.998
-14.518
△ in sugar(g)
-0.095
-0.281
-0.017
-0.297
0.064
-0.331
-0.957
△ in fat(g)
-1.112
-3.396
-0.117
-2.449
0.421
-0.344
-6.997
△ in saturates(g)
-0.122
-0.321
-0.011
-0.279
0.068
-0.062
-0.727
△ in fibre(g)
-0.148
-0.488
-0.013
-0.276
0.063
-0.117
-0.978
△ in sodium(g)
-0.020
-0.062
-0.003
-0.066
0.004
-0.007
-0.155
Ac. Rural
△ in share
0.000
-0.002
0.000
-0.002
0.000
0.000
-0.005
△ in expenditure (£)
-0.005
-0.065
-0.004
-0.067
0.001
-0.003
-0.143
△ in quantity (Kg)
-0.001
-0.008
-0.001
-0.007
0.000
0.000
-0.017
△ in energy (kcal)
-3.923
-41.373
-3.002
-36.814
0.761
-1.535
-85.886
△ in protein(g)
-0.046
-0.509
-0.041
-0.426
0.028
-0.022
-1.015
△ in carbohydrate(g)
-0.425
-4.494
-0.355
-4.219
0.026
-0.208
-9.675
△ in sugar(g)
-0.022
-0.216
-0.023
-0.262
0.012
-0.065
-0.576
△ in fat(g)
-0.219
-2.297
-0.153
-1.987
0.059
-0.063
-4.660
△ in saturates(g)
-0.023
-0.222
-0.016
-0.218
0.010
-0.008
-0.479
△ in fibre(g)
-0.033
-0.346
-0.021
-0.241
0.008
-0.028
-0.662
△ in sodium(g)
-0.004
-0.044
-0.004
-0.056
0.001
-0.001
-0.109
Rm. Rural
△ in share
-0.001
-0.003
0.000
-0.003
0.000
0.000
-0.006
△ in expenditure (£)
-0.022
-0.077
-0.006
-0.076
0.007
-0.002
-0.176
△ in quantity (Kg)
-0.003
-0.009
-0.001
-0.008
0.001
0.000
-0.021
△ in energy (kcal)
-17.801
-48.355
-4.818
-41.930
5.563
-0.908
-108.249
△ in protein(g)
-0.204
-0.598
-0.062
-0.624
0.213
-0.011
-1.285
△ in carbohydrate(g)
-1.889
-5.198
-0.586
-4.424
0.178
-0.129
-12.046
△ in sugar(g)
-0.076
-0.238
-0.037
-0.286
0.076
-0.056
-0.616
△ in fat(g)
-1.021
-2.711
-0.242
-2.375
0.432
-0.036
-5.953
△ in saturates(g)
-0.117
-0.274
-0.025
-0.314
0.067
-0.007
-0.670
△ in fibre(g)
-0.130
-0.399
-0.029
-0.291
0.065
-0.013
-0.797
△ in sodium(g)
-0.020
-0.052
-0.006
-0.061
0.004
-0.001
-0.136
Table A47: Policy simulation - take home savouries - by income (Changes are in per capita per week terms)
Group
Category
Total
Crisps
Savoury snacks
Nuts
Popcorn
Private label
Branded
Private label
Branded
£0 - £29,999
△ in share
0.000
-0.002
0.000
-0.003
0.000
0.000
-0.005
△ in expenditure (£)
-0.007
-0.069
-0.002
-0.071
0.001
-0.004
-0.152
△ in quantity (Kg)
-0.001
-0.009
0.000
-0.008
0.000
-0.001
-0.019
△ in energy (kcal)
-5.764
-45.093
-1.757
-40.389
1.008
-2.324
-94.319
△ in protein(g)
-0.067
-0.549
-0.022
-0.476
0.038
-0.031
-1.107
△ in carbohydrate(g)
-0.609
-4.784
-0.210
-4.589
0.030
-0.329
-10.492
△ in sugar(g)
-0.029
-0.215
-0.014
-0.281
0.013
-0.122
-0.648
△ in fat(g)
-0.330
-2.558
-0.090
-2.194
0.079
-0.091
-5.183
△ in saturates(g)
-0.036
-0.252
-0.009
-0.244
0.013
-0.016
-0.544
△ in fibre(g)
-0.045
-0.367
-0.011
-0.265
0.012
-0.039
-0.716
△ in sodium(g)
-0.006
-0.048
-0.002
-0.060
0.001
-0.002
-0.117
£30,000 - £39,999
△ in share
0.000
-0.003
0.000
-0.003
0.000
0.000
-0.007
△ in expenditure (£)
-0.013
-0.078
-0.005
-0.069
-0.003
-0.006
-0.174
△ in quantity (Kg)
-0.002
-0.010
-0.001
-0.008
0.000
-0.001
-0.022
△ in energy (kcal)
-10.592
-52.047
-3.266
-38.518
-2.492
-3.131
-110.045
△ in protein(g)
-0.124
-0.643
-0.039
-0.431
-0.093
-0.046
-1.376
△ in carbohydrate(g)
-1.114
-5.599
-0.390
-4.499
-0.081
-0.406
-12.089
△ in sugar(g)
-0.049
-0.254
-0.025
-0.268
-0.034
-0.128
-0.759
△ in fat(g)
-0.609
-2.914
-0.168
-2.048
-0.194
-0.137
-6.070
△ in saturates(g)
-0.066
-0.282
-0.017
-0.214
-0.031
-0.021
-0.631
△ in fibre(g)
-0.083
-0.423
-0.019
-0.272
-0.029
-0.053
-0.880
△ in sodium(g)
-0.011
-0.056
-0.004
-0.059
-0.002
-0.003
-0.136
£40,000 - £49,999
△ in share
-0.001
-0.003
0.000
-0.003
0.000
0.000
-0.007
△ in expenditure (£)
-0.014
-0.088
-0.003
-0.077
-0.001
-0.010
-0.194
△ in quantity (Kg)
-0.002
-0.011
0.000
-0.009
0.000
-0.001
-0.024
△ in energy (kcal)
-10.943
-56.326
-2.078
-43.821
-0.597
-5.061
-118.827
△ in protein(g)
-0.131
-0.697
-0.025
-0.509
-0.023
-0.072
-1.457
△ in carbohydrate(g)
-1.174
-6.166
-0.250
-5.038
-0.018
-0.695
-13.342
△ in sugar(g)
-0.061
-0.322
-0.014
-0.316
-0.008
-0.227
-0.947
△ in fat(g)
-0.614
-3.101
-0.106
-2.356
-0.047
-0.201
-6.425
△ in saturates(g)
-0.063
-0.302
-0.011
-0.259
-0.008
-0.040
-0.683
△ in fibre(g)
-0.091
-0.473
-0.014
-0.292
-0.007
-0.096
-0.972
△ in sodium(g)
-0.011
-0.061
-0.003
-0.065
0.000
-0.005
-0.146
Table A48: Policy simulation - take home savouries - by income (cont.) (Changes are in per capita per week terms)
Group
Category
Total
Crisps
Savoury snacks
Nuts
Popcorn
Private label
Branded
Private label
Branded
£50,000 - £59,999
△ in share
0.000
-0.002
0.000
-0.003
0.000
0.000
-0.006
△ in expenditure (£)
-0.005
-0.063
-0.001
-0.078
0.001
-0.008
-0.154
△ in quantity (Kg)
-0.001
-0.008
0.000
-0.009
0.000
-0.001
-0.019
△ in energy (kcal)
-4.044
-40.734
-0.685
-44.591
0.749
-4.012
-93.317
△ in protein(g)
-0.048
-0.503
-0.009
-0.487
0.029
-0.054
-1.072
△ in carbohydrate(g)
-0.429
-4.446
-0.083
-5.142
0.024
-0.563
-10.639
△ in sugar(g)
-0.024
-0.227
-0.005
-0.344
0.011
-0.212
-0.800
△ in fat(g)
-0.230
-2.252
-0.034
-2.404
0.058
-0.159
-5.020
△ in saturates(g)
-0.023
-0.214
-0.003
-0.249
0.009
-0.029
-0.509
△ in fibre(g)
-0.034
-0.342
-0.005
-0.297
0.008
-0.064
-0.733
△ in sodium(g)
-0.005
-0.041
-0.001
-0.066
0.001
-0.004
-0.115
£60,000 - over
△ in share
-0.001
-0.003
-0.001
-0.003
0.000
0.000
-0.008
△ in expenditure (£)
-0.015
-0.083
-0.014
-0.084
0.002
-0.011
-0.204
△ in quantity (Kg)
-0.002
-0.010
-0.002
-0.009
0.000
-0.001
-0.024
△ in energy (kcal)
-10.500
-51.931
-9.088
-45.171
1.206
-5.383
-120.867
△ in protein(g)
-0.129
-0.636
-0.109
-0.490
0.045
-0.079
-1.397
△ in carbohydrate(g)
-1.130
-5.658
-1.092
-5.231
0.042
-0.705
-13.774
△ in sugar(g)
-0.054
-0.311
-0.064
-0.311
0.016
-0.223
-0.947
△ in fat(g)
-0.589
-2.878
-0.463
-2.431
0.093
-0.230
-6.498
△ in saturates(g)
-0.061
-0.272
-0.047
-0.251
0.015
-0.029
-0.644
△ in fibre(g)
-0.093
-0.437
-0.059
-0.276
0.013
-0.095
-0.947
△ in sodium(g)
-0.011
-0.055
-0.012
-0.070
0.001
-0.005
-0.152
Table A49: Policy simulation - take home savouries - by life stage (Changes are in per capita per week terms)
Group
Category
Total
Crisps
Savoury snacks
Nuts
Popcorn
Private label
Branded
Private label
Branded
Pre-family
△ in share
0.000
-0.003
0.000
-0.002
0.000
0.000
-0.007
△ in expenditure (£)
-0.012
-0.094
-0.004
-0.069
-0.002
-0.005
-0.187
△ in quantity (Kg)
-0.002
-0.012
-0.001
-0.008
0.000
-0.001
-0.023
△ in energy (kcal)
-9.326
-59.310
-3.022
-38.410
-1.686
-2.675
-114.429
△ in protein(g)
-0.110
-0.742
-0.040
-0.476
-0.064
-0.038
-1.469
△ in carbohydrate(g)
-1.000
-6.489
-0.362
-4.458
-0.051
-0.374
-12.734
△ in sugar(g)
-0.050
-0.350
-0.023
-0.287
-0.021
-0.124
-0.855
△ in fat(g)
-0.527
-3.268
-0.153
-2.032
-0.133
-0.105
-6.217
△ in saturates(g)
-0.054
-0.317
-0.015
-0.220
-0.020
-0.016
-0.643
△ in fibre(g)
-0.076
-0.491
-0.020
-0.279
-0.020
-0.050
-0.937
△ in sodium(g)
-0.010
-0.064
-0.004
-0.058
-0.001
-0.002
-0.140
Young family
△ in share
0.000
-0.003
-0.001
-0.005
0.000
0.000
-0.010
△ in expenditure (£)
-0.008
-0.055
-0.009
-0.091
-0.002
-0.009
-0.173
△ in quantity (Kg)
-0.001
-0.008
-0.001
-0.010
0.000
-0.001
-0.022
△ in energy (kcal)
-6.590
-38.140
-6.776
-52.085
-1.484
-4.715
-109.791
△ in protein(g)
-0.076
-0.470
-0.076
-0.550
-0.059
-0.068
-1.298
△ in carbohydrate(g)
-0.690
-4.144
-0.812
-6.055
-0.044
-0.638
-12.383
△ in sugar(g)
-0.034
-0.201
-0.054
-0.364
-0.018
-0.205
-0.876
△ in fat(g)
-0.381
-2.120
-0.350
-2.791
-0.116
-0.193
-5.951
△ in saturates(g)
-0.040
-0.205
-0.035
-0.287
-0.018
-0.038
-0.624
△ in fibre(g)
-0.050
-0.312
-0.038
-0.328
-0.018
-0.084
-0.831
△ in sodium(g)
-0.007
-0.042
-0.009
-0.078
-0.001
-0.004
-0.141
Middle family
△ in share
0.000
-0.003
0.000
-0.003
0.000
0.000
-0.007
△ in expenditure (£)
-0.009
-0.060
0.001
-0.058
0.000
-0.006
-0.132
△ in quantity (Kg)
-0.001
-0.008
0.000
-0.007
0.000
-0.001
-0.017
△ in energy (kcal)
-7.783
-41.076
0.842
-33.912
-0.318
-2.866
-85.113
△ in protein(g)
-0.087
-0.507
0.011
-0.375
-0.012
-0.040
-1.010
△ in carbohydrate(g)
-0.804
-4.453
0.103
-3.908
-0.011
-0.393
-9.466
△ in sugar(g)
-0.040
-0.225
0.006
-0.244
-0.004
-0.138
-0.645
△ in fat(g)
-0.455
-2.286
0.042
-1.828
-0.025
-0.116
-4.668
△ in saturates(g)
-0.050
-0.220
0.004
-0.189
-0.004
-0.018
-0.477
△ in fibre(g)
-0.058
-0.336
0.005
-0.234
-0.004
-0.050
-0.676
△ in sodium(g)
-0.008
-0.044
0.001
-0.051
0.000
-0.002
-0.105
Table A50: Policy simulation - take home savouries - by life stage (cont.) (Changes are in per capita per week terms)
Group
Category
Total
Crisps
Savoury snacks
Nuts
Popcorn
Private label
Branded
Private label
Branded
Older family
△ in share
0.000
-0.003
0.000
-0.003
0.000
0.000
-0.006
△ in expenditure (£)
-0.006
-0.051
0.001
-0.053
0.001
-0.002
-0.109
△ in quantity (Kg)
-0.001
-0.007
0.000
-0.006
0.000
0.000
-0.014
△ in energy (kcal)
-5.034
-35.522
0.780
-31.392
1.224
-0.854
-70.798
△ in protein(g)
-0.059
-0.440
0.010
-0.346
0.046
-0.012
-0.801
△ in carbohydrate(g)
-0.526
-3.816
0.095
-3.645
0.038
-0.121
-7.976
△ in sugar(g)
-0.027
-0.193
0.006
-0.233
0.015
-0.045
-0.476
△ in fat(g)
-0.291
-1.995
0.039
-1.680
0.096
-0.033
-3.863
△ in saturates(g)
-0.032
-0.193
0.004
-0.173
0.015
-0.006
-0.385
△ in fibre(g)
-0.040
-0.283
0.005
-0.213
0.015
-0.014
-0.530
△ in sodium(g)
-0.005
-0.040
0.001
-0.047
0.001
-0.001
-0.091
45+ no children
△ in share
0.000
-0.002
0.000
-0.002
0.000
0.000
-0.004
△ in expenditure (£)
-0.008
-0.071
-0.002
-0.055
0.003
-0.004
-0.137
△ in quantity (Kg)
-0.001
-0.009
0.000
-0.006
0.000
0.000
-0.017
△ in energy (kcal)
-6.355
-45.706
-1.303
-30.773
2.120
-2.000
-84.016
△ in protein(g)
-0.075
-0.554
-0.016
-0.368
0.081
-0.027
-0.959
△ in carbohydrate(g)
-0.677
-4.841
-0.155
-3.465
0.066
-0.276
-9.348
△ in sugar(g)
-0.031
-0.209
-0.010
-0.207
0.028
-0.102
-0.531
△ in fat(g)
-0.361
-2.594
-0.067
-1.686
0.166
-0.081
-4.623
△ in saturates(g)
-0.040
-0.255
-0.007
-0.194
0.027
-0.014
-0.482
△ in fibre(g)
-0.052
-0.376
-0.009
-0.197
0.024
-0.031
-0.641
△ in sodium(g)
-0.007
-0.047
-0.002
-0.046
0.001
-0.002
-0.102
7.5.6 Ambient cakes and pastries
Table A51: Policy simulation - ambient cakes and pastries - by
SIMD (Changes are in per capita per week terms)
Group
Category
Total
Cakes
Pastries
Morning goods
Private label
Branded
Private label
Branded
Private label
Branded
SIMD 1
△ in share
0.000
0.000
0.000
0.000
-0.001
-0.001
-0.003
△ in expenditure (£)
-0.001
-0.007
-0.005
-0.012
-0.014
-0.031
-0.070
△ in quantity (Kg)
-0.001
-0.004
-0.004
-0.010
-0.016
-0.024
-0.059
△ in energy (kcal)
-1.741
-6.308
-8.476
-14.752
-30.394
-42.038
-103.710
△ in protein(g)
-0.021
-0.067
-0.101
-0.180
-1.149
-1.277
-2.795
△ in carbohydrate(g)
-0.246
-0.896
-1.207
-2.125
-5.147
-7.047
-16.667
△ in sugar(g)
-0.153
-0.574
-0.682
-1.273
-0.809
-1.011
-4.502
△ in fat(g)
-0.081
-0.279
-0.369
-0.610
-0.698
-0.900
-2.938
△ in saturates(g)
-0.032
-0.116
-0.154
-0.273
-0.258
-0.282
-1.116
△ in fibre(g)
-0.008
-0.027
-0.046
-0.129
-0.347
-0.550
-1.108
△ in sodium(g)
-0.001
-0.003
-0.003
-0.009
-0.035
-0.057
-0.108
SIMD 2
△ in share
0.000
0.000
0.000
0.000
-0.001
-0.001
-0.002
△ in expenditure (£)
-0.001
-0.009
-0.004
-0.013
-0.021
-0.020
-0.066
△ in quantity (Kg)
0.000
-0.005
-0.003
-0.010
-0.025
-0.015
-0.058
△ in energy (kcal)
-1.034
-8.776
-6.266
-15.879
-46.894
-25.017
-103.864
△ in protein(g)
-0.012
-0.095
-0.074
-0.195
-1.804
-0.730
-2.910
△ in carbohydrate(g)
-0.152
-1.250
-0.888
-2.306
-7.866
-4.177
-16.639
△ in sugar(g)
-0.097
-0.798
-0.501
-1.364
-1.247
-0.620
-4.627
△ in fat(g)
-0.047
-0.385
-0.272
-0.648
-1.061
-0.568
-2.982
△ in saturates(g)
-0.018
-0.163
-0.105
-0.285
-0.384
-0.178
-1.134
△ in fibre(g)
-0.005
-0.037
-0.034
-0.136
-0.546
-0.307
-1.065
△ in sodium(g)
0.000
-0.004
-0.002
-0.009
-0.054
-0.035
-0.105
SIMD 3
△ in share
0.000
0.000
-0.001
-0.001
-0.001
-0.001
-0.004
△ in expenditure (£)
0.000
-0.012
-0.018
-0.022
-0.030
-0.031
-0.113
△ in quantity (Kg)
0.000
-0.007
-0.015
-0.018
-0.034
-0.022
-0.096
△ in energy (kcal)
-0.510
-11.837
-31.064
-27.972
-63.369
-38.556
-173.308
△ in protein(g)
-0.006
-0.129
-0.363
-0.345
-2.137
-1.207
-4.186
△ in carbohydrate(g)
-0.071
-1.697
-4.438
-4.036
-10.667
-6.507
-27.416
△ in sugar(g)
-0.046
-1.117
-2.482
-2.372
-1.758
-0.815
-8.590
△ in fat(g)
-0.024
-0.513
-1.344
-1.154
-1.434
-0.805
-5.274
△ in saturates(g)
-0.009
-0.225
-0.542
-0.473
-0.532
-0.251
-2.032
△ in fibre(g)
-0.002
-0.056
-0.173
-0.240
-0.714
-0.488
-1.673
△ in sodium(g)
0.000
-0.005
-0.012
-0.015
-0.074
-0.052
-0.159
Table A52: Policy simulation - ambient cakes and pastries - by
SIMD (cont.) (Changes are in per capita per week terms)
Group
Category
Total
Cakes
Pastries
Morning goods
Private label
Branded
Private label
Branded
Private label
Branded
SIMD 4
△ in share
0.000
0.000
0.000
0.000
-0.001
-0.001
-0.003
△ in expenditure (£)
-0.005
-0.011
-0.007
-0.013
-0.031
-0.020
-0.088
△ in quantity (Kg)
-0.002
-0.006
-0.006
-0.010
-0.035
-0.014
-0.074
△ in energy (kcal)
-5.118
-10.880
-11.674
-15.951
-64.977
-24.469
-133.069
△ in protein(g)
-0.059
-0.121
-0.141
-0.203
-2.410
-0.753
-3.687
△ in carbohydrate(g)
-0.730
-1.534
-1.678
-2.366
-10.944
-4.139
-21.391
△ in sugar(g)
-0.463
-0.948
-0.931
-1.348
-1.736
-0.563
-5.989
△ in fat(g)
-0.239
-0.491
-0.512
-0.620
-1.463
-0.508
-3.833
△ in saturates(g)
-0.096
-0.213
-0.206
-0.262
-0.541
-0.159
-1.476
△ in fibre(g)
-0.025
-0.048
-0.066
-0.154
-0.769
-0.330
-1.392
△ in sodium(g)
-0.002
-0.005
-0.005
-0.009
-0.075
-0.033
-0.128
SIMD 5
△ in share
0.000
0.000
0.000
0.000
-0.001
-0.001
-0.003
△ in expenditure (£)
-0.003
-0.014
-0.005
-0.011
-0.022
-0.034
-0.090
△ in quantity (Kg)
-0.001
-0.008
-0.004
-0.009
-0.024
-0.023
-0.069
△ in energy (kcal)
-3.090
-13.059
-8.490
-13.213
-45.118
-38.258
-121.228
△ in protein(g)
-0.036
-0.136
-0.100
-0.173
-1.584
-1.174
-3.203
△ in carbohydrate(g)
-0.454
-1.817
-1.216
-1.951
-7.535
-6.511
-19.483
△ in sugar(g)
-0.292
-1.171
-0.666
-1.077
-1.189
-0.796
-5.190
△ in fat(g)
-0.142
-0.592
-0.365
-0.511
-1.050
-0.782
-3.442
△ in saturates(g)
-0.057
-0.263
-0.152
-0.201
-0.404
-0.227
-1.304
△ in fibre(g)
-0.016
-0.068
-0.047
-0.129
-0.517
-0.521
-1.299
△ in sodium(g)
-0.001
-0.005
-0.003
-0.008
-0.051
-0.053
-0.121
Table A53: Policy simulation - ambient cakes and pastries - by rural urban (Changes are in per capita per week terms)
Group
Category
Total
Cakes
Pastries
Morning goods
Private label
Branded
Private label
Branded
Private label
Branded
Lg. Urb. Areas
△ in share
0.000
0.000
0.000
0.000
-0.001
-0.001
-0.003
△ in expenditure (£)
0.004
-0.009
-0.003
-0.010
-0.026
-0.034
-0.079
△ in quantity (Kg)
0.002
-0.005
-0.003
-0.008
-0.030
-0.024
-0.068
△ in energy (kcal)
4.712
-9.164
-5.871
-12.480
-55.985
-41.559
-120.347
△ in protein(g)
0.056
-0.098
-0.070
-0.157
-1.992
-1.291
-3.554
△ in carbohydrate(g)
0.674
-1.285
-0.831
-1.808
-9.372
-6.997
-19.621
△ in sugar(g)
0.425
-0.824
-0.461
-1.033
-1.451
-0.947
-4.290
△ in fat(g)
0.221
-0.410
-0.255
-0.503
-1.286
-0.878
-3.111
△ in saturates(g)
0.088
-0.175
-0.105
-0.208
-0.487
-0.247
-1.134
△ in fibre(g)
0.024
-0.042
-0.033
-0.124
-0.649
-0.545
-1.368
△ in sodium(g)
0.002
-0.004
-0.002
-0.007
-0.065
-0.055
-0.132
Oth. Urb. Areas
△ in share
0.000
0.000
0.000
-0.001
-0.001
-0.001
-0.003
△ in expenditure (£)
-0.007
-0.012
-0.007
-0.015
-0.024
-0.028
-0.093
△ in quantity (Kg)
-0.004
-0.007
-0.006
-0.011
-0.028
-0.019
-0.075
△ in energy (kcal)
-7.804
-11.662
-13.151
-16.987
-50.969
-33.106
-133.679
△ in protein(g)
-0.091
-0.126
-0.155
-0.217
-1.903
-0.970
-3.462
△ in carbohydrate(g)
-1.119
-1.653
-1.873
-2.502
-8.590
-5.584
-21.322
△ in sugar(g)
-0.714
-1.052
-1.046
-1.448
-1.282
-0.784
-6.325
△ in fat(g)
-0.363
-0.519
-0.578
-0.666
-1.157
-0.700
-3.982
△ in saturates(g)
-0.141
-0.222
-0.228
-0.284
-0.420
-0.223
-1.518
△ in fibre(g)
-0.039
-0.051
-0.072
-0.164
-0.588
-0.433
-1.346
△ in sodium(g)
-0.003
-0.005
-0.005
-0.010
-0.059
-0.047
-0.129
Ac. Sm. Towns
△ in share
0.000
0.000
0.000
-0.001
0.000
-0.001
-0.003
△ in expenditure (£)
-0.003
-0.008
-0.012
-0.025
-0.002
-0.024
-0.074
△ in quantity (Kg)
-0.002
-0.004
-0.011
-0.019
-0.003
-0.018
-0.056
△ in energy (kcal)
-3.138
-7.203
-21.478
-29.109
-5.535
-30.537
-96.999
△ in protein(g)
-0.037
-0.079
-0.254
-0.356
-0.222
-0.946
-1.893
△ in carbohydrate(g)
-0.466
-1.037
-3.071
-4.234
-0.937
-5.224
-14.968
△ in sugar(g)
-0.295
-0.681
-1.733
-2.560
-0.153
-0.645
-6.066
△ in fat(g)
-0.142
-0.306
-0.918
-1.216
-0.122
-0.585
-3.290
△ in saturates(g)
-0.056
-0.136
-0.374
-0.531
-0.043
-0.172
-1.313
△ in fibre(g)
-0.015
-0.035
-0.115
-0.212
-0.068
-0.432
-0.878
△ in sodium(g)
-0.001
-0.003
-0.009
-0.014
-0.006
-0.041
-0.075
Table A54: Policy simulation - ambient cakes and pastries - by rural urban (cont.) (Changes are in per capita per week terms)
Group
Category
Total
Cakes
Pastries
Morning goods
Private label
Branded
Private label
Branded
Private label
Branded
Rm. Sm. Towns
△ in share
0.000
0.000
-0.001
0.000
-0.001
-0.001
-0.003
△ in expenditure (£)
0.000
-0.001
-0.027
-0.012
-0.031
-0.018
-0.088
△ in quantity (Kg)
0.000
0.000
-0.022
-0.010
-0.036
-0.013
-0.082
△ in energy (kcal)
0.172
-0.708
-43.236
-17.331
-69.303
-22.117
-152.524
△ in protein(g)
0.002
-0.007
-0.530
-0.203
-2.351
-0.683
-3.772
△ in carbohydrate(g)
0.025
-0.099
-6.243
-2.436
-11.615
-3.704
-24.073
△ in sugar(g)
0.016
-0.064
-3.395
-1.463
-2.426
-0.491
-7.824
△ in fat(g)
0.007
-0.032
-1.867
-0.756
-1.609
-0.502
-4.758
△ in saturates(g)
0.003
-0.014
-0.709
-0.324
-0.543
-0.159
-1.745
△ in fibre(g)
0.001
-0.003
-0.244
-0.114
-0.718
-0.278
-1.357
△ in sodium(g)
0.000
0.000
-0.017
-0.008
-0.080
-0.029
-0.134
Ac. Rural
△ in share
0.000
0.000
0.000
0.000
-0.001
-0.001
-0.003
△ in expenditure (£)
-0.003
-0.009
-0.008
-0.012
-0.024
-0.018
-0.074
△ in quantity (Kg)
-0.002
-0.005
-0.006
-0.010
-0.026
-0.013
-0.062
△ in energy (kcal)
-3.441
-9.171
-12.717
-15.591
-50.183
-23.200
-114.303
△ in protein(g)
-0.040
-0.100
-0.148
-0.185
-1.806
-0.692
-2.971
△ in carbohydrate(g)
-0.496
-1.307
-1.836
-2.254
-8.390
-3.918
-18.201
△ in sugar(g)
-0.314
-0.830
-1.039
-1.316
-1.292
-0.579
-5.370
△ in fat(g)
-0.163
-0.407
-0.546
-0.632
-1.151
-0.496
-3.395
△ in saturates(g)
-0.066
-0.177
-0.236
-0.256
-0.457
-0.162
-1.353
△ in fibre(g)
-0.017
-0.045
-0.071
-0.141
-0.586
-0.285
-1.145
△ in sodium(g)
-0.001
-0.004
-0.005
-0.009
-0.059
-0.033
-0.111
Rm. Rural
△ in share
0.000
0.000
0.000
-0.001
-0.001
-0.001
-0.003
△ in expenditure (£)
0.002
-0.008
-0.014
-0.023
-0.030
-0.025
-0.098
△ in quantity (Kg)
0.001
-0.005
-0.012
-0.019
-0.034
-0.019
-0.088
△ in energy (kcal)
2.241
-8.621
-23.603
-32.719
-66.295
-32.916
-161.913
△ in protein(g)
0.026
-0.096
-0.279
-0.402
-2.081
-1.067
-3.900
△ in carbohydrate(g)
0.314
-1.248
-3.491
-4.780
-11.214
-5.515
-25.934
△ in sugar(g)
0.201
-0.785
-1.949
-2.760
-2.432
-0.609
-8.333
△ in fat(g)
0.101
-0.380
-0.986
-1.353
-1.508
-0.742
-4.869
△ in saturates(g)
0.041
-0.175
-0.384
-0.584
-0.595
-0.263
-1.961
△ in fibre(g)
0.010
-0.047
-0.135
-0.203
-0.717
-0.406
-1.498
△ in sodium(g)
0.001
-0.004
-0.009
-0.016
-0.072
-0.042
-0.142
Table A55: Policy simulation - ambient cakes and pastries - by income (Changes are in per capita per week terms)
Group
Category
Total
Cakes
Pastries
Morning goods
Private label
Branded
Private label
Branded
Private label
Branded
£0 - £29,999
△ in share
0.000
0.000
0.000
-0.001
-0.001
-0.001
-0.003
△ in expenditure (£)
-0.001
-0.011
-0.009
-0.015
-0.025
-0.024
-0.085
△ in quantity (Kg)
-0.001
-0.007
-0.007
-0.012
-0.030
-0.019
-0.076
△ in energy (kcal)
-1.426
-11.777
-15.292
-18.534
-55.929
-31.560
-134.518
△ in protein(g)
-0.017
-0.127
-0.182
-0.231
-2.127
-0.939
-3.622
△ in carbohydrate(g)
-0.206
-1.669
-2.178
-2.696
-9.436
-5.306
-21.490
△ in sugar(g)
-0.130
-1.071
-1.212
-1.569
-1.582
-0.761
-6.326
△ in fat(g)
-0.066
-0.519
-0.664
-0.753
-1.262
-0.689
-3.953
△ in saturates(g)
-0.026
-0.226
-0.265
-0.323
-0.462
-0.216
-1.517
△ in fibre(g)
-0.007
-0.054
-0.084
-0.158
-0.647
-0.402
-1.353
△ in sodium(g)
-0.001
-0.005
-0.006
-0.010
-0.064
-0.043
-0.129
£30,000 - £39,999
△ in share
0.000
0.000
0.000
-0.001
0.000
-0.001
-0.003
△ in expenditure (£)
-0.002
-0.009
-0.006
-0.014
-0.012
-0.026
-0.070
△ in quantity (Kg)
-0.001
-0.005
-0.005
-0.011
-0.014
-0.018
-0.053
△ in energy (kcal)
-2.444
-9.291
-9.841
-17.417
-25.791
-31.476
-96.260
△ in protein(g)
-0.028
-0.100
-0.118
-0.206
-0.883
-0.969
-2.305
△ in carbohydrate(g)
-0.353
-1.308
-1.424
-2.525
-4.292
-5.274
-15.176
△ in sugar(g)
-0.223
-0.843
-0.798
-1.482
-0.636
-0.686
-4.670
△ in fat(g)
-0.113
-0.416
-0.421
-0.714
-0.602
-0.664
-2.930
△ in saturates(g)
-0.045
-0.180
-0.170
-0.283
-0.227
-0.193
-1.098
△ in fibre(g)
-0.012
-0.043
-0.056
-0.153
-0.293
-0.430
-0.988
△ in sodium(g)
-0.001
-0.004
-0.004
-0.010
-0.030
-0.044
-0.092
£40,000 - £49,999
△ in share
0.000
0.000
0.000
0.000
-0.002
-0.001
-0.004
△ in expenditure (£)
-0.008
-0.006
-0.009
-0.012
-0.042
-0.031
-0.108
△ in quantity (Kg)
-0.003
-0.003
-0.007
-0.009
-0.045
-0.021
-0.087
△ in energy (kcal)
-7.351
-5.314
-14.175
-12.986
-86.400
-36.645
-162.871
△ in protein(g)
-0.084
-0.057
-0.166
-0.163
-3.008
-1.171
-4.648
△ in carbohydrate(g)
-1.049
-0.752
-2.045
-1.895
-14.527
-6.198
-26.466
△ in sugar(g)
-0.680
-0.478
-1.110
-1.108
-2.250
-0.717
-6.344
△ in fat(g)
-0.348
-0.239
-0.616
-0.519
-1.996
-0.779
-4.496
△ in saturates(g)
-0.141
-0.100
-0.262
-0.216
-0.761
-0.237
-1.717
△ in fibre(g)
-0.036
-0.023
-0.080
-0.111
-1.000
-0.467
-1.718
△ in sodium(g)
-0.003
-0.002
-0.005
-0.007
-0.101
-0.047
-0.166
Table A56: Policy simulation - ambient cakes and pastries - by income (cont.) (Changes are in per capita per week terms)
Group
Category
Total
Cakes
Pastries
Morning goods
Private label
Branded
Private label
Branded
Private label
Branded
£50,000 - £59,999
△ in share
0.000
-0.001
0.000
-0.001
-0.001
-0.002
-0.005
△ in expenditure (£)
-0.006
-0.017
-0.006
-0.018
-0.028
-0.055
-0.130
△ in quantity (Kg)
-0.003
-0.009
-0.005
-0.013
-0.029
-0.036
-0.095
△ in energy (kcal)
-5.827
-15.300
-10.641
-18.941
-53.956
-63.470
-168.136
△ in protein(g)
-0.061
-0.171
-0.129
-0.253
-1.786
-2.012
-4.411
△ in carbohydrate(g)
-0.815
-2.221
-1.517
-2.777
-8.991
-10.748
-27.067
△ in sugar(g)
-0.549
-1.381
-0.854
-1.585
-1.237
-1.343
-6.948
△ in fat(g)
-0.269
-0.677
-0.469
-0.739
-1.242
-1.257
-4.653
△ in saturates(g)
-0.104
-0.282
-0.195
-0.316
-0.472
-0.385
-1.754
△ in fibre(g)
-0.025
-0.069
-0.058
-0.188
-0.612
-0.812
-1.765
△ in sodium(g)
-0.002
-0.006
-0.005
-0.012
-0.063
-0.089
-0.176
£60,000 - over
△ in share
0.000
0.000
0.000
0.000
-0.001
0.000
-0.002
△ in expenditure (£)
-0.008
0.001
0.003
-0.013
-0.023
-0.012
-0.051
△ in quantity (Kg)
-0.003
0.001
0.002
-0.010
-0.024
-0.007
-0.041
△ in energy (kcal)
-7.158
1.090
4.727
-11.942
-44.981
-12.827
-71.091
△ in protein(g)
-0.087
0.012
0.053
-0.180
-1.476
-0.398
-2.077
△ in carbohydrate(g)
-1.016
0.152
0.667
-1.823
-7.557
-2.212
-11.789
△ in sugar(g)
-0.631
0.096
0.387
-1.014
-1.012
-0.264
-2.438
△ in fat(g)
-0.341
0.050
0.211
-0.415
-1.012
-0.232
-1.738
△ in saturates(g)
-0.131
0.022
0.088
-0.187
-0.384
-0.070
-0.664
△ in fibre(g)
-0.039
0.005
0.025
-0.210
-0.543
-0.195
-0.957
△ in sodium(g)
-0.003
0.000
0.002
-0.008
-0.053
-0.017
-0.079
Table A57: Policy simulation - ambient cakes and pastries - by life stage (Changes are in per capita per week terms)
Group
Category
Total
Cakes
Pastries
Morning goods
Private label
Branded
Private label
Branded
Private label
Branded
Pre-family
△ in share
0.000
0.000
0.000
-0.001
-0.001
-0.001
-0.003
△ in expenditure (£)
0.003
-0.005
0.004
-0.018
-0.030
-0.042
-0.089
△ in quantity (Kg)
0.001
-0.003
0.003
-0.014
-0.033
-0.029
-0.074
△ in energy (kcal)
2.880
-4.908
6.757
-19.247
-61.897
-52.376
-128.791
△ in protein(g)
0.034
-0.052
0.081
-0.257
-1.965
-1.638
-3.796
△ in carbohydrate(g)
0.411
-0.697
0.958
-2.825
-10.364
-8.904
-21.420
△ in sugar(g)
0.257
-0.439
0.533
-1.623
-1.404
-1.083
-3.757
△ in fat(g)
0.136
-0.220
0.303
-0.724
-1.367
-1.014
-2.885
△ in saturates(g)
0.054
-0.093
0.128
-0.329
-0.496
-0.289
-1.024
△ in fibre(g)
0.014
-0.022
0.037
-0.314
-0.744
-0.792
-1.821
△ in sodium(g)
0.001
-0.002
0.003
-0.013
-0.072
-0.071
-0.153
Young family
△ in share
0.000
0.000
0.000
-0.001
-0.001
-0.001
-0.004
△ in expenditure (£)
0.001
-0.006
-0.004
-0.010
-0.019
-0.025
-0.064
△ in quantity (Kg)
0.000
-0.003
-0.003
-0.007
-0.019
-0.017
-0.049
△ in energy (kcal)
0.811
-4.742
-7.634
-11.082
-35.732
-29.980
-88.358
△ in protein(g)
0.009
-0.046
-0.091
-0.141
-1.098
-0.904
-2.271
△ in carbohydrate(g)
0.112
-0.661
-1.068
-1.618
-5.952
-5.005
-14.193
△ in sugar(g)
0.073
-0.443
-0.598
-0.986
-0.810
-0.721
-3.485
△ in fat(g)
0.038
-0.213
-0.350
-0.442
-0.823
-0.654
-2.444
△ in saturates(g)
0.015
-0.086
-0.141
-0.197
-0.327
-0.216
-0.951
△ in fibre(g)
0.004
-0.018
-0.040
-0.095
-0.415
-0.366
-0.930
△ in sodium(g)
0.000
-0.002
-0.003
-0.007
-0.043
-0.041
-0.096
Middle family
△ in share
0.000
0.000
0.000
-0.001
-0.001
-0.001
-0.005
△ in expenditure (£)
-0.008
-0.010
-0.009
-0.011
-0.029
-0.024
-0.091
△ in quantity (Kg)
-0.003
-0.005
-0.007
-0.009
-0.029
-0.016
-0.069
△ in energy (kcal)
-6.940
-7.717
-14.574
-13.266
-56.531
-27.369
-126.398
△ in protein(g)
-0.080
-0.082
-0.172
-0.159
-1.770
-0.856
-3.120
△ in carbohydrate(g)
-0.975
-1.094
-2.061
-1.875
-9.393
-4.615
-20.014
△ in sugar(g)
-0.631
-0.691
-1.186
-1.163
-1.409
-0.610
-5.690
△ in fat(g)
-0.325
-0.350
-0.657
-0.559
-1.369
-0.570
-3.830
△ in saturates(g)
-0.131
-0.151
-0.260
-0.245
-0.520
-0.184
-1.492
△ in fibre(g)
-0.034
-0.035
-0.080
-0.124
-0.608
-0.343
-1.224
△ in sodium(g)
-0.003
-0.003
-0.006
-0.008
-0.066
-0.037
-0.124
Table A58: Policy simulation - ambient cakes and pastries - by life stage (cont.) (Changes are in per capita per week terms)
Group
Category
Total
Cakes
Pastries
Morning goods
Private label
Branded
Private label
Branded
Privatelabel
Branded
Older family
△ in share
0.000
0.000
0.000
-0.001
-0.001
-0.001
-0.004
△ in expenditure (£)
-0.005
-0.006
-0.009
-0.012
-0.020
-0.023
-0.076
△ in quantity (Kg)
-0.003
-0.003
-0.007
-0.009
-0.022
-0.015
-0.059
△ in energy (kcal)
-5.638
-5.224
-15.603
-14.340
-41.931
-26.701
-109.437
△ in protein(g)
-0.064
-0.054
-0.185
-0.180
-1.395
-0.811
-2.690
△ in carbohydrate(g)
-0.779
-0.735
-2.191
-2.071
-7.087
-4.447
-17.310
△ in sugar(g)
-0.503
-0.483
-1.248
-1.224
-0.956
-0.561
-4.975
△ in fat(g)
-0.264
-0.233
-0.702
-0.601
-0.907
-0.603
-3.311
△ in saturates(g)
-0.102
-0.105
-0.263
-0.273
-0.328
-0.189
-1.260
△ in fibre(g)
-0.026
-0.026
-0.083
-0.139
-0.505
-0.341
-1.119
△ in sodium(g)
-0.002
-0.002
-0.006
-0.008
-0.050
-0.035
-0.104
45+ no children
△ in share
0.000
0.000
0.000
0.000
-0.001
-0.001
-0.003
△ in expenditure (£)
-0.002
-0.014
-0.011
-0.015
-0.022
-0.022
-0.086
△ in quantity (Kg)
-0.001
-0.009
-0.009
-0.012
-0.027
-0.017
-0.075
△ in energy (kcal)
-2.643
-15.074
-18.758
-19.415
-49.644
-28.060
-133.594
△ in protein(g)
-0.031
-0.166
-0.222
-0.240
-1.966
-0.845
-3.470
△ in carbohydrate(g)
-0.385
-2.142
-2.696
-2.839
-8.376
-4.744
-21.182
△ in sugar(g)
-0.244
-1.363
-1.496
-1.623
-1.445
-0.655
-6.826
△ in fat(g)
-0.121
-0.664
-0.799
-0.786
-1.131
-0.600
-4.102
△ in saturates(g)
-0.048
-0.289
-0.323
-0.320
-0.416
-0.183
-1.579
△ in fibre(g)
-0.013
-0.071
-0.105
-0.144
-0.571
-0.359
-1.263
△ in sodium(g)
-0.001
-0.006
-0.007
-0.010
-0.057
-0.039
-0.120
7.5.7 Total puddings and desserts
Table A59: Policy simulation - total puddings and desserts - by
SIMD (Changes are in per capita per week terms)
Group
Category
Total
Puddings, canned goods and frozen desserts
Sweet home cooking
Chilled convenience
Products with healthy claims
Private label
Branded
SIMD 1
△ in share
0.000
0.000
0.000
-0.001
0.000
-0.002
△ in expenditure (£)
0.009
-0.010
-0.006
-0.036
-0.006
-0.050
△ in quantity (Kg)
0.002
-0.003
-0.001
-0.007
-0.001
-0.009
△ in energy (kcal)
6.198
-4.865
-2.670
-14.832
-0.689
-16.858
△ in protein(g)
0.093
-0.064
-0.035
-0.272
-0.021
-0.301
△ in carbohydrate(g)
0.854
-0.930
-0.321
-1.758
-0.099
-2.254
△ in sugar(g)
0.538
-0.630
-0.231
-1.412
-0.070
-1.805
△ in fat(g)
0.249
-0.096
-0.135
-0.739
-0.022
-0.743
△ in saturates(g)
0.124
-0.049
-0.083
-0.448
-0.015
-0.471
△ in fibre(g)
0.032
-0.013
-0.012
-0.048
-0.005
-0.045
△ in sodium(g)
0.002
-0.002
-0.001
-0.007
0.000
-0.008
SIMD 2
△ in share
0.000
-0.001
0.000
-0.002
0.000
-0.003
△ in expenditure (£)
0.007
-0.014
-0.013
-0.047
-0.005
-0.072
△ in quantity (Kg)
0.002
-0.004
-0.002
-0.009
-0.001
-0.014
△ in energy (kcal)
4.901
-6.551
-5.309
-17.226
-0.492
-24.676
△ in protein(g)
0.072
-0.089
-0.070
-0.332
-0.016
-0.435
△ in carbohydrate(g)
0.680
-1.245
-0.653
-2.193
-0.086
-3.498
△ in sugar(g)
0.403
-0.890
-0.482
-1.715
-0.059
-2.744
△ in fat(g)
0.195
-0.129
-0.263
-0.786
-0.009
-0.993
△ in saturates(g)
0.094
-0.063
-0.161
-0.475
-0.005
-0.610
△ in fibre(g)
0.028
-0.016
-0.024
-0.076
-0.004
-0.093
△ in sodium(g)
0.002
-0.003
-0.002
-0.008
0.000
-0.012
SIMD 3
△ in share
0.000
-0.001
-0.001
-0.002
-0.001
-0.004
△ in expenditure (£)
0.005
-0.017
-0.024
-0.068
-0.015
-0.118
△ in quantity (Kg)
0.001
-0.004
-0.004
-0.013
-0.002
-0.022
△ in energy (kcal)
3.741
-7.657
-9.912
-26.891
-1.510
-42.229
△ in protein(g)
0.057
-0.099
-0.137
-0.510
-0.044
-0.734
△ in carbohydrate(g)
0.481
-1.413
-1.186
-3.325
-0.267
-5.710
△ in sugar(g)
0.265
-0.932
-0.865
-2.579
-0.197
-4.308
△ in fat(g)
0.169
-0.177
-0.506
-1.276
-0.027
-1.816
△ in saturates(g)
0.082
-0.094
-0.310
-0.748
-0.014
-1.084
△ in fibre(g)
0.021
-0.019
-0.043
-0.106
-0.015
-0.161
△ in sodium(g)
0.002
-0.004
-0.004
-0.013
-0.001
-0.019
Table A60: Policy simulation - total puddings and desserts - by
SIMD (cont.) (Changes are in per capita per week terms)
Group
Category
Total
Puddings, canned goods and frozen desserts
Sweet home cooking
Chilled convenience
Products with healthy claims
Private label
Branded
SIMD 4
△ in share
0.000
-0.001
-0.001
-0.002
0.000
-0.003
△ in expenditure (£)
0.008
-0.020
-0.023
-0.052
-0.007
-0.095
△ in quantity (Kg)
0.002
-0.005
-0.004
-0.010
-0.001
-0.018
△ in energy (kcal)
5.222
-9.399
-9.519
-20.607
-0.564
-34.866
△ in protein(g)
0.076
-0.120
-0.127
-0.372
-0.019
-0.561
△ in carbohydrate(g)
0.703
-1.755
-1.124
-2.508
-0.094
-4.778
△ in sugar(g)
0.398
-1.237
-0.802
-1.939
-0.064
-3.645
△ in fat(g)
0.221
-0.204
-0.491
-1.004
-0.012
-1.489
△ in saturates(g)
0.107
-0.104
-0.301
-0.593
-0.007
-0.898
△ in fibre(g)
0.033
-0.021
-0.044
-0.081
-0.005
-0.118
△ in sodium(g)
0.002
-0.004
-0.004
-0.009
0.000
-0.016
SIMD 5
△ in share
0.000
-0.001
-0.001
-0.002
0.000
-0.003
△ in expenditure (£)
0.007
-0.015
-0.022
-0.056
-0.014
-0.100
△ in quantity (Kg)
0.002
-0.004
-0.004
-0.010
-0.002
-0.017
△ in energy (kcal)
4.789
-7.346
-9.019
-21.671
-1.425
-34.672
△ in protein(g)
0.067
-0.093
-0.117
-0.385
-0.062
-0.590
△ in carbohydrate(g)
0.698
-1.328
-1.076
-2.651
-0.229
-4.587
△ in sugar(g)
0.419
-0.891
-0.768
-2.063
-0.152
-3.454
△ in fat(g)
0.180
-0.179
-0.462
-1.051
-0.027
-1.540
△ in saturates(g)
0.090
-0.082
-0.277
-0.622
-0.017
-0.908
△ in fibre(g)
0.032
-0.020
-0.043
-0.084
-0.011
-0.126
△ in sodium(g)
0.002
-0.004
-0.004
-0.010
-0.001
-0.016
Table A61: Policy simulation - total puddings and desserts - by rural urban (Changes are in per capita per week terms)
Group
Category
Total
Puddings, canned goods and frozen desserts
Sweet home cooking
Chilled convenience
Products with healthy claims
Private label
Branded
Lg. Urb. Areas
△ in share
0.000
0.000
-0.001
-0.002
0.000
-0.003
△ in expenditure (£)
0.010
-0.013
-0.020
-0.052
-0.006
-0.081
△ in quantity (Kg)
0.003
-0.003
-0.003
-0.010
-0.001
-0.014
△ in energy (kcal)
6.734
-5.781
-8.492
-20.186
-0.541
-28.267
△ in protein(g)
0.098
-0.081
-0.109
-0.383
-0.019
-0.494
△ in carbohydrate(g)
0.960
-1.059
-1.000
-2.487
-0.083
-3.667
△ in sugar(g)
0.601
-0.734
-0.710
-1.877
-0.058
-2.778
△ in fat(g)
0.263
-0.134
-0.443
-0.965
-0.014
-1.292
△ in saturates(g)
0.129
-0.064
-0.264
-0.565
-0.009
-0.773
△ in fibre(g)
0.041
-0.016
-0.039
-0.084
-0.004
-0.103
△ in sodium(g)
0.002
-0.003
-0.003
-0.009
0.000
-0.013
Oth. Urb. Areas
△ in share
0.000
-0.001
-0.001
-0.002
-0.001
-0.004
△ in expenditure (£)
0.007
-0.017
-0.015
-0.058
-0.018
-0.100
△ in quantity (Kg)
0.002
-0.004
-0.003
-0.011
-0.002
-0.018
△ in energy (kcal)
5.009
-8.303
-6.095
-23.852
-1.536
-34.778
△ in protein(g)
0.074
-0.103
-0.081
-0.429
-0.056
-0.596
△ in carbohydrate(g)
0.688
-1.534
-0.743
-2.893
-0.256
-4.739
△ in sugar(g)
0.405
-1.046
-0.540
-2.314
-0.176
-3.672
△ in fat(g)
0.201
-0.189
-0.304
-1.163
-0.030
-1.485
△ in saturates(g)
0.098
-0.095
-0.187
-0.703
-0.018
-0.905
△ in fibre(g)
0.029
-0.021
-0.028
-0.086
-0.012
-0.117
△ in sodium(g)
0.002
-0.004
-0.002
-0.011
-0.001
-0.017
Ac. Sm. Towns
△ in share
0.000
0.000
0.000
-0.002
0.000
-0.002
△ in expenditure (£)
0.006
-0.010
0.002
-0.046
-0.008
-0.056
△ in quantity (Kg)
0.001
-0.002
0.000
-0.009
-0.001
-0.010
△ in energy (kcal)
4.164
-4.916
1.016
-18.821
-0.770
-19.326
△ in protein(g)
0.063
-0.062
0.014
-0.344
-0.022
-0.351
△ in carbohydrate(g)
0.532
-0.902
0.121
-2.337
-0.130
-2.716
△ in sugar(g)
0.272
-0.637
0.087
-1.813
-0.088
-2.180
△ in fat(g)
0.192
-0.113
0.052
-0.894
-0.017
-0.780
△ in saturates(g)
0.093
-0.054
0.031
-0.526
-0.011
-0.467
△ in fibre(g)
0.026
-0.012
0.005
-0.074
-0.008
-0.063
△ in sodium(g)
0.002
-0.002
0.000
-0.009
-0.001
-0.010
Table A62: Policy simulation - total puddings and desserts - by rural urban (cont.) (Changes are in per capita per week terms)
Group
Category
Total
Puddings, canned goods and frozen desserts
Sweet home cooking
Chilled convenience
Products with healthy claims
Private label
Branded
Rm. Sm. Towns
△ in share
0.000
0.000
-0.001
-0.002
0.000
-0.003
△ in expenditure (£)
0.008
-0.007
-0.021
-0.069
0.001
-0.088
△ in quantity (Kg)
0.002
-0.002
-0.004
-0.014
0.000
-0.017
△ in energy (kcal)
4.969
-3.078
-7.754
-23.731
0.125
-29.469
△ in protein(g)
0.083
-0.047
-0.113
-0.485
0.004
-0.558
△ in carbohydrate(g)
0.682
-0.594
-0.968
-3.153
0.022
-4.010
△ in sugar(g)
0.398
-0.434
-0.731
-2.490
0.016
-3.241
△ in fat(g)
0.204
-0.055
-0.372
-1.010
0.002
-1.230
△ in saturates(g)
0.102
-0.029
-0.229
-0.606
0.001
-0.761
△ in fibre(g)
0.024
-0.008
-0.034
-0.102
0.001
-0.120
△ in sodium(g)
0.002
-0.001
-0.003
-0.012
0.000
-0.014
Ac. Rural
△ in share
0.000
-0.001
-0.001
-0.001
0.000
-0.002
△ in expenditure (£)
0.007
-0.016
-0.019
-0.038
-0.004
-0.070
△ in quantity (Kg)
0.002
-0.004
-0.003
-0.007
-0.001
-0.013
△ in energy (kcal)
4.774
-7.089
-7.528
-13.860
-0.280
-23.983
△ in protein(g)
0.067
-0.086
-0.101
-0.252
-0.010
-0.383
△ in carbohydrate(g)
0.635
-1.392
-0.893
-1.680
-0.047
-3.377
△ in sugar(g)
0.360
-0.995
-0.647
-1.319
-0.030
-2.632
△ in fat(g)
0.205
-0.124
-0.386
-0.677
-0.005
-0.987
△ in saturates(g)
0.098
-0.068
-0.238
-0.400
-0.003
-0.611
△ in fibre(g)
0.031
-0.015
-0.037
-0.056
-0.004
-0.081
△ in sodium(g)
0.002
-0.003
-0.003
-0.006
0.000
-0.011
Rm. Rural
△ in share
0.000
-0.001
-0.001
-0.001
0.000
-0.002
△ in expenditure (£)
0.010
-0.015
-0.018
-0.032
-0.002
-0.057
△ in quantity (Kg)
0.003
-0.004
-0.004
-0.006
0.000
-0.011
△ in energy (kcal)
6.953
-8.257
-7.950
-11.912
-0.244
-21.409
△ in protein(g)
0.107
-0.104
-0.113
-0.231
-0.006
-0.347
△ in carbohydrate(g)
0.874
-1.567
-0.946
-1.459
-0.044
-3.143
△ in sugar(g)
0.451
-0.914
-0.699
-1.131
-0.033
-2.325
△ in fat(g)
0.327
-0.172
-0.406
-0.569
-0.004
-0.824
△ in saturates(g)
0.164
-0.088
-0.250
-0.332
-0.003
-0.509
△ in fibre(g)
0.034
-0.018
-0.033
-0.045
-0.002
-0.065
△ in sodium(g)
0.003
-0.004
-0.003
-0.006
0.000
-0.009
Table A63: Policy simulation - total puddings and desserts - by income (Changes are in per capita per week terms)
Group
Category
Total
Puddings, canned goods and frozen desserts
Sweet home cooking
Chilled convenience
Products with healthy claims
Private label
Branded
£0 - £29,999
△ in share
0.000
0.000
-0.001
-0.002
0.000
-0.003
△ in expenditure (£)
0.009
-0.014
-0.015
-0.053
-0.012
-0.085
△ in quantity (Kg)
0.002
-0.004
-0.003
-0.010
-0.001
-0.016
△ in energy (kcal)
6.361
-6.416
-6.473
-20.740
-1.109
-28.376
△ in protein(g)
0.096
-0.089
-0.086
-0.391
-0.036
-0.506
△ in carbohydrate(g)
0.869
-1.182
-0.779
-2.569
-0.184
-3.844
△ in sugar(g)
0.510
-0.809
-0.562
-1.996
-0.129
-2.985
△ in fat(g)
0.262
-0.145
-0.327
-0.982
-0.024
-1.215
△ in saturates(g)
0.127
-0.073
-0.200
-0.584
-0.015
-0.744
△ in fibre(g)
0.036
-0.016
-0.030
-0.083
-0.009
-0.103
△ in sodium(g)
0.003
-0.003
-0.003
-0.010
-0.001
-0.014
£30,000 - £39,999
△ in share
0.000
-0.001
-0.001
-0.002
0.000
-0.004
△ in expenditure (£)
0.006
-0.017
-0.024
-0.063
-0.006
-0.104
△ in quantity (Kg)
0.001
-0.004
-0.004
-0.012
-0.001
-0.019
△ in energy (kcal)
4.121
-8.012
-9.704
-26.581
-0.528
-40.704
△ in protein(g)
0.059
-0.098
-0.129
-0.472
-0.021
-0.661
△ in carbohydrate(g)
0.562
-1.535
-1.182
-3.246
-0.088
-5.490
△ in sugar(g)
0.328
-1.077
-0.858
-2.473
-0.059
-4.139
△ in fat(g)
0.169
-0.157
-0.486
-1.294
-0.010
-1.779
△ in saturates(g)
0.081
-0.080
-0.296
-0.762
-0.006
-1.064
△ in fibre(g)
0.028
-0.019
-0.044
-0.100
-0.004
-0.139
△ in sodium(g)
0.001
-0.004
-0.004
-0.012
0.000
-0.018
£40,000 - £49,999
△ in share
0.000
0.000
-0.001
-0.001
0.000
-0.002
△ in expenditure (£)
0.004
-0.011
-0.020
-0.031
-0.002
-0.060
△ in quantity (Kg)
0.001
-0.003
-0.003
-0.006
0.000
-0.011
△ in energy (kcal)
2.818
-5.296
-7.823
-12.020
-0.256
-22.578
△ in protein(g)
0.040
-0.058
-0.105
-0.219
-0.009
-0.351
△ in carbohydrate(g)
0.378
-1.027
-0.941
-1.463
-0.043
-3.096
△ in sugar(g)
0.217
-0.686
-0.682
-1.195
-0.029
-2.375
△ in fat(g)
0.116
-0.103
-0.398
-0.584
-0.005
-0.973
△ in saturates(g)
0.059
-0.052
-0.238
-0.354
-0.003
-0.588
△ in fibre(g)
0.017
-0.012
-0.037
-0.043
-0.002
-0.077
△ in sodium(g)
0.001
-0.002
-0.003
-0.005
0.000
-0.010
Table A64: Policy simulation - total puddings and desserts - by income (cont.) (Changes are in per capita per week terms)
Group
Category
Total
Puddings, canned goods and frozen desserts
Sweet home cooking
Chilled convenience
Products with healthy claims
Private label
Branded
£50,000 - £59,999
△ in share
0.000
-0.001
0.000
-0.002
0.000
-0.004
△ in expenditure (£)
0.002
-0.025
-0.011
-0.048
-0.009
-0.091
△ in quantity (Kg)
0.000
-0.006
-0.002
-0.009
-0.001
-0.017
△ in energy (kcal)
1.162
-12.398
-4.312
-19.538
-0.739
-35.826
△ in protein(g)
0.016
-0.147
-0.061
-0.349
-0.022
-0.563
△ in carbohydrate(g)
0.163
-2.296
-0.491
-2.324
-0.126
-5.075
△ in sugar(g)
0.093
-1.698
-0.359
-1.860
-0.086
-3.909
△ in fat(g)
0.048
-0.279
-0.231
-0.978
-0.016
-1.456
△ in saturates(g)
0.024
-0.125
-0.141
-0.582
-0.009
-0.833
△ in fibre(g)
0.007
-0.034
-0.019
-0.072
-0.006
-0.123
△ in sodium(g)
0.000
-0.006
-0.002
-0.009
0.000
-0.016
£60,000 - over
△ in share
0.000
-0.001
0.000
-0.001
0.000
-0.002
△ in expenditure (£)
0.010
-0.014
-0.006
-0.028
-0.006
-0.044
△ in quantity (Kg)
0.002
-0.003
-0.001
-0.005
-0.001
-0.007
△ in energy (kcal)
6.962
-6.706
-2.342
-10.692
-0.550
-13.328
△ in protein(g)
0.091
-0.078
-0.029
-0.193
-0.018
-0.228
△ in carbohydrate(g)
0.942
-1.240
-0.270
-1.268
-0.085
-1.921
△ in sugar(g)
0.564
-0.794
-0.193
-1.026
-0.060
-1.509
△ in fat(g)
0.294
-0.156
-0.125
-0.535
-0.015
-0.537
△ in saturates(g)
0.146
-0.073
-0.076
-0.322
-0.009
-0.334
△ in fibre(g)
0.043
-0.018
-0.010
-0.040
-0.004
-0.030
△ in sodium(g)
0.003
-0.003
-0.001
-0.005
0.000
-0.006
Table A65: Policy simulation - total puddings and desserts - by life stage (Changes are in per capita per week terms)
Group
Category
Total
Puddings, canned goods and frozen desserts
Sweet home cooking
Chilled convenience
Products with healthy claims
Private label
Branded
Pre-family
△ in share
0.000
0.000
0.000
-0.003
0.000
-0.003
△ in expenditure (£)
0.011
-0.011
-0.014
-0.071
-0.007
-0.091
△ in quantity (Kg)
0.003
-0.002
-0.002
-0.013
-0.001
-0.016
△ in energy (kcal)
7.209
-4.977
-5.637
-28.846
-0.870
-33.121
△ in protein(g)
0.107
-0.053
-0.076
-0.498
-0.024
-0.543
△ in carbohydrate(g)
1.003
-0.937
-0.664
-3.370
-0.139
-4.107
△ in sugar(g)
0.624
-0.654
-0.479
-2.636
-0.104
-3.248
△ in fat(g)
0.287
-0.110
-0.293
-1.478
-0.023
-1.616
△ in saturates(g)
0.136
-0.058
-0.176
-0.870
-0.014
-0.982
△ in fibre(g)
0.046
-0.013
-0.025
-0.113
-0.007
-0.113
△ in sodium(g)
0.003
-0.002
-0.002
-0.012
0.000
-0.015
Young family
△ in share
0.000
-0.001
0.000
-0.002
0.000
-0.003
△ in expenditure (£)
0.002
-0.018
-0.004
-0.036
-0.004
-0.060
△ in quantity (Kg)
0.001
-0.005
-0.001
-0.007
-0.001
-0.012
△ in energy (kcal)
1.685
-8.181
-1.748
-15.542
-0.326
-24.112
△ in protein(g)
0.026
-0.101
-0.025
-0.286
-0.009
-0.395
△ in carbohydrate(g)
0.216
-1.537
-0.208
-1.926
-0.057
-3.512
△ in sugar(g)
0.119
-1.163
-0.154
-1.517
-0.040
-2.755
△ in fat(g)
0.072
-0.184
-0.091
-0.740
-0.006
-0.948
△ in saturates(g)
0.035
-0.094
-0.055
-0.438
-0.004
-0.555
△ in fibre(g)
0.009
-0.018
-0.008
-0.049
-0.004
-0.070
△ in sodium(g)
0.001
-0.004
-0.001
-0.007
0.000
-0.011
Middle family
△ in share
0.000
-0.001
0.000
-0.002
0.000
-0.003
△ in expenditure (£)
0.006
-0.018
-0.007
-0.033
-0.006
-0.059
△ in quantity (Kg)
0.001
-0.004
-0.001
-0.006
-0.001
-0.011
△ in energy (kcal)
4.127
-9.379
-2.947
-15.280
-0.505
-23.983
△ in protein(g)
0.058
-0.121
-0.041
-0.267
-0.017
-0.388
△ in carbohydrate(g)
0.553
-1.603
-0.357
-1.828
-0.086
-3.320
△ in sugar(g)
0.330
-1.128
-0.263
-1.412
-0.059
-2.533
△ in fat(g)
0.175
-0.266
-0.148
-0.763
-0.010
-1.012
△ in saturates(g)
0.085
-0.104
-0.090
-0.447
-0.006
-0.562
△ in fibre(g)
0.025
-0.034
-0.014
-0.052
-0.006
-0.080
△ in sodium(g)
0.002
-0.005
-0.001
-0.007
0.000
-0.011
Table A66: Policy simulation - total puddings and desserts - by life stage (cont.) (Changes are in per capita per week terms)
Group
Category
Total
Puddings, canned goods and frozen desserts
Sweet home cooking
Chilled convenience
Products with healthy claims
Private label
Branded
Older family
△ in share
0.000
0.000
0.000
-0.003
-0.001
-0.004
△ in expenditure (£)
0.003
-0.009
-0.009
-0.057
-0.012
-0.083
△ in quantity (Kg)
0.001
-0.002
-0.002
-0.011
-0.001
-0.016
△ in energy (kcal)
2.319
-4.798
-3.901
-21.611
-1.239
-29.230
△ in protein(g)
0.034
-0.060
-0.057
-0.417
-0.034
-0.533
△ in carbohydrate(g)
0.300
-0.834
-0.466
-2.643
-0.225
-3.867
△ in sugar(g)
0.164
-0.576
-0.343
-2.109
-0.152
-3.015
△ in fat(g)
0.096
-0.131
-0.198
-1.039
-0.021
-1.293
△ in saturates(g)
0.046
-0.058
-0.122
-0.641
-0.012
-0.786
△ in fibre(g)
0.012
-0.017
-0.016
-0.076
-0.010
-0.106
△ in sodium(g)
0.001
-0.003
-0.001
-0.011
-0.001
-0.015
45+ no children △ in share 0.000 0.000 -0.001 -0.002 0.000 -0.003
△ in expenditure (£)
0.011
-0.014
-0.022
-0.048
-0.012
-0.084
△ in quantity (Kg)
0.003
-0.004
-0.004
-0.009
-0.001
-0.015
△ in energy (kcal)
7.282
-6.355
-8.868
-17.159
-1.020
-26.120
△ in protein(g)
0.107
-0.087
-0.116
-0.330
-0.039
-0.466
△ in carbohydrate(g)
1.004
-1.208
-1.066
-2.158
-0.168
-3.596
△ in sugar(g)
0.588
-0.805
-0.767
-1.681
-0.113
-2.777
△ in fat(g)
0.300
-0.126
-0.450
-0.794
-0.020
-1.089
△ in saturates(g)
0.148
-0.067
-0.274
-0.474
-0.012
-0.680
△ in fibre(g)
0.043
-0.014
-0.041
-0.073
-0.008
-0.093
△ in sodium(g)
0.003
-0.003
-0.003
-0.008
-0.001
-0.013
7.5.8 Regular soft drinks
Table A67: Policy simulation - regular soft drinks - by
SIMD (Changes are in per capita per week terms)
Group
Category
Total
Mineral water
Soft drinks
Juices
Other drinks
Drinks with healthy claims
SIMD 1
△ in share
0.001
-0.006
0.000
-0.001
-0.006
-0.012
△ in expenditure (£)
0.016
-0.145
-0.007
-0.019
-0.154
-0.309
△ in quantity (Lt)
0.028
-0.116
-0.007
-0.012
-0.127
-0.235
△ in energy (kcal)
0.876
-38.256
-2.713
-4.598
-3.232
-47.923
△ in protein(g)
0.036
-0.007
-0.020
-0.097
-0.031
-0.119
△ in carbohydrate(g)
0.115
-9.354
-0.619
-0.937
-0.405
-11.200
△ in sugar(g)
0.104
-8.729
-0.594
-0.856
-0.359
-10.434
△ in fat(g)
0.020
-0.002
-0.002
-0.034
-0.008
-0.025
△ in saturates(g)
0.003
-0.001
0.000
-0.022
-0.005
-0.025
△ in fibre(g)
0.006
-0.022
-0.015
-0.032
-0.021
-0.085
△ in sodium(g)
0.000
-0.007
-0.002
-0.003
-0.013
-0.024
SIMD 2
△ in share
0.001
-0.004
0.000
-0.001
-0.007
-0.011
△ in expenditure (£)
0.022
-0.107
-0.005
-0.022
-0.199
-0.311
△ in quantity (Lt)
0.040
-0.079
-0.006
-0.014
-0.164
-0.222
△ in energy (kcal)
1.050
-26.167
-1.960
-4.932
-5.135
-37.144
△ in protein(g)
0.042
-0.005
-0.023
-0.082
-0.030
-0.097
△ in carbohydrate(g)
0.136
-6.354
-0.439
-1.008
-0.772
-8.438
△ in sugar(g)
0.124
-6.062
-0.424
-0.901
-0.690
-7.953
△ in fat(g)
0.023
-0.002
-0.002
-0.038
-0.008
-0.026
△ in saturates(g)
0.003
-0.001
0.000
-0.018
-0.005
-0.021
△ in fibre(g)
0.008
-0.015
-0.015
-0.036
-0.031
-0.089
△ in sodium(g)
0.000
-0.003
-0.002
-0.003
-0.018
-0.027
SIMD 3
△ in share
0.000
-0.005
-0.001
-0.001
-0.006
-0.013
△ in expenditure (£)
0.004
-0.147
-0.033
-0.037
-0.156
-0.368
△ in quantity (Lt)
0.008
-0.106
-0.036
-0.023
-0.124
-0.282
△ in energy (kcal)
0.214
-36.136
-13.251
-8.822
-4.756
-62.750
△ in protein(g)
0.006
-0.010
-0.138
-0.122
-0.033
-0.297
△ in carbohydrate(g)
0.034
-8.801
-2.968
-1.876
-0.804
-14.416
△ in sugar(g)
0.031
-8.427
-2.918
-1.776
-0.697
-13.787
△ in fat(g)
0.003
-0.002
-0.015
-0.053
-0.012
-0.078
△ in saturates(g)
0.000
-0.001
-0.001
-0.027
-0.008
-0.037
△ in fibre(g)
0.001
-0.026
-0.090
-0.065
-0.025
-0.204
△ in sodium(g)
0.000
-0.005
-0.017
-0.004
-0.013
-0.038
Table A68: Policy simulation - regular soft drinks - by
SIMD (cont.) (Changes are in per capita per week terms)
Group
Category
Total
Mineral water
Soft drinks
Juices
Other drinks
Drinks with healthy claims
SIMD 4
△ in share
0.000
-0.004
-0.001
-0.001
-0.006
-0.012
△ in expenditure (£)
0.009
-0.115
-0.025
-0.026
-0.159
-0.317
△ in quantity (Lt)
0.017
-0.078
-0.028
-0.017
-0.112
-0.218
△ in energy (kcal)
0.579
-27.687
-10.702
-5.943
-3.501
-47.254
△ in protein(g)
0.011
-0.007
-0.095
-0.090
-0.017
-0.199
△ in carbohydrate(g)
0.105
-6.755
-2.401
-1.254
-0.523
-10.828
△ in sugar(g)
0.100
-6.266
-2.348
-1.130
-0.469
-10.113
△ in fat(g)
0.006
-0.004
-0.013
-0.034
-0.006
-0.051
△ in saturates(g)
0.001
-0.001
-0.003
-0.021
-0.004
-0.028
△ in fibre(g)
0.002
-0.017
-0.051
-0.041
-0.020
-0.127
△ in sodium(g)
0.000
-0.003
-0.010
-0.004
-0.014
-0.031
SIMD 5
△ in share
0.001
-0.003
-0.001
-0.001
-0.005
-0.009
△ in expenditure (£)
0.017
-0.075
-0.023
-0.022
-0.147
-0.251
△ in quantity (Lt)
0.030
-0.049
-0.025
-0.014
-0.118
-0.175
△ in energy (kcal)
0.733
-17.285
-9.095
-5.507
-4.408
-35.563
△ in protein(g)
0.018
-0.004
-0.075
-0.107
-0.032
-0.200
△ in carbohydrate(g)
0.119
-4.232
-2.046
-1.116
-0.693
-7.968
△ in sugar(g)
0.111
-4.010
-2.004
-1.043
-0.620
-7.565
△ in fat(g)
0.010
-0.001
-0.007
-0.041
-0.016
-0.055
△ in saturates(g)
0.001
0.000
-0.001
-0.025
-0.007
-0.032
△ in fibre(g)
0.003
-0.011
-0.032
-0.038
-0.030
-0.108
△ in sodium(g)
0.000
-0.002
-0.005
-0.003
-0.013
-0.022
Table A69: Policy simulation - regular soft drinks - by rural urban (Changes are in per capita per week terms)
Group
Category
Total
Mineral water
Soft drinks
Juices
Other drinks
Drinks with healthy claims
Lml. Urb. Areas
△ in share
0.001
-0.004
0.000
-0.001
-0.008
-0.012
△ in expenditure (£)
0.014
-0.101
-0.007
-0.021
-0.210
-0.325
△ in quantity (Lt)
0.023
-0.072
-0.008
-0.013
-0.166
-0.235
△ in energy (kcal)
0.652
-24.059
-2.876
-5.129
-5.736
-37.148
△ in protein(g)
0.020
-0.005
-0.023
-0.101
-0.045
-0.155
△ in carbohydrate(g)
0.100
-5.892
-0.648
-1.043
-0.880
-8.363
△ in sugar(g)
0.093
-5.668
-0.629
-0.959
-0.774
-7.937
△ in fat(g)
0.011
-0.002
-0.002
-0.039
-0.015
-0.048
△ in saturates(g)
0.002
-0.001
0.000
-0.023
-0.009
-0.032
△ in fibre(g)
0.004
-0.015
-0.011
-0.036
-0.035
-0.093
△ in sodium(g)
0.000
-0.003
-0.001
-0.003
-0.020
-0.027
Oth. Urb. Areas
△ in share
0.000
-0.005
-0.001
-0.001
-0.006
-0.011
△ in expenditure (£)
0.014
-0.125
-0.017
-0.023
-0.155
-0.306
△ in quantity (Lt)
0.025
-0.093
-0.019
-0.015
-0.129
-0.231
△ in energy (kcal)
0.670
-31.703
-6.518
-5.493
-3.715
-46.758
△ in protein(g)
0.021
-0.007
-0.075
-0.090
-0.030
-0.181
△ in carbohydrate(g)
0.100
-7.716
-1.451
-1.143
-0.511
-10.721
△ in sugar(g)
0.092
-7.283
-1.414
-1.070
-0.465
-10.140
△ in fat(g)
0.012
-0.002
-0.008
-0.036
-0.009
-0.043
△ in saturates(g)
0.002
-0.001
-0.001
-0.022
-0.006
-0.028
△ in fibre(g)
0.004
-0.019
-0.051
-0.040
-0.024
-0.130
△ in sodium(g)
0.000
-0.004
-0.009
-0.003
-0.014
-0.030
Ac. Sm. Towns
△ in share
0.001
-0.004
-0.001
-0.002
-0.003
-0.009
△ in expenditure (£)
0.023
-0.093
-0.026
-0.042
-0.078
-0.216
△ in quantity (Lt)
0.042
-0.065
-0.030
-0.028
-0.057
-0.139
△ in energy (kcal)
1.176
-21.481
-11.597
-8.456
-1.665
-42.023
△ in protein(g)
0.037
-0.004
-0.083
-0.056
-0.010
-0.116
△ in carbohydrate(g)
0.175
-5.228
-2.632
-1.917
-0.243
-9.844
△ in sugar(g)
0.167
-4.850
-2.565
-1.672
-0.221
-9.143
△ in fat(g)
0.021
-0.001
-0.012
-0.020
-0.003
-0.015
△ in saturates(g)
0.003
-0.001
-0.003
-0.010
-0.002
-0.013
△ in fibre(g)
0.006
-0.013
-0.046
-0.055
-0.010
-0.119
△ in sodium(g)
0.000
-0.003
-0.011
-0.004
-0.006
-0.024
Table A70: Policy simulation - regular soft drinks - by rural urban (cont.) (Changes are in per capita per week terms)
Group
Category
Total
Mineral water
Soft drinks
Juices
Other drinks
Drinks with healthy claims
Rm. Sm. Towns
△ in share
0.001
-0.005
-0.001
-0.001
-0.007
-0.013
△ in expenditure (£)
0.024
-0.135
-0.041
-0.019
-0.201
-0.371
△ in quantity (Lt)
0.045
-0.098
-0.044
-0.012
-0.138
-0.246
△ in energy (kcal)
0.987
-35.089
-15.921
-4.757
-3.784
-58.565
△ in protein(g)
0.038
-0.008
-0.090
-0.113
-0.013
-0.186
△ in carbohydrate(g)
0.130
-8.521
-3.692
-0.907
-0.625
-13.615
△ in sugar(g)
0.118
-8.049
-3.585
-0.814
-0.581
-12.912
△ in fat(g)
0.021
-0.001
-0.006
-0.056
-0.004
-0.046
△ in saturates(g)
0.003
-0.001
-0.001
-0.016
-0.002
-0.017
△ in fibre(g)
0.006
-0.022
-0.045
-0.035
-0.023
-0.119
△ in sodium(g)
0.000
-0.003
-0.005
-0.004
-0.012
-0.024
Ac. Rural
△ in share
0.001
-0.004
-0.001
-0.001
-0.006
-0.012
△ in expenditure (£)
0.019
-0.117
-0.031
-0.032
-0.177
-0.338
△ in quantity (Lt)
0.034
-0.074
-0.034
-0.020
-0.118
-0.213
△ in energy (kcal)
1.466
-25.591
-13.131
-7.079
-4.644
-48.979
△ in protein(g)
0.028
-0.007
-0.120
-0.118
-0.024
-0.241
△ in carbohydrate(g)
0.269
-6.258
-2.949
-1.479
-0.754
-11.172
△ in sugar(g)
0.260
-5.837
-2.880
-1.307
-0.642
-10.405
△ in fat(g)
0.016
-0.003
-0.018
-0.045
-0.014
-0.064
△ in saturates(g)
0.002
-0.001
-0.003
-0.029
-0.005
-0.036
△ in fibre(g)
0.005
-0.017
-0.076
-0.050
-0.028
-0.166
△ in sodium(g)
0.000
-0.004
-0.019
-0.005
-0.014
-0.042
Rm. Rural
△ in share
0.000
-0.004
-0.001
-0.001
-0.005
-0.011
△ in expenditure (£)
0.005
-0.127
-0.041
-0.035
-0.138
-0.336
△ in quantity (Lt)
0.008
-0.087
-0.046
-0.021
-0.120
-0.266
△ in energy (kcal)
0.218
-31.668
-17.982
-6.973
-5.605
-62.010
△ in protein(g)
0.012
-0.014
-0.131
-0.117
-0.010
-0.260
△ in carbohydrate(g)
0.020
-7.681
-4.109
-1.411
-1.098
-14.280
△ in sugar(g)
0.017
-7.003
-4.022
-1.292
-0.915
-13.215
△ in fat(g)
0.007
-0.004
-0.013
-0.052
-0.002
-0.063
△ in saturates(g)
0.001
-0.002
-0.003
-0.026
-0.001
-0.031
△ in fibre(g)
0.002
-0.022
-0.053
-0.061
-0.020
-0.154
△ in sodium(g)
0.000
-0.005
-0.006
-0.005
-0.012
-0.028
Table A71: Policy simulation - regular soft drinks - by income (Changes are in per capita per week terms)
Group
Category
Total
Mineral water
Soft drinks
Juices
Other drinks
Drinks with healthy claims
£0 - £29,999
△ in share
0.000
-0.004
-0.001
-0.001
-0.006
-0.011
△ in expenditure (£)
0.014
-0.119
-0.024
-0.022
-0.175
-0.326
△ in quantity (Lt)
0.024
-0.088
-0.026
-0.014
-0.138
-0.241
△ in energy (kcal)
0.677
-29.362
-9.324
-5.310
-4.272
-47.591
△ in protein(g)
0.024
-0.007
-0.090
-0.110
-0.035
-0.218
△ in carbohydrate(g)
0.094
-7.179
-2.092
-1.066
-0.641
-10.884
△ in sugar(g)
0.086
-6.789
-2.033
-0.994
-0.575
-10.305
△ in fat(g)
0.013
-0.002
-0.011
-0.045
-0.010
-0.054
△ in saturates(g)
0.002
-0.001
-0.002
-0.025
-0.007
-0.032
△ in fibre(g)
0.004
-0.018
-0.062
-0.041
-0.026
-0.143
△ in sodium(g)
0.000
-0.004
-0.011
-0.003
-0.014
-0.032
£30,000 - £39,999
△ in share
0.001
-0.005
0.000
-0.001
-0.005
-0.011
△ in expenditure (£)
0.015
-0.134
-0.011
-0.028
-0.144
-0.301
△ in quantity (Lt)
0.027
-0.095
-0.012
-0.018
-0.113
-0.211
△ in energy (kcal)
0.620
-34.162
-4.743
-6.234
-4.301
-48.820
△ in protein(g)
0.020
-0.008
-0.035
-0.084
-0.023
-0.130
△ in carbohydrate(g)
0.092
-8.341
-1.073
-1.327
-0.697
-11.347
△ in sugar(g)
0.086
-7.797
-1.045
-1.163
-0.603
-10.522
△ in fat(g)
0.011
-0.002
-0.005
-0.034
-0.007
-0.037
△ in saturates(g)
0.001
-0.001
-0.001
-0.021
-0.005
-0.026
△ in fibre(g)
0.003
-0.020
-0.020
-0.041
-0.023
-0.101
△ in sodium(g)
0.000
-0.004
-0.002
-0.005
-0.014
-0.024
£40,000 - £49,999
△ in share
0.001
-0.003
0.000
-0.001
-0.006
-0.010
△ in expenditure (£)
0.014
-0.076
-0.013
-0.034
-0.159
-0.269
△ in quantity (Lt)
0.025
-0.051
-0.014
-0.022
-0.122
-0.185
△ in energy (kcal)
1.225
-17.585
-5.628
-7.963
-3.985
-33.936
△ in protein(g)
0.021
-0.004
-0.059
-0.067
-0.021
-0.130
△ in carbohydrate(g)
0.241
-4.211
-1.272
-1.770
-0.582
-7.594
△ in sugar(g)
0.235
-3.984
-1.249
-1.576
-0.515
-7.089
△ in fat(g)
0.012
-0.002
-0.004
-0.029
-0.012
-0.036
△ in saturates(g)
0.002
-0.001
0.000
-0.017
-0.005
-0.021
△ in fibre(g)
0.004
-0.012
-0.017
-0.047
-0.024
-0.097
△ in sodium(g)
0.000
-0.002
-0.003
-0.004
-0.015
-0.025
Table A72: Policy simulation - regular soft drinks - by income (cont.) (Changes are in per capita per week terms)
Group
Category
Total
Mineral water
Soft drinks
Juices
Other drinks
Drinks with healthy claims
£50,000 - £59,999
△ in share
0.001
-0.005
-0.001
-0.001
-0.006
-0.012
△ in expenditure (£)
0.019
-0.118
-0.014
-0.032
-0.160
-0.304
△ in quantity (Lt)
0.034
-0.084
-0.015
-0.020
-0.132
-0.218
△ in energy (kcal)
0.864
-28.082
-5.138
-7.412
-3.669
-43.437
△ in protein(g)
0.028
-0.005
-0.037
-0.102
-0.016
-0.132
△ in carbohydrate(g)
0.115
-6.904
-1.165
-1.583
-0.499
-10.036
△ in sugar(g)
0.106
-6.585
-1.143
-1.394
-0.436
-9.452
△ in fat(g)
0.016
-0.003
-0.004
-0.027
-0.006
-0.022
△ in saturates(g)
0.002
-0.001
-0.001
-0.015
-0.004
-0.019
△ in fibre(g)
0.005
-0.015
-0.024
-0.036
-0.025
-0.095
△ in sodium(g)
0.000
-0.003
-0.002
-0.005
-0.012
-0.022
£60,000 - over
△ in share
0.000
-0.004
-0.001
0.000
-0.007
-0.013
△ in expenditure (£)
-0.008
-0.094
-0.022
-0.012
-0.192
-0.327
△ in quantity (Lt)
-0.013
-0.057
-0.023
-0.007
-0.141
-0.241
△ in energy (kcal)
-0.252
-20.417
-8.666
-2.540
-5.630
-37.504
△ in protein(g)
-0.006
-0.008
-0.093
-0.016
-0.022
-0.144
△ in carbohydrate(g)
-0.041
-4.953
-1.930
-0.566
-0.947
-8.437
△ in sugar(g)
-0.037
-4.689
-1.889
-0.540
-0.822
-7.977
△ in fat(g)
-0.003
-0.003
-0.008
-0.009
-0.009
-0.032
△ in saturates(g)
0.000
-0.001
-0.001
-0.003
-0.006
-0.013
△ in fibre(g)
-0.001
-0.015
-0.045
-0.019
-0.026
-0.107
△ in sodium(g)
0.000
-0.002
-0.014
-0.001
-0.016
-0.033
Table A73: Policy simulation - regular soft drinks - by life stage (Changes are in per capita per week terms)
Group
Category
Total
Mineral water
Soft drinks
Juices
Other drinks
Drinks with healthy claims
Per-family
△ in share
0.001
-0.004
-0.001
0.000
-0.007
-0.011
△ in expenditure (£)
0.018
-0.110
-0.018
-0.012
-0.198
-0.320
△ in quantity (Lt)
0.032
-0.076
-0.019
-0.007
-0.151
-0.222
△ in energy (kcal)
1.039
-27.605
-7.531
-2.826
-5.855
-42.779
△ in protein(g)
0.054
-0.006
-0.043
-0.069
-0.072
-0.135
△ in carbohydrate(g)
0.112
-6.702
-1.731
-0.557
-0.846
-9.725
△ in sugar(g)
0.102
-6.312
-1.692
-0.515
-0.745
-9.162
△ in fat(g)
0.031
-0.002
-0.004
-0.025
-0.032
-0.032
△ in saturates(g)
0.005
-0.001
-0.001
-0.015
-0.018
-0.029
△ in fibre(g)
0.010
-0.016
-0.020
-0.023
-0.038
-0.088
△ in sodium(g)
0.000
-0.003
-0.005
-0.002
-0.020
-0.029
Young family
△ in share
0.000
-0.003
-0.001
-0.001
-0.005
-0.010
△ in expenditure (£)
0.008
-0.057
-0.009
-0.023
-0.094
-0.175
△ in quantity (Lt)
0.015
-0.038
-0.010
-0.015
-0.076
-0.125
△ in energy (kcal)
0.444
-13.582
-4.246
-6.257
-2.541
-26.182
△ in protein(g)
0.026
-0.004
-0.024
-0.084
-0.018
-0.104
△ in carbohydrate(g)
0.038
-3.327
-0.973
-1.350
-0.348
-5.959
△ in sugar(g)
0.034
-3.184
-0.948
-1.280
-0.312
-5.689
△ in fat(g)
0.015
-0.001
-0.003
-0.034
-0.006
-0.029
△ in saturates(g)
0.002
0.000
0.000
-0.019
-0.004
-0.021
△ in fibre(g)
0.005
-0.007
-0.014
-0.034
-0.020
-0.070
△ in sodium(g)
0.000
-0.002
-0.001
-0.003
-0.011
-0.017
Middle family
△ in share
0.000
-0.004
0.000
-0.001
-0.005
-0.010
△ in expenditure (£)
-0.002
-0.076
0.002
-0.017
-0.103
-0.196
△ in quantity (Lt)
-0.004
-0.057
0.002
-0.012
-0.084
-0.155
△ in energy (kcal)
-0.075
-18.924
0.884
-4.237
-2.447
-24.798
△ in protein(g)
-0.002
-0.005
0.005
-0.062
-0.021
-0.084
△ in carbohydrate(g)
-0.013
-4.655
0.204
-0.903
-0.345
-5.711
△ in sugar(g)
-0.012
-4.475
0.199
-0.805
-0.300
-5.392
△ in fat(g)
-0.001
-0.002
0.001
-0.020
-0.005
-0.028
△ in saturates(g)
0.000
-0.001
0.000
-0.011
-0.003
-0.015
△ in fibre(g)
0.000
-0.013
0.003
-0.026
-0.019
-0.055
△ in sodium(g)
0.000
-0.002
0.000
-0.003
-0.010
-0.015
Table A74: Policy simulation - regular soft drinks - by life stage (cont.) (Changes are in per capita per week terms)
Group
Category
Total
Mineral water
Soft drinks
Juices
Other drinks
Drinks with healthy claims
Older family
△ in share
0.000
-0.006
0.000
-0.002
-0.009
-0.017
△ in expenditure (£)
0.003
-0.122
-0.008
-0.046
-0.169
-0.342
△ in quantity (Lt)
0.006
-0.093
-0.009
-0.030
-0.144
-0.270
△ in energy (kcal)
0.232
-30.528
-3.707
-10.580
-3.849
-48.432
△ in protein(g)
0.007
-0.005
-0.024
-0.201
-0.020
-0.243
△ in carbohydrate(g)
0.036
-7.522
-0.841
-2.169
-0.518
-11.014
△ in sugar(g)
0.034
-7.200
-0.812
-1.926
-0.448
-10.351
△ in fat(g)
0.004
-0.002
-0.002
-0.078
-0.005
-0.083
△ in saturates(g)
0.001
-0.001
0.000
-0.048
-0.003
-0.052
△ in fibre(g)
0.001
-0.017
-0.011
-0.085
-0.020
-0.131
△ in sodium(g)
0.000
-0.003
-0.001
-0.007
-0.015
-0.027
45+ no children
△ in share
0.001
-0.004
-0.001
-0.001
-0.005
-0.010
△ in expenditure (£)
0.020
-0.124
-0.025
-0.018
-0.163
-0.310
△ in quantity (Lt)
0.036
-0.088
-0.027
-0.011
-0.125
-0.216
△ in energy (kcal)
0.990
-29.411
-9.312
-4.091
-4.003
-45.828
△ in protein(g)
0.021
-0.007
-0.117
-0.069
-0.019
-0.190
△ in carbohydrate(g)
0.169
-7.148
-2.056
-0.839
-0.651
-10.525
△ in sugar(g)
0.158
-6.698
-2.002
-0.771
-0.581
-9.894
△ in fat(g)
0.012
-0.002
-0.013
-0.030
-0.005
-0.039
△ in saturates(g)
0.001
-0.001
-0.002
-0.017
-0.003
-0.022
△ in fibre(g)
0.004
-0.020
-0.074
-0.031
-0.021
-0.141
△ in sodium(g)
0.000
-0.004
-0.015
-0.002
-0.012
-0.033
7.5.9 Edible ices and ice cream
Table A75: Policy simulation - Edible ices and ice cream - by
SIMD (Changes are in per capita per week terms)
Group
Category
Total
Premium ice cream
Lollies
Other ice creams
Frozen confectionery
Private label
Branded
Private label
Branded
Private label
Branded
SIMD 1
△ in share
0.000
-0.001
-0.001
-0.002
0.000
0.000
0.000
-0.005
△ in expenditure (£)
-0.002
-0.034
-0.013
-0.057
-0.005
-0.013
0.002
-0.122
△ in quantity (Kg)
-0.001
-0.010
-0.004
-0.012
-0.002
-0.004
0.000
-0.032
△ in energy (kcal)
-1.402
-20.606
-8.951
-27.732
-4.777
-6.822
1.343
-68.947
△ in protein(g)
-0.020
-0.329
-0.100
-0.294
-0.058
-0.092
0.020
-0.873
△ in carbohydrate(g)
-0.174
-2.341
-1.060
-3.147
-0.647
-0.838
0.167
-8.040
△ in sugar(g)
-0.146
-1.988
-0.950
-2.761
-0.472
-0.628
0.112
-6.833
△ in fat(g)
-0.069
-1.091
-0.476
-1.507
-0.215
-0.340
0.066
-3.632
△ in saturates(g)
-0.047
-0.689
-0.324
-1.023
-0.165
-0.243
0.034
-2.456
△ in fibre(g)
-0.003
-0.047
-0.035
-0.048
-0.016
-0.025
0.006
-0.168
△ in sodium(g)
-0.001
-0.007
-0.002
-0.005
-0.001
-0.002
0.001
-0.017
SIMD 2
△ in share
0.000
-0.001
-0.001
-0.002
0.000
-0.001
0.000
-0.005
△ in expenditure (£)
0.000
-0.033
-0.017
-0.055
-0.005
-0.020
0.000
-0.129
△ in quantity (Kg)
0.000
-0.010
-0.005
-0.011
-0.002
-0.006
0.000
-0.034
△ in energy (kcal)
-0.080
-20.782
-11.539
-23.830
-3.905
-11.867
0.024
-71.980
△ in protein(g)
-0.001
-0.321
-0.125
-0.250
-0.048
-0.165
0.000
-0.911
△ in carbohydrate(g)
-0.010
-2.312
-1.347
-2.811
-0.540
-1.473
0.003
-8.490
△ in sugar(g)
-0.008
-1.949
-1.215
-2.464
-0.396
-1.148
0.002
-7.178
△ in fat(g)
-0.004
-1.130
-0.622
-1.253
-0.171
-0.583
0.001
-3.761
△ in saturates(g)
-0.003
-0.707
-0.427
-0.846
-0.130
-0.409
0.001
-2.521
△ in fibre(g)
0.000
-0.052
-0.042
-0.048
-0.013
-0.050
0.000
-0.206
△ in sodium(g)
0.000
-0.007
-0.003
-0.005
-0.001
-0.004
0.000
-0.019
SIMD 3
△ in share
0.000
-0.001
0.000
-0.002
0.000
0.000
0.000
-0.002
△ in expenditure (£)
0.008
-0.022
-0.012
-0.045
0.002
0.002
0.007
-0.061
△ in quantity (Kg)
0.003
-0.007
-0.004
-0.009
0.001
0.001
0.002
-0.013
△ in energy (kcal)
6.127
-14.426
-8.520
-19.821
1.309
1.344
5.025
-28.961
△ in protein(g)
0.085
-0.223
-0.094
-0.213
0.017
0.018
0.074
-0.335
△ in carbohydrate(g)
0.797
-1.626
-0.997
-2.322
0.170
0.161
0.625
-3.190
△ in sugar(g)
0.664
-1.380
-0.889
-2.065
0.129
0.129
0.419
-2.993
△ in fat(g)
0.285
-0.775
-0.457
-1.049
0.062
0.069
0.247
-1.617
△ in saturates(g)
0.197
-0.493
-0.310
-0.722
0.046
0.048
0.127
-1.108
△ in fibre(g)
0.018
-0.030
-0.028
-0.037
0.005
0.005
0.023
-0.046
△ in sodium(g)
0.002
-0.005
-0.002
-0.004
0.000
0.000
0.002
-0.006
Table A76: Policy simulation - Edible ices and ice cream - by
SIMD (cont.) (Changes are in per capita per week terms)
Group
Category
Total
Premium ice cream
Lollies
Other ice creams
Frozen confectionery
Private label
Branded
Private label
Branded
Private label
Branded
SIMD 4
△ in share
0.000
-0.001
-0.001
-0.002
0.000
-0.001
0.000
-0.004
△ in expenditure (£)
-0.001
-0.015
-0.016
-0.054
-0.006
-0.018
0.003
-0.107
△ in quantity (Kg)
-0.001
-0.004
-0.005
-0.011
-0.003
-0.005
0.001
-0.028
△ in energy (kcal)
-1.027
-9.263
-10.643
-24.783
-5.555
-10.868
1.948
-60.191
△ in protein(g)
-0.015
-0.145
-0.112
-0.269
-0.069
-0.147
0.029
-0.728
△ in carbohydrate(g)
-0.128
-1.053
-1.263
-2.843
-0.734
-1.359
0.242
-7.138
△ in sugar(g)
-0.107
-0.902
-1.140
-2.529
-0.541
-1.040
0.162
-6.097
△ in fat(g)
-0.050
-0.495
-0.566
-1.337
-0.257
-0.527
0.096
-3.137
△ in saturates(g)
-0.034
-0.313
-0.383
-0.911
-0.197
-0.367
0.049
-2.156
△ in fibre(g)
-0.003
-0.023
-0.036
-0.045
-0.019
-0.043
0.009
-0.159
△ in sodium(g)
0.000
-0.003
-0.003
-0.005
-0.001
-0.003
0.001
-0.015
SIMD 5
△ in share
0.000
-0.001
-0.001
-0.003
0.000
-0.001
0.000
-0.007
△ in expenditure (£)
-0.001
-0.024
-0.029
-0.093
-0.006
-0.035
-0.001
-0.190
△ in quantity (Kg)
0.000
-0.007
-0.009
-0.018
-0.003
-0.010
0.000
-0.048
△ in energy (kcal)
-0.730
-14.757
-19.977
-44.939
-5.522
-20.784
-1.050
-107.759
△ in protein(g)
-0.011
-0.233
-0.220
-0.499
-0.069
-0.278
-0.015
-1.326
△ in carbohydrate(g)
-0.092
-1.681
-2.258
-4.847
-0.706
-2.559
-0.131
-12.274
△ in sugar(g)
-0.078
-1.427
-2.025
-4.364
-0.518
-1.937
-0.088
-10.436
△ in fat(g)
-0.035
-0.787
-1.106
-2.552
-0.266
-1.036
-0.052
-5.834
△ in saturates(g)
-0.024
-0.500
-0.747
-1.774
-0.206
-0.738
-0.027
-4.016
△ in fibre(g)
-0.002
-0.033
-0.077
-0.078
-0.018
-0.075
-0.005
-0.288
△ in sodium(g)
0.000
-0.005
-0.005
-0.011
-0.001
-0.006
0.000
-0.028
Table A77: Policy simulation - Edible ices and ice cream - by rural urban (Changes are in per capita per week terms)
Group
Category
Total
Premium ice cream
Lollies
Other ice creams
Frozen confectionery
Private label
Branded
Private label
Branded
Private label
Branded
Lg. Urb. Areas
△ in share
0.000
-0.001
0.000
-0.002
0.000
-0.001
0.000
-0.005
△ in expenditure (£)
-0.001
-0.035
-0.013
-0.060
-0.006
-0.016
0.002
-0.128
△ in quantity (Kg)
0.000
-0.010
-0.004
-0.012
-0.003
-0.005
0.000
-0.033
△ in energy (kcal)
-0.822
-21.426
-9.264
-28.236
-5.198
-9.904
1.149
-73.702
△ in protein(g)
-0.012
-0.334
-0.100
-0.308
-0.064
-0.130
0.017
-0.931
△ in carbohydrate(g)
-0.100
-2.385
-1.042
-3.165
-0.700
-1.223
0.143
-8.471
△ in sugar(g)
-0.083
-2.039
-0.935
-2.790
-0.508
-0.938
0.096
-7.197
△ in fat(g)
-0.041
-1.167
-0.517
-1.552
-0.236
-0.492
0.057
-3.949
△ in saturates(g)
-0.028
-0.734
-0.353
-1.053
-0.178
-0.346
0.029
-2.664
△ in fibre(g)
-0.002
-0.047
-0.036
-0.054
-0.018
-0.037
0.005
-0.188
△ in sodium(g)
0.000
-0.008
-0.002
-0.006
-0.001
-0.003
0.000
-0.020
Oth. Urb. Areas
△ in share
0.000
-0.001
-0.001
-0.003
0.000
-0.001
0.000
-0.005
△ in expenditure (£)
-0.001
-0.024
-0.024
-0.073
-0.005
-0.023
0.001
-0.148
△ in quantity (Kg)
0.000
-0.007
-0.007
-0.015
-0.002
-0.007
0.000
-0.038
△ in energy (kcal)
-0.456
-15.302
-15.669
-33.193
-3.959
-13.034
0.813
-80.799
△ in protein(g)
-0.006
-0.240
-0.172
-0.357
-0.049
-0.181
0.012
-0.993
△ in carbohydrate(g)
-0.058
-1.733
-1.894
-3.802
-0.532
-1.592
0.101
-9.509
△ in sugar(g)
-0.048
-1.463
-1.703
-3.385
-0.399
-1.219
0.068
-8.149
△ in fat(g)
-0.022
-0.816
-0.815
-1.790
-0.179
-0.651
0.040
-4.234
△ in saturates(g)
-0.015
-0.517
-0.556
-1.232
-0.138
-0.464
0.021
-2.902
△ in fibre(g)
-0.001
-0.035
-0.056
-0.059
-0.014
-0.050
0.004
-0.211
△ in sodium(g)
0.000
-0.005
-0.004
-0.007
-0.001
-0.004
0.000
-0.021
Ac. Sm. Towns
△ in share
0.000
0.000
-0.001
-0.001
0.000
0.000
0.000
-0.003
△ in expenditure (£)
0.003
-0.011
-0.015
-0.036
-0.001
-0.010
0.001
-0.069
△ in quantity (Kg)
0.001
-0.003
-0.005
-0.007
-0.001
-0.003
0.000
-0.017
△ in energy (kcal)
1.956
-6.809
-10.221
-17.191
-1.082
-5.585
0.520
-38.413
△ in protein(g)
0.029
-0.103
-0.113
-0.189
-0.014
-0.075
0.008
-0.458
△ in carbohydrate(g)
0.259
-0.778
-1.170
-1.904
-0.144
-0.690
0.065
-4.362
△ in sugar(g)
0.214
-0.657
-1.047
-1.691
-0.104
-0.528
0.043
-3.769
△ in fat(g)
0.088
-0.362
-0.560
-0.957
-0.049
-0.277
0.026
-2.092
△ in saturates(g)
0.062
-0.230
-0.380
-0.655
-0.039
-0.194
0.013
-1.422
△ in fibre(g)
0.006
-0.016
-0.036
-0.032
-0.003
-0.023
0.002
-0.101
△ in sodium(g)
0.001
-0.002
-0.002
-0.003
0.000
-0.001
0.000
-0.009
Table A78: Policy simulation - Edible ices and ice cream - by rural urban (cont.) (Changes are in per capita per week terms)
Group
Category
Total
Premium ice cream
Lollies
Other ice creams
Frozen confectionery
Private label
Branded
Private label
Branded
Private label
Branded
Rm. Sm. Towns
△ in share
-0.001
-0.001
0.000
-0.002
0.000
0.000
0.000
-0.004
△ in expenditure (£)
-0.016
-0.028
-0.014
-0.043
-0.014
-0.002
0.001
-0.115
△ in quantity (Kg)
-0.007
-0.009
-0.004
-0.009
-0.006
-0.001
0.000
-0.035
△ in energy (kcal)
-13.060
-17.169
-9.965
-16.503
-11.099
-1.334
1.111
-68.019
△ in protein(g)
-0.163
-0.267
-0.108
-0.153
-0.141
-0.019
0.016
-0.834
△ in carbohydrate(g)
-1.797
-1.950
-1.114
-2.201
-1.475
-0.167
0.138
-8.566
△ in sugar(g)
-1.417
-1.625
-0.987
-1.872
-1.094
-0.127
0.093
-7.029
△ in fat(g)
-0.573
-0.908
-0.559
-0.761
-0.509
-0.065
0.055
-3.320
△ in saturates(g)
-0.405
-0.571
-0.383
-0.498
-0.376
-0.044
0.028
-2.250
△ in fibre(g)
-0.033
-0.092
-0.027
-0.038
-0.040
-0.005
0.005
-0.230
△ in sodium(g)
-0.004
-0.006
-0.002
-0.003
-0.003
0.000
0.000
-0.019
Ac. Rural
△ in share
0.000
-0.001
-0.001
-0.002
0.000
-0.001
0.000
-0.004
△ in expenditure (£)
0.003
-0.029
-0.015
-0.067
-0.003
-0.016
0.001
-0.126
△ in quantity (Kg)
0.001
-0.009
-0.005
-0.013
-0.001
-0.005
0.000
-0.031
△ in energy (kcal)
2.258
-17.477
-9.505
-30.748
-2.818
-9.296
0.645
-66.941
△ in protein(g)
0.032
-0.269
-0.101
-0.332
-0.035
-0.133
0.009
-0.829
△ in carbohydrate(g)
0.291
-1.985
-1.137
-3.535
-0.364
-1.131
0.080
-7.781
△ in sugar(g)
0.239
-1.688
-1.031
-3.155
-0.272
-0.894
0.054
-6.747
△ in fat(g)
0.106
-0.935
-0.500
-1.661
-0.135
-0.463
0.032
-3.556
△ in saturates(g)
0.073
-0.593
-0.339
-1.145
-0.101
-0.317
0.016
-2.405
△ in fibre(g)
0.006
-0.048
-0.033
-0.053
-0.009
-0.036
0.003
-0.169
△ in sodium(g)
0.001
-0.006
-0.002
-0.007
-0.001
-0.003
0.000
-0.018
Rm. Rural
△ in share
0.000
-0.001
0.000
-0.001
0.000
0.000
0.000
-0.002
△ in expenditure (£)
0.003
-0.020
-0.007
-0.020
-0.004
-0.003
0.001
-0.050
△ in quantity (Kg)
0.001
-0.006
-0.002
-0.004
-0.002
-0.001
0.000
-0.014
△ in energy (kcal)
2.105
-13.363
-4.966
-9.587
-3.749
-1.652
0.497
-30.714
△ in protein(g)
0.030
-0.213
-0.056
-0.104
-0.049
-0.022
0.007
-0.407
△ in carbohydrate(g)
0.272
-1.533
-0.578
-1.038
-0.465
-0.215
0.062
-3.496
△ in sugar(g)
0.225
-1.324
-0.518
-0.934
-0.353
-0.168
0.041
-3.031
△ in fat(g)
0.098
-0.708
-0.268
-0.545
-0.187
-0.077
0.024
-1.663
△ in saturates(g)
0.067
-0.451
-0.172
-0.371
-0.142
-0.054
0.013
-1.111
△ in fibre(g)
0.007
-0.018
-0.016
-0.018
-0.013
-0.008
0.002
-0.064
△ in sodium(g)
0.001
-0.004
-0.001
-0.002
-0.001
-0.001
0.000
-0.008
Table A79: Policy simulation - Edible ices and ice cream: by income (Changes are in per capita per week terms)
Group
Category
Total
Premium ice cream
Lollies
Other ice creams
Frozen confectionery
Private label
Branded
Private label
Branded
Private label
Branded
£0 - £29,999
△ in share
0.000
-0.001
-0.001
-0.002
0.000
-0.001
0.000
-0.004
△ in expenditure (£)
0.003
-0.026
-0.020
-0.060
-0.003
-0.014
0.003
-0.117
△ in quantity (Kg)
0.001
-0.008
-0.006
-0.012
-0.001
-0.004
0.001
-0.030
△ in energy (kcal)
2.389
-16.394
-14.125
-27.807
-2.698
-8.435
2.502
-64.570
△ in protein(g)
0.034
-0.252
-0.154
-0.298
-0.033
-0.115
0.037
-0.782
△ in carbohydrate(g)
0.304
-1.857
-1.648
-3.193
-0.359
-1.036
0.311
-7.476
△ in sugar(g)
0.250
-1.575
-1.482
-2.825
-0.264
-0.800
0.209
-6.487
△ in fat(g)
0.114
-0.877
-0.761
-1.498
-0.124
-0.419
0.123
-3.443
△ in saturates(g)
0.079
-0.556
-0.519
-1.020
-0.095
-0.295
0.063
-2.342
△ in fibre(g)
0.007
-0.040
-0.051
-0.052
-0.009
-0.032
0.012
-0.166
△ in sodium(g)
0.001
-0.005
-0.003
-0.006
-0.001
-0.003
0.001
-0.016
£30,000 - £39,999
△ in share
0.000
-0.001
-0.001
-0.002
0.000
-0.001
0.000
-0.005
△ in expenditure (£)
-0.003
-0.032
-0.013
-0.056
-0.007
-0.016
0.000
-0.127
△ in quantity (Kg)
-0.001
-0.010
-0.004
-0.011
-0.003
-0.005
0.000
-0.034
△ in energy (kcal)
-2.088
-20.196
-9.242
-26.198
-5.513
-9.348
-0.265
-72.850
△ in protein(g)
-0.029
-0.327
-0.104
-0.292
-0.072
-0.125
-0.004
-0.953
△ in carbohydrate(g)
-0.275
-2.235
-1.057
-2.874
-0.738
-1.142
-0.033
-8.353
△ in sugar(g)
-0.226
-1.905
-0.951
-2.561
-0.556
-0.880
-0.022
-7.101
△ in fat(g)
-0.095
-1.101
-0.507
-1.461
-0.250
-0.471
-0.013
-3.897
△ in saturates(g)
-0.066
-0.693
-0.343
-1.015
-0.190
-0.332
-0.007
-2.646
△ in fibre(g)
-0.006
-0.039
-0.032
-0.043
-0.019
-0.039
-0.001
-0.179
△ in sodium(g)
-0.001
-0.008
-0.002
-0.005
-0.001
-0.003
0.000
-0.020
£40,000 - £49,999
△ in share
0.000
-0.001
0.000
-0.003
0.000
-0.001
0.000
-0.006
△ in expenditure (£)
-0.001
-0.019
-0.011
-0.087
-0.007
-0.027
-0.004
-0.156
△ in quantity (Kg)
-0.001
-0.005
-0.003
-0.017
-0.003
-0.007
-0.001
-0.038
△ in energy (kcal)
-1.034
-11.404
-7.247
-39.552
-5.541
-15.039
-3.261
-83.078
△ in protein(g)
-0.015
-0.181
-0.077
-0.425
-0.068
-0.205
-0.048
-1.017
△ in carbohydrate(g)
-0.127
-1.285
-0.879
-4.541
-0.752
-1.898
-0.406
-9.889
△ in sugar(g)
-0.108
-1.096
-0.782
-4.056
-0.572
-1.403
-0.272
-8.289
△ in fat(g)
-0.051
-0.613
-0.377
-2.139
-0.250
-0.726
-0.160
-4.317
△ in saturates(g)
-0.035
-0.386
-0.254
-1.475
-0.186
-0.525
-0.083
-2.944
△ in fibre(g)
-0.003
-0.026
-0.024
-0.070
-0.018
-0.058
-0.015
-0.214
△ in sodium(g)
0.000
-0.004
-0.002
-0.008
-0.001
-0.004
-0.001
-0.021
Table A80 - Policy simulation - Edible ices and ice cream - by income (cont.) (Changes are in per capita per week terms)
Group
Category
Total
Premium ice cream
Lollies
Other ice creams
Frozen confectionery
Private label
Branded
Private label
Branded
Private label
Branded
£50,000 - £59,999
△ in share
0.000
-0.001
-0.001
-0.002
-0.001
-0.001
0.000
-0.005
△ in expenditure (£)
-0.002
-0.018
-0.016
-0.042
-0.014
-0.032
-0.004
-0.128
△ in quantity (Kg)
-0.001
-0.005
-0.005
-0.008
-0.006
-0.009
-0.001
-0.035
△ in energy (kcal)
-1.400
-10.682
-10.728
-18.507
-12.500
-18.604
-3.168
-75.588
△ in protein(g)
-0.022
-0.166
-0.116
-0.190
-0.152
-0.253
-0.046
-0.946
△ in carbohydrate(g)
-0.180
-1.197
-1.271
-2.183
-1.653
-2.308
-0.394
-9.185
△ in sugar(g)
-0.154
-1.027
-1.156
-1.906
-1.211
-1.835
-0.264
-7.553
△ in fat(g)
-0.065
-0.577
-0.570
-0.975
-0.581
-0.913
-0.156
-3.837
△ in saturates(g)
-0.044
-0.364
-0.387
-0.649
-0.422
-0.623
-0.080
-2.570
△ in fibre(g)
-0.004
-0.023
-0.045
-0.041
-0.042
-0.073
-0.015
-0.243
△ in sodium(g)
0.000
-0.003
-0.003
-0.004
-0.003
-0.006
-0.001
-0.021
£60,000 - over
△ in share
0.000
0.000
-0.001
-0.001
0.000
0.000
0.000
-0.003
△ in expenditure (£)
0.009
-0.011
-0.022
-0.030
-0.006
-0.009
0.001
-0.069
△ in quantity (Kg)
0.003
-0.003
-0.006
-0.006
-0.003
-0.003
0.000
-0.017
△ in energy (kcal)
7.127
-6.351
-14.074
-13.766
-6.023
-5.410
0.439
-38.058
△ in protein(g)
0.101
-0.100
-0.154
-0.148
-0.074
-0.075
0.006
-0.443
△ in carbohydrate(g)
0.830
-0.736
-1.677
-1.567
-0.783
-0.657
0.055
-4.536
△ in sugar(g)
0.720
-0.618
-1.463
-1.389
-0.583
-0.510
0.037
-3.806
△ in fat(g)
0.371
-0.333
-0.745
-0.751
-0.285
-0.272
0.022
-1.994
△ in saturates(g)
0.254
-0.212
-0.500
-0.510
-0.214
-0.185
0.011
-1.356
△ in fibre(g)
0.018
-0.017
-0.048
-0.028
-0.019
-0.020
0.002
-0.111
△ in sodium(g)
0.002
-0.002
-0.003
-0.003
-0.002
-0.002
0.000
-0.009
Table A81: Policy simulation - Edible ices and ice cream - by life stage (Changes are in per capita per week terms)
Group
Category
Total
Premium ice cream
Lollies
Other ice creams
Frozen confectionery
Private label
Branded
Private label
Branded
Private label
Branded
Pre-family
△ in share
0.000
-0.001
0.000
-0.001
0.000
0.000
0.000
-0.003
△ in expenditure (£)
0.005
-0.042
-0.013
-0.033
0.004
-0.009
0.003
-0.084
△ in quantity (Kg)
0.002
-0.011
-0.004
-0.006
0.002
-0.002
0.001
-0.020
△ in energy (kcal)
3.577
-25.167
-8.504
-14.794
3.046
-4.960
2.492
-44.310
△ in protein(g)
0.052
-0.387
-0.099
-0.155
0.038
-0.065
0.036
-0.579
△ in carbohydrate(g)
0.439
-2.811
-0.998
-1.699
0.414
-0.617
0.310
-4.962
△ in sugar(g)
0.365
-2.373
-0.887
-1.505
0.308
-0.453
0.208
-4.336
△ in fat(g)
0.178
-1.365
-0.453
-0.799
0.137
-0.245
0.123
-2.426
△ in saturates(g)
0.119
-0.851
-0.309
-0.541
0.104
-0.172
0.063
-1.587
△ in fibre(g)
0.008
-0.051
-0.033
-0.026
0.010
-0.020
0.012
-0.101
△ in sodium(g)
0.001
-0.009
-0.002
-0.003
0.001
-0.001
0.001
-0.012
Young family
△ in share
0.000
-0.001
0.000
-0.002
0.000
-0.001
0.000
-0.004
△ in expenditure (£)
-0.003
-0.020
-0.009
-0.029
-0.005
-0.010
0.000
-0.076
△ in quantity (Kg)
-0.001
-0.006
-0.003
-0.006
-0.002
-0.003
0.000
-0.021
△ in energy (kcal)
-2.383
-12.397
-5.694
-12.643
-4.374
-5.422
-0.347
-43.259
△ in protein(g)
-0.035
-0.195
-0.063
-0.131
-0.053
-0.075
-0.005
-0.557
△ in carbohydrate(g)
-0.305
-1.370
-0.691
-1.537
-0.611
-0.679
-0.043
-5.235
△ in sugar(g)
-0.254
-1.172
-0.622
-1.336
-0.436
-0.494
-0.029
-4.344
△ in fat(g)
-0.113
-0.677
-0.295
-0.646
-0.188
-0.262
-0.017
-2.199
△ in saturates(g)
-0.076
-0.424
-0.201
-0.431
-0.146
-0.182
-0.009
-1.469
△ in fibre(g)
-0.006
-0.031
-0.021
-0.030
-0.014
-0.019
-0.002
-0.123
△ in sodium(g)
-0.001
-0.004
-0.001
-0.003
-0.001
-0.002
0.000
-0.012
Middle family
△ in share
0.000
-0.001
-0.001
-0.002
0.000
-0.001
0.000
-0.005
△ in expenditure (£)
-0.002
-0.027
-0.011
-0.040
-0.005
-0.024
-0.001
-0.109
△ in quantity (Kg)
-0.001
-0.008
-0.004
-0.008
-0.002
-0.006
0.000
-0.029
△ in energy (kcal)
-1.601
-15.954
-6.668
-18.327
-3.796
-13.636
-0.411
-60.394
△ in protein(g)
-0.024
-0.252
-0.074
-0.199
-0.046
-0.183
-0.006
-0.785
△ in carbohydrate(g)
-0.212
-1.811
-0.873
-2.112
-0.510
-1.722
-0.051
-7.291
△ in sugar(g)
-0.176
-1.538
-0.777
-1.870
-0.366
-1.288
-0.034
-6.050
△ in fat(g)
-0.072
-0.848
-0.316
-0.985
-0.172
-0.657
-0.020
-3.071
△ in saturates(g)
-0.050
-0.540
-0.216
-0.673
-0.133
-0.468
-0.010
-2.090
△ in fibre(g)
-0.006
-0.042
-0.025
-0.036
-0.013
-0.050
-0.002
-0.173
△ in sodium(g)
-0.001
-0.006
-0.002
-0.004
-0.001
-0.004
0.000
-0.017
Table A82: Policy simulation - Edible ices and ice cream - by life stage (cont.) (Changes are in per capita per week terms)
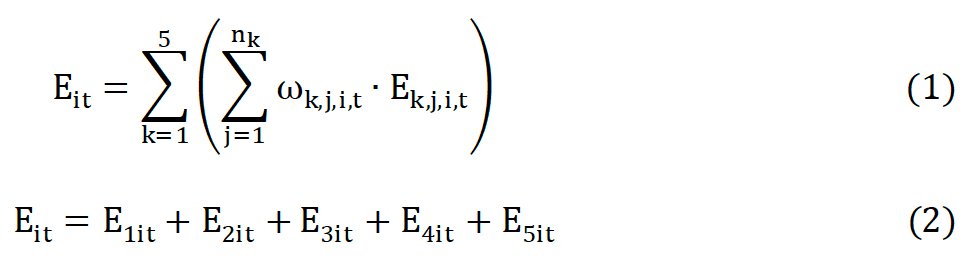
 is the weight assigned to the purchase and E is the expenditure, j index represents the product and n1, n2, n3, n4 and n5 are the number of products belonging to category i, purchased under full price and each promotion type.
  ) on the expenditure category by full price sales and each type of promotion. This is presented in (3):
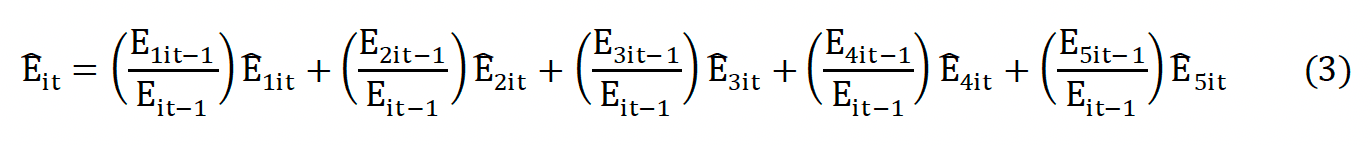
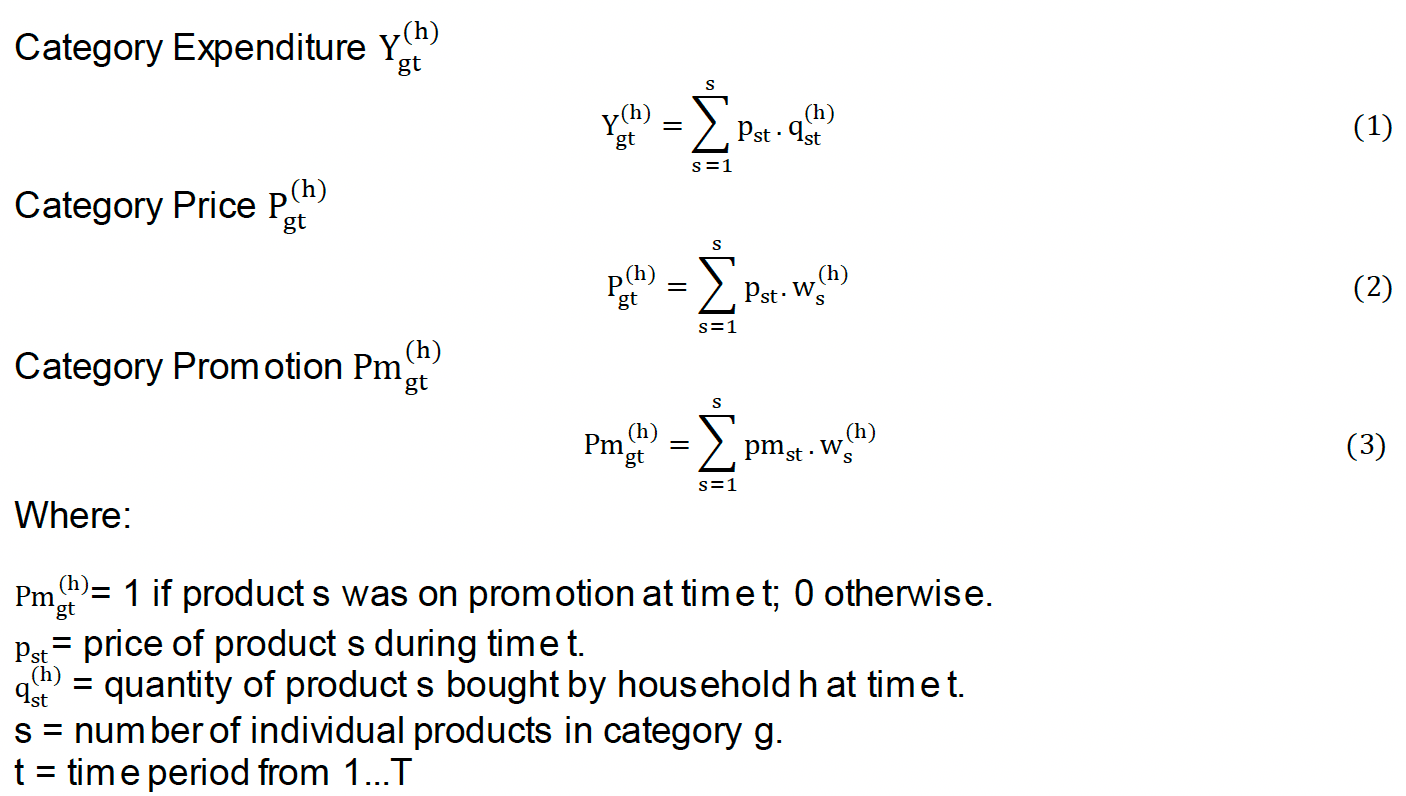
 , will be calculated as follow:
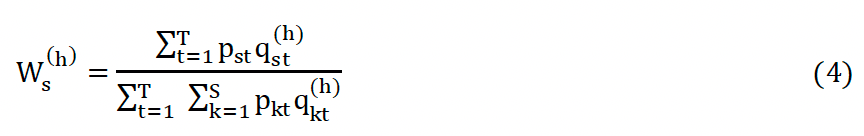
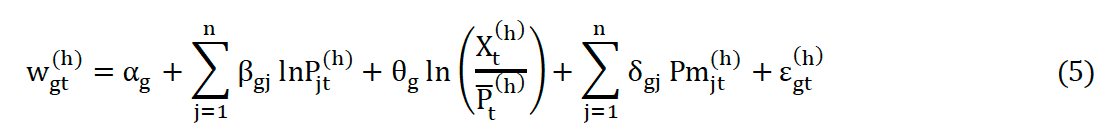
 is the expenditure share allocated to category g by household h,
  are the prices encountered by household h for each of the n categories (j=1..n),
  is the expenditure of household h and
  is a price index. The fact that the information is calculated at the level of the household partially reduced the quality problems brought by aggregation.
 was approximated by the Stone price index (i.e.
 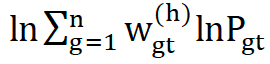 ), making the budget share equation to be linear in the parameters. The system (5) was estimated by iterative seemingly unrelated regressions and imposing constraints related to adding up, homogeneity and symmetry (6)[7]:
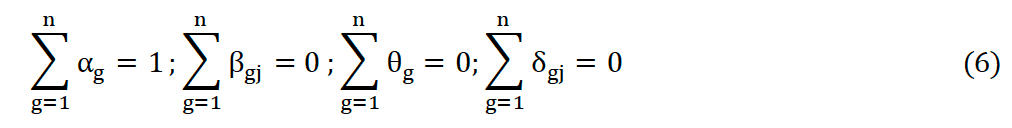
 ), given by:
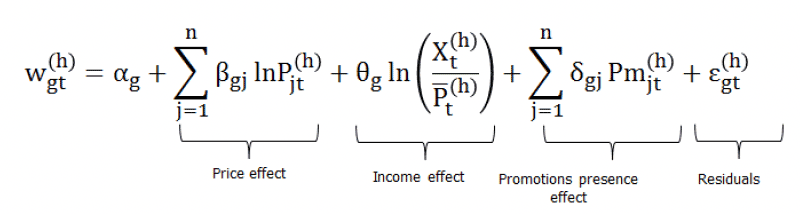
 ) when the advertising of promotions have been set equal to zero (i.e.,
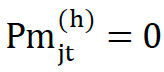 . Since the income and the prices are kept constant, for any group, the nutritional changes for nutrient i, for food category g, due to the measures were evaluated at the means of the variables using the following formula (7):
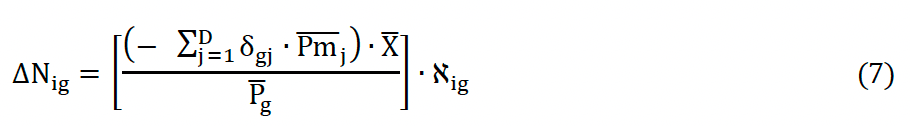
 is the average promotion for food category j,
  is the average expenditure for the group,
  is the average price of category g
  and is nutrient i coefficient (e.g., saturates per 100 grams) of category g. Note that promotions for products that are not discretionary are still in place.