Reducing health harms of foods high in fat, sugar or salt: economic modelling – final report
This project modelled the impact of restricting in-premise all price promotions of discretionary foods on sales and on total calories purchased.
3. Methods
3.1 This section presents the data and methodology used for (1) for the demand analysis models and (2) the economic choice experiment analyses followed by the statistical methods performed.
3.1 Data
3.1.1 Promotions' contribution to sales and demand analysis models
3.2 Figure 3 presents the structure of the dataset used for the analysis of promotions' contribution to sales and the estimation of demand models. The data used for the analysis were from the Kantar Worldpanel dataset for Scotland from 2013 to 2018, which provide information about purchases at the level of products by households and whether they were made under a price promotion (e.g., x GBP pounds less). It also includes product nutrient data (i.e., back or side of packaging nutrition information). The panel does not provide any information on whether concurrent placement promotions are also be used at the same time as price promotions.
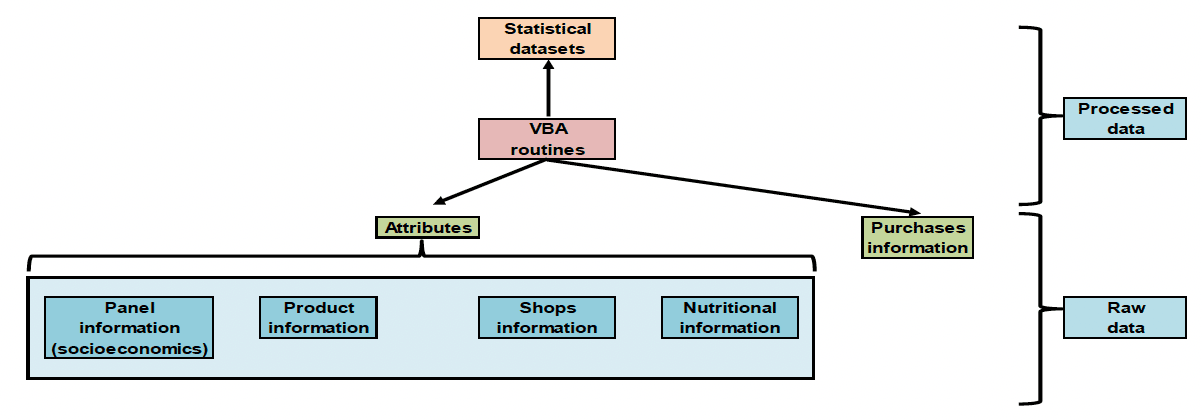
Note: The figure reads from bottom to top. Purchases information include whether the product was bought under promotion and the type of promotion (as well as price, quantity, shop and household). VBA stands for Visual Basic for Application, which is the programming language used to process the data. The statistical datasets are the resulting dataset that is used for the estimation of the demand analysis models.
3.3 To reduce the differences between purchases and consumption the data by household were aggregated on annual terms, and to eliminate differences in the number of individuals in households and the number of weeks that households were observed, the data were expressed as per capita (i.e., dividing the data by the total number of individuals in the household) weekly averages. Moreover, only households that were observed a minimum of 40 weeks in a year were included in the analysis. The total number of observations (i.e., households) for the analysis was 9,914, with several households being observed more than once.
3.4 For the inter-category analysis: nineteen categories were considered for the analysis; these were the aforementioned categories of discretionary foods plus dairy products, meat and fish, fats and eggs, fruit, vegetables, grains, prepared ready to eat foods, sugar and preserves, condiments and sauces, low calories soft drinks and juices, alcoholic beverages and a numeraire category including all other products (i.e., non-food). Detailed information about the components of each category is provided in the Excel files accompanying the data. Non-food products were included in order to be able to model households' total expenditure on groceries. This is needed because some of the savings made on the reduction of purchases of discretionary foods may go to non-food products.
3.5 For the intra-category analyses, food items were identified and regrouped into subgroups within the discretionary categories in order to derive a sufficient number of sub groups, categorised as follows: take home confectionery, biscuits, take home savouries, cakes, pastries and higher fats and sugar morning goods, total puddings and desserts, take home drinks, edible ices and ice cream. The market shares of the sub-categories (under full price and promotions) within these categories are presented in Tables A1 to A8 in the appendix. The classification of the aforementioned categories of discretionary foods were:
3.6 Take home confectionery - Chocolate confectionery private label, chocolate confectionery branded, egg, novelty and seasonal sweets, sugar confectionery private label, sugar confectionery branded and other confectionery.
3.7 Biscuits - Cereal and fruit bars, chocolate biscuit bars and children biscuits, everyday biscuits and treats, crackers and crispbreads, special treats and seasonal biscuits, healthier biscuits.
3.8 Take home savouries - Crisps private label, crisps branded, savoury snacks private label, savoury snacks branded, nuts, popcorn.
3.9 Cakes, pastries and higher fats and sugar morning goods - Cakes private label, cakes branded, pastries private label, pastries branded, morning goods private label, morning goods branded.
3.10 Total puddings and desserts - Ambient bakery products, canned goods and frozen confectionery, sweet home cooking, chilled convenience private label, chilled convenience branded, products with healthy claims.
3.11 Take home drinks - Mineral water, soft drinks, juices, other drinks, drinks with healthy claims.
3.12 Edible ices and ice cream - Premium ice creams private label, premium ice creams branded, lollies private label, lollies branded, other ice cream private label, other ice cream branded, frozen confectionery.
3.13 The available nutrients in the dataset were calories, proteins, carbohydrates, sugar, fats, saturates, fibre and sodium.
3.14 Households were classified in four different ways: by quintile of the SIMD (i.e., where the first quintile is the most deprived one), by Rural-Urban classification (i.e., large urban areas, other urban areas, accessible small towns, remote small towns, accessible rural towns and remote rural towns), by household income ranges[3] (i.e., £0 - £29,999, £30,000 - £39,999, £40,000 - £49,999, £50,000 - £59,999, £60,000 - over) and by life stage groups (pre-family, young family, middle family, older family and 45+ without children)[4]. A separate analysis was run for each socioeconomic group.
3.1.2 Economic choice experiment
3.15 The data were collected in the UK through a national web-based choice experiment. A choice experiment is a quantitative research technique that involves asking individuals to state their preference for hypothetical alternative scenarios, products or services. Each alternative is described by several attributes. Individuals' responses are used to determine whether their preferences are significantly influenced by the attributes of the studied product or service. The responses are also used to determine the relative importance of the attributes.
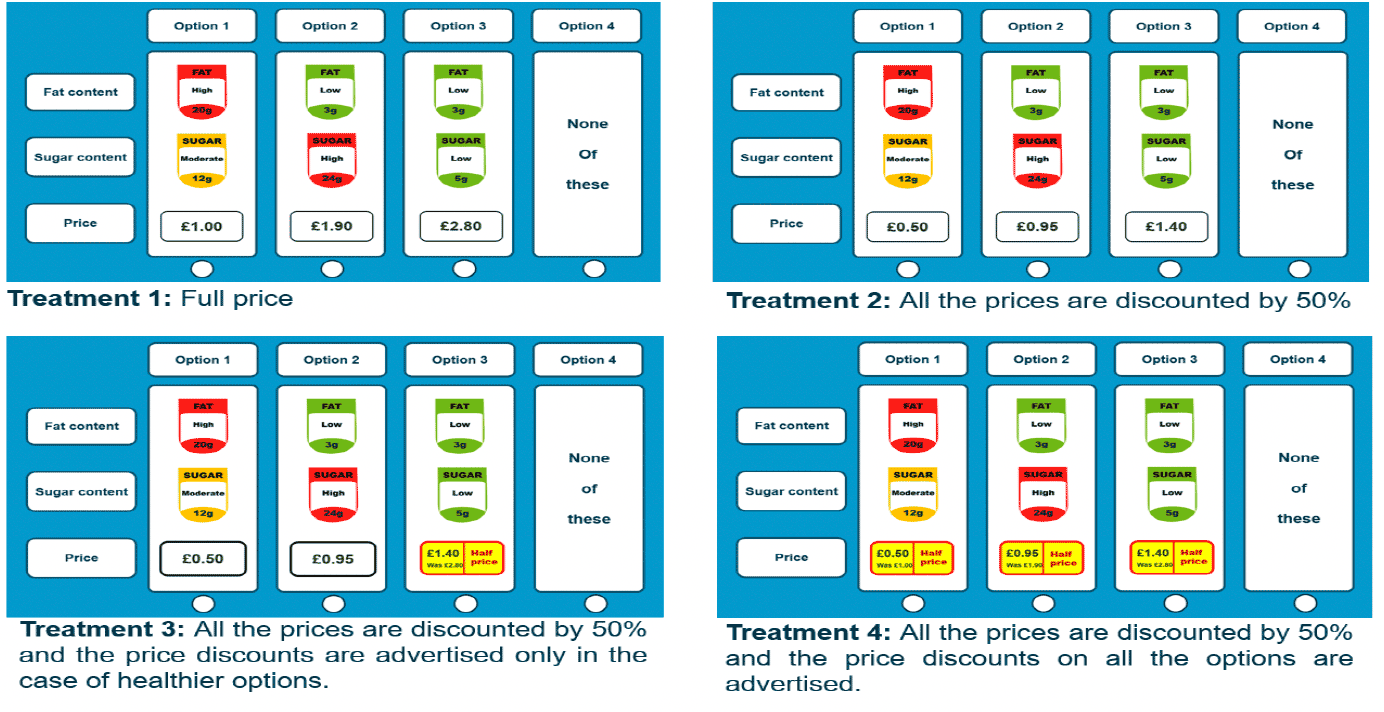
3.16 To assess the effect of restricting advertising price discounts on consumers' choices of chocolates, biscuits and crisps, four options or "treatments" were considered. Each respondent was randomly assigned to one of four treatments (500 respondents per treatment). In the first treatment, respondents were shown the full price of chocolates, biscuits and crisps (i.e., the prices were not discounted). In the second treatment, the prices of chocolates, biscuits and crisps were discounted by 50 per cent, but the price discount was not advertised. In the third treatment, the prices of chocolates, biscuits and crisps were discounted by 50 per cent and the price discounts were not advertised in the case of chocolates, biscuits and crisps with high levels of sugar, fat, or salt. In the fourth treatment, the prices of standard (unhealthier) and non-standard (healthier) chocolates, biscuits, and crisps were discounted by 50 per cent and the discounts for all were advertised.
3.17 The final design of the choice experiment was developed and revised based on input from a pilot study of 100 respondents. Two thousand primary grocery shoppers in the UK completed the survey. The sampled respondents in each treatment were required to be representative of the UK population in terms of gender, age, employment status and nations of the UK (i.e., Scotland, England, Wales, and Northern Ireland). Only consumers of chocolates, biscuits, and crisps were eligible to take part in the study. All respondents gave their informed consent for inclusion before taking part in the study. The quality of the data was checked, and all ineligible observations (e.g respondents who did not fully complete the survey) were discarded and replaced by eligible ones from new respondents (i.e., leaving the final sample size equal to 2,000).
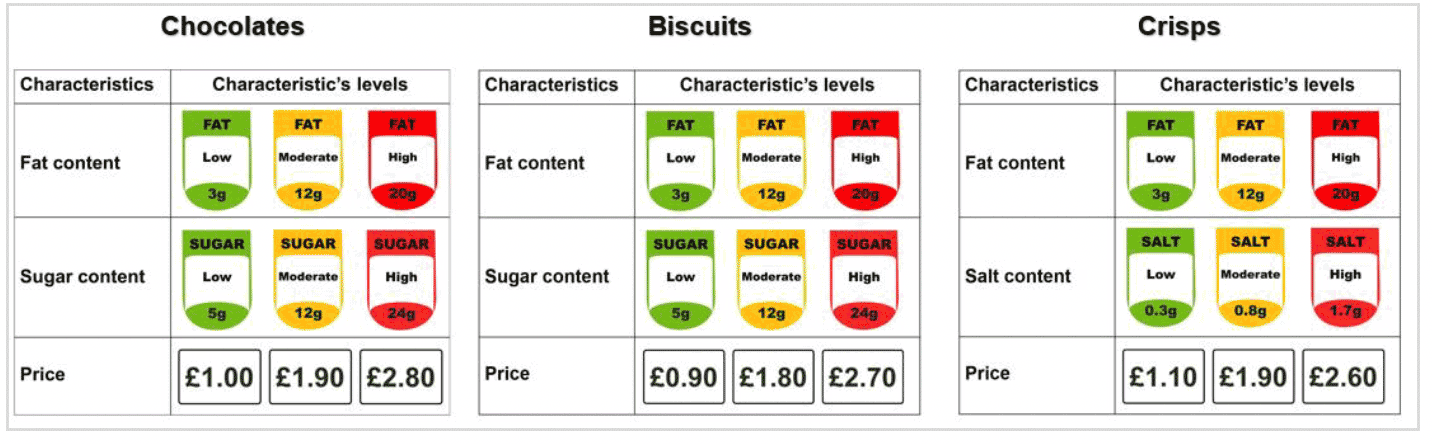
3.18 The survey for the choice experiment consisted of a choice task and a questionnaire. In the choice task, all respondents were successively shown nine choice sets (i.e., three choice sets for chocolates, three choice sets for biscuits, and three choice sets for crisps). Each choice set consists of three hypothetical alternatives of chocolates, biscuits, or crisps and an opt-out alternative. The three hypothetical alternatives are described in terms of three attributes (fat content, sugar content and price in the case of chocolates and biscuits; and fat content, salt content and price in the case of crisps). The attributes and attributes' levels that were used to describe the alternatives of chocolates, biscuits and crisps are displayed in Figure 4.
3.19 For each one of the three products, the levels of the three attributes were combined and the obtained combinations were arranged in choice sets (i.e., three hypothetical combinations/alternatives and an opt-out alternative).
3.20 The hypothetical alternatives were arranged in choice sets in a way that aims to result in data that generates parameter estimates that minimise estimated standard errors. In each choice set, respondents were asked to mark the alternative they prefer most. An example of a choice set used in treatments 1-4 is displayed in Figure 5. After finishing the choice task respondents were requested to complete a short questionnaire to collect information on individuals' attitudes, habits and socio-demographics.
3.2 Methodological approach
3.21 The methodology to be used to address the research questions consisted of two methods: the demand analysis models (i.e., inter-category demand models, and intra-category demand models) and the economic choice experiments. These are briefly presented below.
3.2.1 Promotions' contribution to discretionary food sales
3.22 The analysis consisted of computing the importance (or share) of the total sales of each discretionary food category according to each type of promotion. This was done by aggregating the sales by product within each food category and type of promotion by year and calculating the shares.
3.23 Once the annual sales by discretionary food category by type of promotion were computed, the contribution to the sales growth on the expenditure category by each type of promotion and by full price sales were computed (a detailed description is presented in section 8.1 in the annex).
3.2.2 Demand models
Inter-category model
3.24 The questions being addressed in this analysis relate to the changes in the purchase of food and drink discretionary categories if the price promotions on these categories were no longer applied. In addition, the question of which foods act as substitutes for the discretionary foods and what the potential impact would be in calorific and nutritional terms from the restricted products is addressed.
3.25 The method used in this part of the work followed Dreze et al. (2004), who modified the share equations of Deaton and Muellbauer's Almost Ideal Demand System (AIDS) consumer demand model (Deaton and Muellbauer, 1980) by including indicators of promotions.
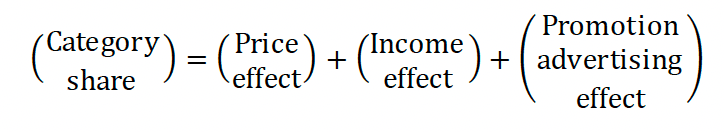
3.26 For the analysis, the expenditure, price, and promotion for each category were computed for each household. The model comprised the estimation of the shares (with respect to the total grocery expenditure) of consumers' budget spent on each food and non-food category with respect to prices, total expenditure on groceries in real terms and indicator of promotions. For each category the share equation consisted of the following effects:
3.27 The simulation consisted of eliminating the promotions advertising effect and computing the category shares keeping the income and prices constant. Total expenditure per category was then calculated by multiplying the new shares by the total expenditure on groceries. Dividing the expenditure by the average price of the category provided the resulting quantities. To compute the energy and nutrients, the quantities were multiplied by the energy and nutrient coefficients (a detail description is presented in section 8.2 in the annex).
Substitution towards non-discretionary food and drink products
3.28 The purpose of this analysis was to investigate the effects on purchases of other food and drink products that arise due to changes of purchased discretionary products following a promotion restriction. In this context the interest is whether there would be a potential reallocation of money to other food products with an impact on the purchase of nutrients.
3.29 This was investigated using the inter-category demand model results, which provided estimates of the change in quantities and nutrition of other products when the advertising of price promotions is restricted. The analysis assumed that the promotions of other food and drink products remained the same (i.e., their advertising is not restricted).
Intra-category models
3.30 The purpose of this part of the work was to analyse how sensitive the purchases of discretionary products would be to changes in prices and the advertising of promotions within their category. This follows the assumption that product substitution may occur within the product category (i.e., within the discretionary products) and this may bring changes in terms of nutrients.
3.31 In terms of methods, these were the same as those used for inter-category models but without disaggregating expenditure on other food and drink or non-food categories. Note that because of the different composition of the model, the results will not be the same as the inter-category results and focus should therefore be on purchasing changes within the discretionary groups.
3.2.3 Choice experiment
3.32 The effect of restricting advertising of price discounts is assessed comparing respondents' choices in: (a) treatment 2 (i.e., where the prices of all the products were discounted but the price discounts were not advertised) and in treatment 3 (i.e., where the price discounts were not advertised in the case of products with higher fat, sugar, or salt content), (b) treatment 2 and treatment 4 (i.e., where all the prices were discounted by 50 per cent and the price discounts were advertised for all the products), and (c) treatment 3 and treatment 4[5].
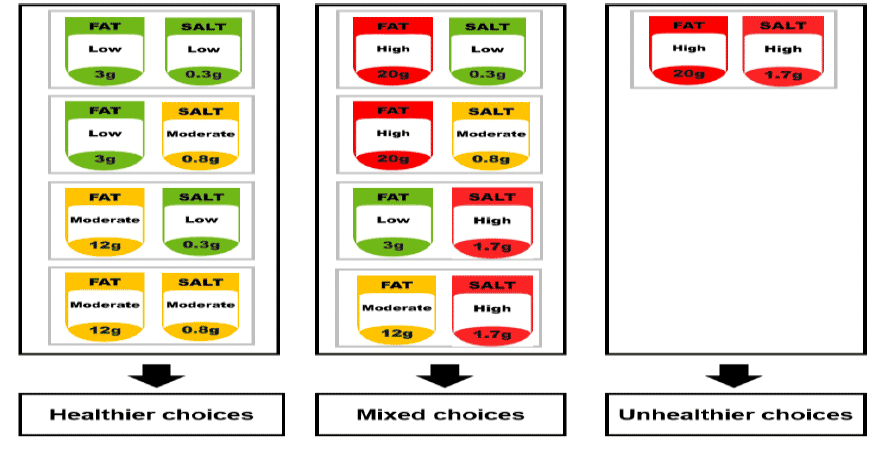
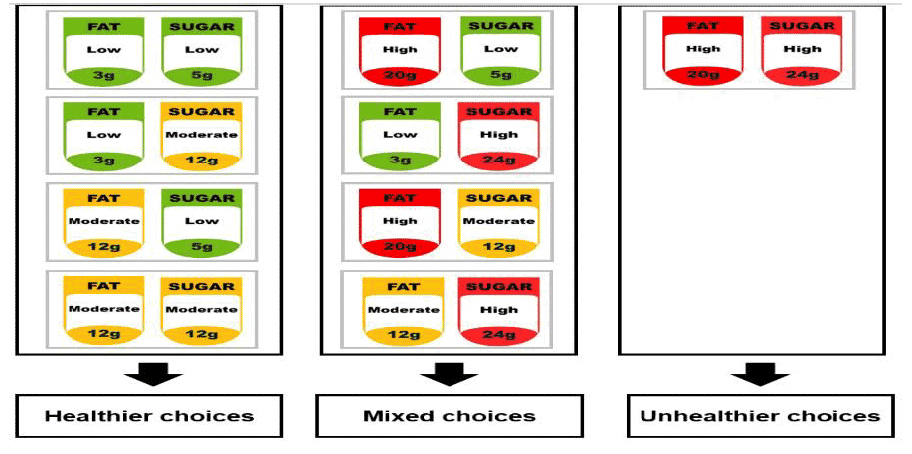
3.33 For ease of presentation and interpretation of the results, we classified respondents' choices in three categories depending on the products' content in terms of sugar, fat and salt. The approach used to classify respondents' choices is displayed in Figure 6 (for crisps) and Figure 7 (for chocolates and biscuits). For example, in the case of crisps, all chosen crisps with low/moderate fat content and low/moderate salt content were classified as "healthier" choices. All the chosen crisps that are higher in fat and salt were classified as "unhealthier" choices. Finally, all the chosen crisps that are either higher in fat and low/moderate in salt or higher in salt and low/moderate in fat were classified as "mixed" choices.
3.34 Table 5 (chocolates), 6 (biscuits), and 7 (crisps) summarise the results of counting the number of choices as well as the total number of products' alternatives that were available to respondents to choose from. For example, in the case of chocolates (Table 5), respondents in treatment 2 saw 2127 healthier chocolates[6]. They chose 745 chocolates out of them, which represent 35 per cent of all the chocolates that were available to the 500 respondents (i.e., 35 per cent = (745/2,127)*100).
3.35 To compare respondents' choices across treatments, we used the "two-proportion z-test". We compared percentages instead of comparing the number of chosen products because the total number of observed products is not equal across treatments. The null hypothesis for the test is that the proportions of chosen products across treatments are the same. The proportions of chosen products are significantly different across treatments only if the p-value is equal or lower than 0.05. The results of the analysis are presented and commented in section 5.5.
| Treatment 2 | Treatment 3 | Treatment 4 | ||
|---|---|---|---|---|
| Healthier choices | Number of products | 2127 | 2110 | 2145 |
| Chosen products | 745 | 762 | 759 | |
| % of chosen products | 35 | 36 | 35 | |
| Mixed choices | Number of products | 2248 | 2262 | 2,240 |
| Chosen products | 369 | 407 | 391 | |
| % of chosen products | 16 | 18 | 17 | |
| Unhealthier choices | Number of products | 125 | 128 | 115 |
| Chosen products | 22 | 20 | 22 | |
| % of chosen products | 18 | 16 | 19 |
| Treatment 2 | Treatment 3 | Treatment 4 | ||
|---|---|---|---|---|
| Healthier choices | Number of products | 2126 | 2113 | 2150 |
| Chosen products | 743 | 752 | 806 | |
| % of chosen products | 35 | 36 | 37 | |
| Mixed choices | Number of products | 2250 | 2256 | 2230 |
| Chosen products | 358 | 382 | 365 | |
| % of chosen products | 16 | 17 | 16 | |
| Unhealthier choices | Number of products | 124 | 131 | 120 |
| Chosen products | 23 | 27 | 20 | |
| % of chosen products | 19 | 21 | 17 |
| Treatment 2 | Treatment 3 | Treatment 4 | ||
|---|---|---|---|---|
| Healthier choices | Total number of products | 2127 | 2140 | 2103 |
| Chosen products | 731 | 772 | 754 | |
| % of chosen products | 34 | 36 | 36 | |
| Mixed choices | Total number of products | 2244 | 2238 | 2264 |
| Chosen products | 361 | 364 | 383 | |
| % of chosen products | 16 | 16 | 17 | |
| Unhealthier choices | Total number of products | 129 | 122 | 133 |
| Chosen products | 12 | 20 | 20 | |
| % of chosen products | 9 | 16 | 15 |
Contact
Email: DietPolicy@gov.scot