Reducing health harms of foods high in fat, sugar or salt: economic modelling – final report
This project modelled the impact of restricting in-premise all price promotions of discretionary foods on sales and on total calories purchased.
4. Findings
4.1 This section presents the results from the estimations, starting from the inter-category model (which presents both the net nutritional estimates through inclusion of substitution effects across discretionary categories), followed by the intra-category models). The demand models present, first, the results considering the entire sample followed by four figures that break them down by the different household classifications (i.e., SIMD, rural-urban, income and life stage). It ends with the presentation of the choice experiment results. The econometric results and estimated elasticities for each model are reported in the accompanying Excel files.
4.1 Promotions' contribution to discretionary food sales
4.2 Table 8 to 14 present the information about the importance (share) of the sales under the different promotions on the total sales of discretionary foods for the period 2013 to 2018. They also measure the contribution of promotions to the sales of each category. Further details are provided in the accompanying Excel files.
4.3 All the categories, except for 'Edible ices and ice cream', show that an increasing proportion is being sold under no promotion (i.e., at full price). In the case of Edible ices and ice cream, the proportion sold under full price remained stable during the period.
4.4 Considering the promotions, temporary price reductions appears as the most important one but there are some differences by category. For 2018, the share of temporary price reduction ranges from 16.4 per cent (Table 11, Ambient cakes and pastries) to 35.2 per cent (Table 10, Take home savouries), although in most of the categories the proportion is above 30 per cent. Y for £X promotions are next in importance but appear much lower in share compared with temporary price reductions.
4.5 The contribution to growth analysis breakdowns the growth on each category by the contribution of full price and the different promotions. As shown in Tables 8-14 there is no consistent pattern across categories and over time (i.e., a type of promotion that always contributes positively to sales).
| Years | ||||||
|---|---|---|---|---|---|---|
| 2013 | 2014 | 2015 | 2016 | 2017 | 2018 | |
| Shares (%) | 100.0 | 100.0 | 100.0 | 100.0 | 100.0 | 100.0 |
| Full price | 51.6 | 52.2 | 52.3 | 54.1 | 58.1 | 59.0 |
| Temporary price reduction | 36.9 | 37.1 | 38.0 | 36.2 | 33.2 | 32.9 |
| Multibuy | 0.9 | 1.0 | 0.4 | 0.6 | 0.3 | 0.3 |
| Y for £X | 9.8 | 9.1 | 8.8 | 8.6 | 8.1 | 7.7 |
| Other promotions | 0.7 | 0.5 | 0.5 | 0.5 | 0.3 | 0.2 |
| Growth rate (%) | 2013/12 | 2014/13 | 2015/14 | 2016/15 | 2017/16 | 2018/17 |
| Purchases | .. | 1.9 | 8.8 | -1.7 | 16.7 | 2.9 |
| Full price | .. | 3.2 | 9.0 | 1.6 | 25.3 | 4.5 |
| Temporary price reduction | .. | 2.4 | 11.6 | -6.4 | 7.0 | 1.8 |
| Multibuy | .. | 8.0 | -56.9 | 38.3 | -41.9 | -3.8 |
| Y for £X | .. | -5.3 | 4.4 | -3.5 | 9.8 | -2.4 |
| Other promotions | .. | -20.9 | 6.7 | -0.5 | -31.1 | -40.8 |
| Contribution to growth (%) | .. | 1.9 | 8.8 | -1.7 | 16.7 | 2.9 |
| Full price | .. | 1.7 | 4.7 | 0.9 | 14.7 | 2.7 |
| Temporary price reduction | .. | 0.9 | 4.4 | -2.3 | 2.3 | 0.6 |
| Multibuy | .. | 0.1 | -0.2 | 0.2 | -0.1 | 0.0 |
| Y for £X | .. | -0.5 | 0.4 | -0.3 | 0.8 | -0.2 |
| Other promotions | .. | -0.1 | 0.0 | 0.0 | -0.1 | -0.1 |
| Years | ||||||
|---|---|---|---|---|---|---|
| 2013 | 2014 | 2015 | 2016 | 2017 | 2018 | |
| Shares (%) | 100.0 | 100.0 | 100.0 | 100.0 | 100.0 | 100.0 |
| Full price | 56.5 | 54.2 | 51.7 | 55.2 | 59.7 | 60.5 |
| Temporary price reduction | 35.7 | 35.2 | 36.3 | 37.1 | 35.3 | 34.0 |
| Multibuy | 1.4 | 0.5 | 0.4 | 0.1 | 0.2 | 0.9 |
| Y for £X | 5.4 | 9.2 | 10.8 | 6.7 | 4.0 | 4.2 |
| Other promotions | 1.0 | 1.0 | 0.8 | 0.9 | 0.8 | 0.5 |
| Growth rate (%) | 2013/12 | 2014/13 | 2015/14 | 2016/15 | 2017/16 | 2018/17 |
| Purchases | .. | -0.9 | 6.2 | -6.2 | 15.3 | -0.7 |
| Full price | .. | -5.0 | 1.3 | 0.1 | 24.8 | 0.5 |
| Temporary price reduction | .. | -2.5 | 9.6 | -4.1 | 9.8 | -4.4 |
| Multibuy | .. | -65.8 | -6.5 | -73.4 | 93.9 | 327.1 |
| Y for £X | .. | 68.5 | 24.5 | -41.3 | -31.6 | 5.1 |
| Other promotions | .. | -1.8 | -12.1 | -0.6 | 4.4 | -43.2 |
| Contribution to growth (%) | .. | -0.9 | 6.2 | -6.2 | 15.3 | -0.7 |
| Full price | .. | -2.7 | 0.7 | 0.1 | 14.8 | 0.3 |
| Temporary price reduction | .. | -0.9 | 3.5 | -1.5 | 3.4 | -1.5 |
| Multibuy | .. | -0.3 | 0.0 | -0.1 | 0.2 | 2.8 |
| Y for £X | .. | 6.3 | 2.6 | -2.8 | -1.3 | 0.2 |
| Other promotions | .. | 0.0 | -0.1 | 0.0 | 0.0 | -0.2 |
| Years | ||||||
|---|---|---|---|---|---|---|
| 2013 | 2014 | 2015 | 2016 | 2017 | 2018 | |
| Shares (%) | 100.0 | 100.0 | 100.0 | 100.0 | 100.0 | 100.0 |
| Full price | 48.8 | 47.4 | 48.9 | 48.3 | 52.8 | 54.2 |
| Temporary price reduction | 29.1 | 31.0 | 35.5 | 38.6 | 35.9 | 35.2 |
| Multibuy | 3.7 | 3.6 | 0.9 | 0.4 | 0.2 | 0.0 |
| Y for £X | 17.4 | 17.1 | 14.3 | 11.9 | 10.3 | 9.9 |
| Other promotions | 1.0 | 0.9 | 0.4 | 0.8 | 0.9 | 0.6 |
| Growth rate (%) | 2013/12 | 2014/13 | 2015/14 | 2016/15 | 2017/16 | 2018/17 |
| Purchases | .. | 1.7 | 9.6 | -7.2 | 12.8 | 7.7 |
| Full price | .. | -1.1 | 13.0 | -8.3 | 23.2 | 10.6 |
| Temporary price reduction | .. | 8.4 | 25.4 | 1.0 | 4.8 | 5.7 |
| Multibuy | .. | -1.1 | -73.0 | -62.5 | -44.9 | -72.3 |
| Y for £X | .. | -0.2 | -8.4 | -22.8 | -2.6 | 3.7 |
| Other promotions | .. | -12.9 | -44.0 | 65.2 | 30.4 | -27.1 |
| Contribution to growth (%) | .. | 1.7 | 9.6 | -7.2 | 12.8 | 7.7 |
| Full price | .. | -0.5 | 6.4 | -4.0 | 12.3 | 5.7 |
| Temporary price reduction | .. | 2.6 | 9.0 | 0.4 | 1.7 | 2.0 |
| Multibuy | .. | 0.0 | -0.6 | -0.2 | -0.1 | 0.0 |
| Y for £X | .. | 0.0 | -1.2 | -2.7 | -0.3 | 0.4 |
| Other promotions | .. | -0.1 | -0.2 | 0.5 | 0.3 | -0.2 |
| Years | ||||||
|---|---|---|---|---|---|---|
| 2013 | 2014 | 2015 | 2016 | 2017 | 2018 | |
| Shares (%) | 100.0 | 100.0 | 100.0 | 100.0 | 100.0 | 100.0 |
| Full price | 71.6 | 71.6 | 71.0 | 73.2 | 75.2 | 77.1 |
| Temporary price reduction | 15.5 | 15.4 | 18.5 | 19.0 | 18.0 | 16.4 |
| Multibuy | 0.4 | 0.6 | 0.2 | 0.3 | 0.3 | 0.3 |
| Y for £X | 12.0 | 11.9 | 10.1 | 7.3 | 6.4 | 6.0 |
| Other promotions | 0.5 | 0.5 | 0.2 | 0.2 | 0.1 | 0.1 |
| Growth rate (%) | 2013/12 | 2014/13 | 2015/14 | 2016/15 | 2017/16 | 2018/17 |
| Purchases | .. | -1.1 | 11.8 | -4.6 | 12.7 | 2.0 |
| Full price | .. | -1.1 | 10.8 | -1.6 | 15.7 | 4.6 |
| Temporary price reduction | .. | -1.5 | 33.9 | -1.7 | 6.4 | -6.6 |
| Multibuy | .. | 25.8 | -51.1 | -2.2 | 41.8 | 4.6 |
| Y for £X | .. | -1.6 | -5.0 | -30.7 | -1.5 | -4.0 |
| Other promotions | .. | -4.3 | -47.2 | -21.3 | -18.0 | -11.6 |
| Contribution to growth (%) | .. | -1.1 | 11.8 | -4.6 | 12.7 | 2.0 |
| Full price | .. | -0.8 | 7.7 | -1.2 | 11.8 | 3.5 |
| Temporary price reduction | .. | -0.2 | 6.3 | -0.3 | 1.2 | -1.1 |
| Multibuy | .. | 0.1 | -0.1 | 0.0 | 0.1 | 0.0 |
| Y for £X | .. | -0.2 | -0.5 | -2.3 | -0.1 | -0.2 |
| Other promotions | .. | 0.0 | -0.1 | 0.0 | 0.0 | 0.0 |
| Years | ||||||
|---|---|---|---|---|---|---|
| 2013 | 2014 | 2015 | 2016 | 2017 | 2018 | |
| Shares (%) | 100.0 | 100.0 | 100.0 | 100.0 | 100.0 | 100.0 |
| Full price | 57.5 | 56.4 | 56.4 | 57.7 | 61.0 | 62.8 |
| Temporary price reduction | 21.2 | 22.7 | 24.3 | 25.3 | 22.4 | 24.6 |
| Multibuy | 2.3 | 1.1 | 0.6 | 0.9 | 1.8 | 1.4 |
| Y for £X | 15.2 | 15.8 | 14.2 | 11.0 | 9.3 | 8.5 |
| Other promotions | 3.7 | 4.0 | 4.5 | 5.1 | 5.5 | 2.6 |
| Growth rate (%) | 2013/12 | 2014/13 | 2015/14 | 2016/15 | 2017/16 | 2018/17 |
| Purchases | .. | 2.8 | 11.2 | -5.3 | 11.7 | -3.2 |
| Full price | .. | 0.7 | 11.2 | -3.1 | 18.1 | -0.4 |
| Temporary price reduction | .. | 9.6 | 19.3 | -1.5 | -1.2 | 6.5 |
| Multibuy | .. | -49.2 | -44.2 | 43.6 | 135.7 | -24.5 |
| Y for £X | .. | 7.0 | 0.1 | -27.0 | -5.8 | -11.0 |
| Other promotions | .. | 10.1 | 24.1 | 8.5 | 19.0 | -53.2 |
| Contribution to growth (%) | .. | 2.8 | 11.2 | -5.3 | 11.7 | -3.2 |
| Full price | .. | 0.4 | 6.3 | -1.8 | 11.0 | -0.3 |
| Temporary price reduction | .. | 2.2 | 4.7 | -0.4 | -0.3 | 1.6 |
| Multibuy | .. | -0.6 | -0.3 | 0.4 | 2.5 | -0.4 |
| Y for £X | .. | 1.1 | 0.0 | -3.0 | -0.5 | -0.9 |
| Other promotions | .. | 0.4 | 1.1 | 0.4 | 1.0 | -1.4 |
| Years | ||||||
|---|---|---|---|---|---|---|
| 2013 | 2014 | 2015 | 2016 | 2017 | 2018 | |
| Shares (%) | 100.0 | 100.0 | 100.0 | 100.0 | 100.0 | 100.0 |
| Full price | 46.8 | 46.5 | 45.6 | 47.6 | 53.3 | 57.6 |
| Temporary price reduction | 26.0 | 25.6 | 27.2 | 30.2 | 31.4 | 30.0 |
| Multibuy | 4.4 | 2.7 | 1.9 | 0.2 | 0.1 | 0.0 |
| Y for £X | 21.4 | 23.6 | 24.1 | 20.6 | 13.8 | 11.0 |
| Other promotions | 1.3 | 1.5 | 1.1 | 1.4 | 1.4 | 1.3 |
| Growth rate (%) | 2013/12 | 2014/13 | 2015/14 | 2016/15 | 2017/16 | 2018/17 |
| Purchases | .. | -0.4 | 5.6 | -2.0 | 13.4 | 8.7 |
| Full price | .. | -1.0 | 3.5 | 2.3 | 27.0 | 17.6 |
| Temporary price reduction | .. | -1.9 | 12.3 | 8.6 | 18.1 | 3.9 |
| Multibuy | .. | -37.9 | -26.1 | -87.8 | -70.3 | -55.3 |
| Y for £X | .. | 9.9 | 7.7 | -16.3 | -23.9 | -13.5 |
| Other promotions | .. | 13.4 | -21.1 | 21.1 | 13.6 | 2.5 |
| Contribution to growth (%) | .. | -0.4 | 5.6 | -2.0 | 13.4 | 8.7 |
| Full price | .. | -0.5 | 1.6 | 1.1 | 14.4 | 10.1 |
| Temporary price reduction | .. | -0.5 | 3.4 | 2.6 | 5.7 | 1.2 |
| Multibuy | .. | -1.0 | -0.5 | -0.2 | 0.0 | 0.0 |
| Y for £X | .. | 2.3 | 1.9 | -3.4 | -3.3 | -1.5 |
| Other promotions | .. | 0.2 | -0.2 | 0.3 | 0.2 | 0.0 |
| Years | ||||||
|---|---|---|---|---|---|---|
| 2013 | 2014 | 2015 | 2016 | 2017 | 2018 | |
| Shares (%) | 100.0 | 100.0 | 100.0 | 100.0 | 100.0 | 100.0 |
| Full price | 52.3 | 54.7 | 52.3 | 53.6 | 53.5 | 52.6 |
| Temporary price reduction | 33.2 | 29.9 | 33.0 | 36.0 | 35.4 | 33.8 |
| Multibuy | 0.1 | 0.4 | 0.1 | 0.1 | 0.0 | 0.1 |
| Y for £X | 13.6 | 14.2 | 12.7 | 8.4 | 9.5 | 12.3 |
| Other promotions | 0.8 | 0.8 | 1.9 | 1.9 | 1.5 | 1.2 |
| Growth rate (%) | 2013/12 | 2014/13 | 2015/14 | 2016/15 | 2017/16 | 2018/17 |
| Purchases | .. | 5.4 | 7.4 | -3.3 | 14.2 | 8.0 |
| Full price | .. | 10.3 | 2.7 | -1.1 | 14.2 | 6.2 |
| Temporary price reduction | .. | -5.1 | 18.4 | 5.5 | 12.5 | 3.1 |
| Multibuy | .. | 703.8 | -83.2 | 98.1 | -74.1 | 89.7 |
| Y for £X | .. | 9.4 | -3.4 | -35.9 | 29.2 | 38.5 |
| Other promotions | .. | 8.0 | 155.6 | -3.8 | -11.9 | -9.8 |
| Contribution to growth (%) | .. | 5.4 | 7.4 | -3.3 | 14.2 | 8.0 |
| Full price | .. | 5.6 | 1.4 | -0.6 | 7.6 | 3.3 |
| Temporary price reduction | .. | -1.5 | 6.1 | 2.0 | 4.4 | 1.0 |
| Multibuy | .. | 2.9 | -0.1 | 0.1 | 0.0 | 0.0 |
| Y for £X | .. | 1.3 | -0.4 | -3.0 | 2.8 | 4.7 |
| Other promotions | .. | 0.1 | 2.9 | -0.1 | -0.2 | -0.1 |
4.2 Inter-category model
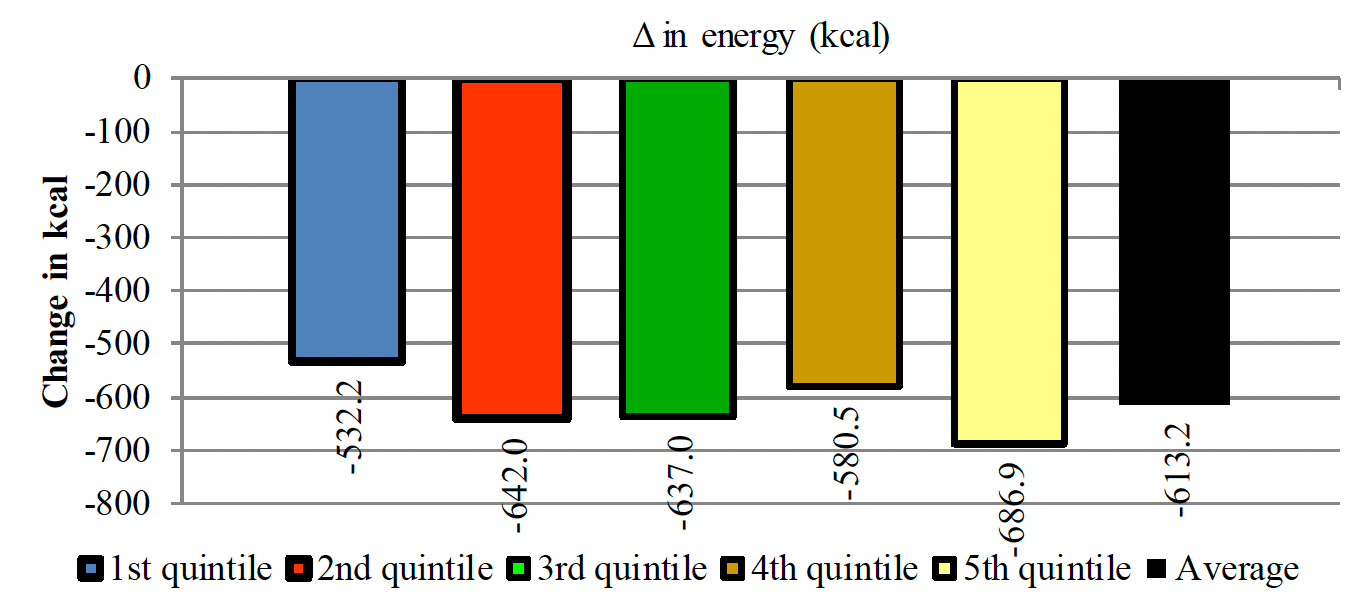
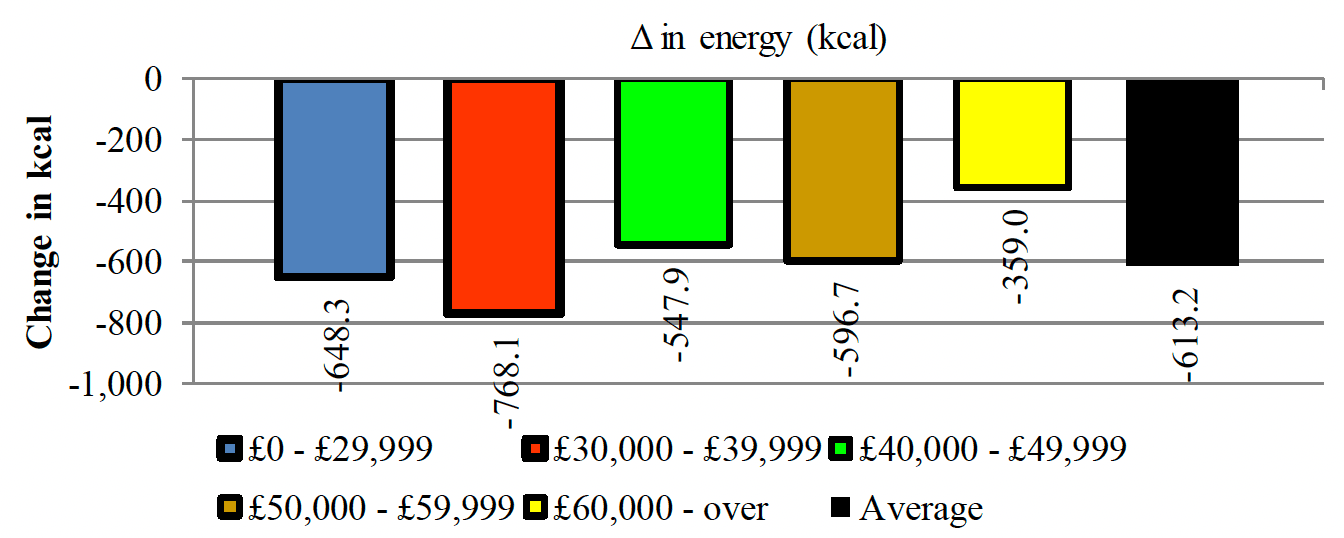
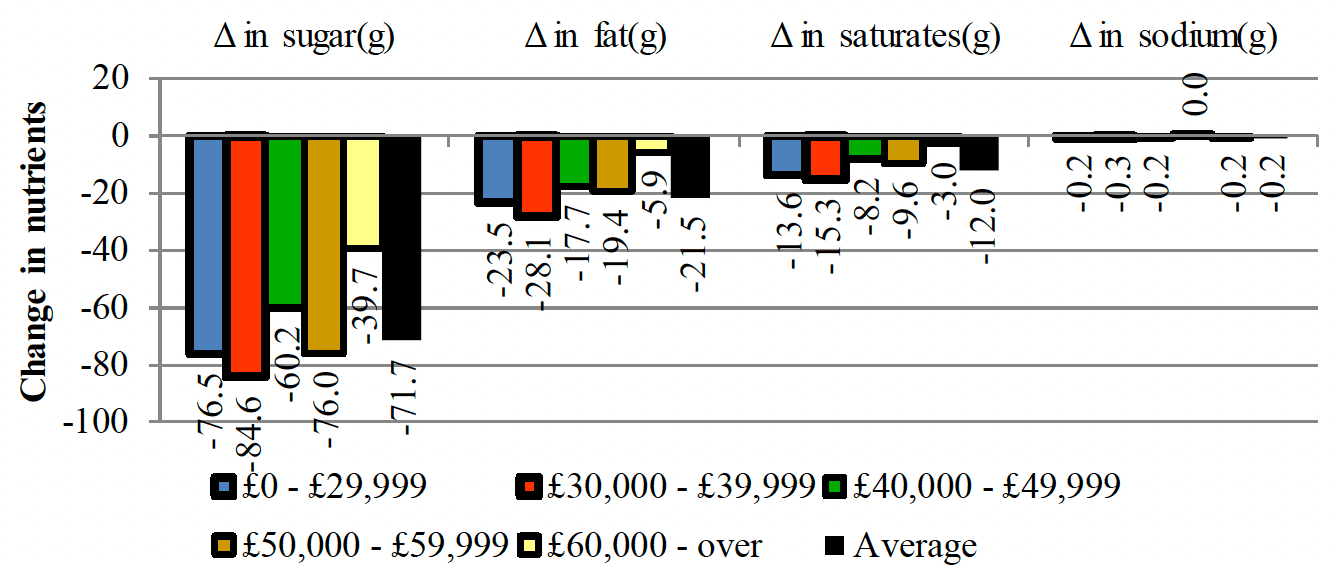
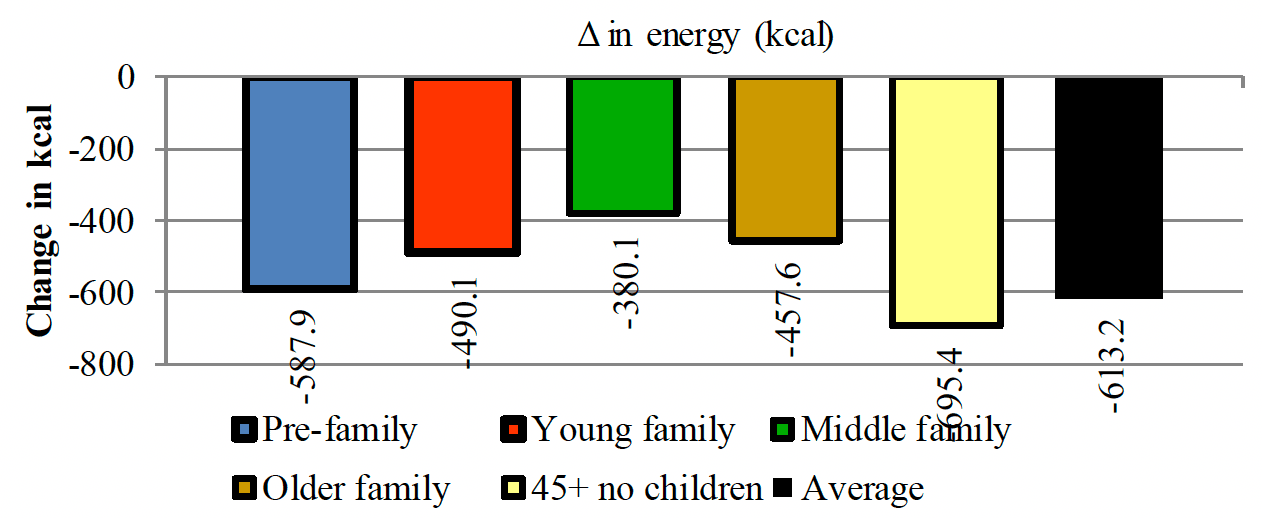
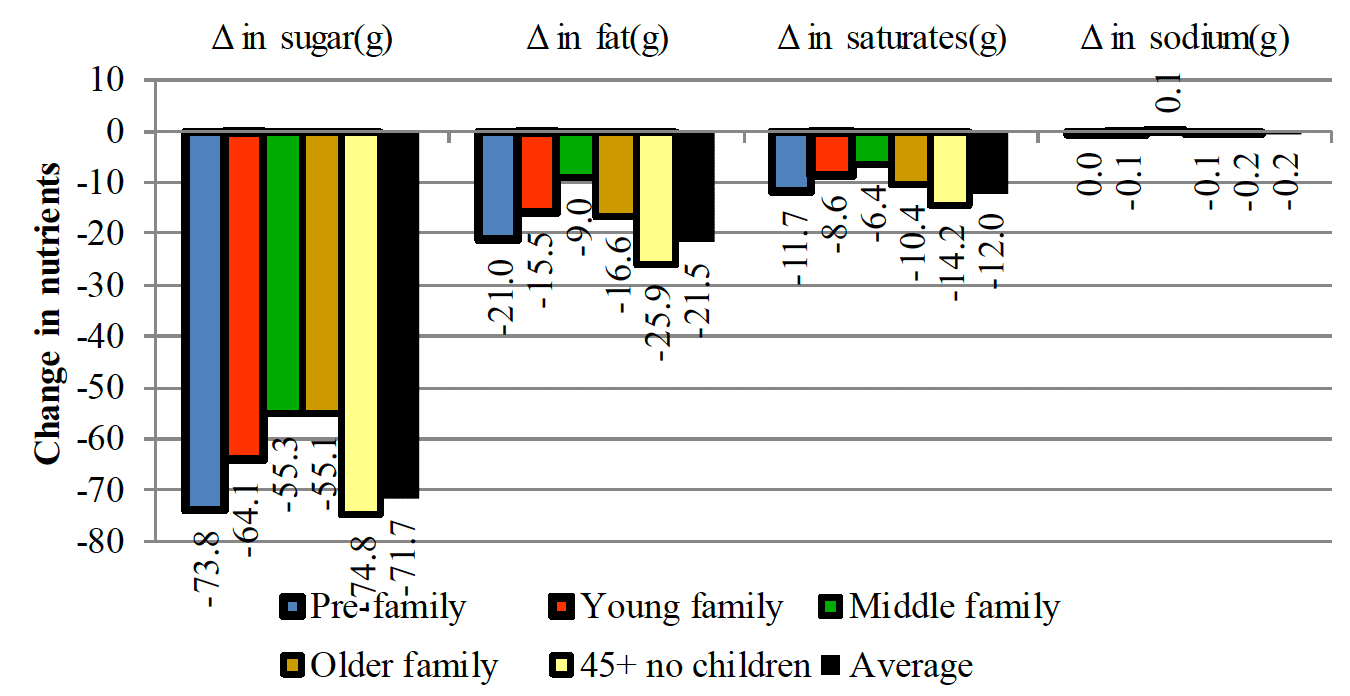
4.6 Table 15 presents the net change (i.e., the sum of changes in discretionary and non-discretionary foods) in energy, sugar, fat, saturates and sodium estimated to arise following a restriction of the promotion of value on discretionary foods. The results indicate a reduction in energy of 613 kcal per capita per week (i.e., 87.6 kcal per capita per day or 4.4 per cent of a daily diet of 2000 kcal).
4.7 As shown in Table 15 all the discretionary categories show similar results in terms of direction of change relating to energy and nutrients. The reduction in nutrients is partially compensated by the increase in quantities in non-discretionary food and drinks (i.e., other food and drinks) but not enough to offset the reductions achieved from the discretionary products. This indicates that the impact overall is positive in terms of the purchase/consumption of discretionary foods considered to be high in fat, sugar and salt.
| Group | Category | |||||||||
|---|---|---|---|---|---|---|---|---|---|---|
| Discretionary foods | Other foods and drinks | Total | ||||||||
| Take home confectionery | Biscuits | Take home savouries | Cakes pastries and sugar morning goods | Total puddings and desserts | Take home sugary drinks | Edible ices and ice cream | Total | |||
| All the sample | ||||||||||
| △ in share | -0.009 | -0.006 | -0.005 | -0.005 | -0.003 | -0.007 | -0.004 | -0.039 | 0.035 | -0.003 |
| △ in expenditure (£) | -0.254 | -0.177 | -0.131 | -0.125 | -0.083 | -0.192 | -0.102 | -1.064 | 0.973 | -0.091 |
| △ in quantity (Kg) | -0.080 | -0.030 | -0.017 | -0.090 | -0.015 | -0.167 | -0.029 | -0.428 | 0.193 | -0.235 |
| △ in energy (kcal) | -372.856 | -141.201 | -85.031 | -168.164 | -32.316 | -49.292 | -62.224 | -911.083 | 297.841 | -613.242 |
| △ in protein(g) | -4.004 | -1.955 | -1.277 | -4.107 | -0.487 | -0.207 | -0.791 | -12.828 | 8.270 | -4.558 |
| △ in carbohydrate(g) | -51.578 | -19.395 | -8.744 | -26.444 | -4.373 | -11.578 | -7.388 | -129.501 | 19.881 | -109.620 |
| △ in sugar(g) | -42.533 | -9.082 | -0.722 | -8.816 | -3.102 | -10.941 | -6.204 | -81.399 | 9.745 | -71.654 |
| △ in fat(g) | -16.886 | -5.985 | -4.856 | -5.382 | -1.399 | -0.068 | -3.230 | -37.806 | 16.309 | -21.497 |
| △ in saturates(g) | -9.879 | -2.998 | -0.555 | -2.073 | -0.816 | -0.030 | -2.205 | -18.555 | 6.548 | -12.007 |
| △ in fibre(g) | -1.278 | -1.099 | -0.700 | -1.542 | -0.139 | -0.111 | -0.169 | -5.038 | 2.616 | -2.422 |
| △ in sodium(g) | -0.080 | -0.080 | -0.100 | -0.146 | -0.014 | -0.015 | -0.017 | -0.452 | 0.296 | -0.157 |
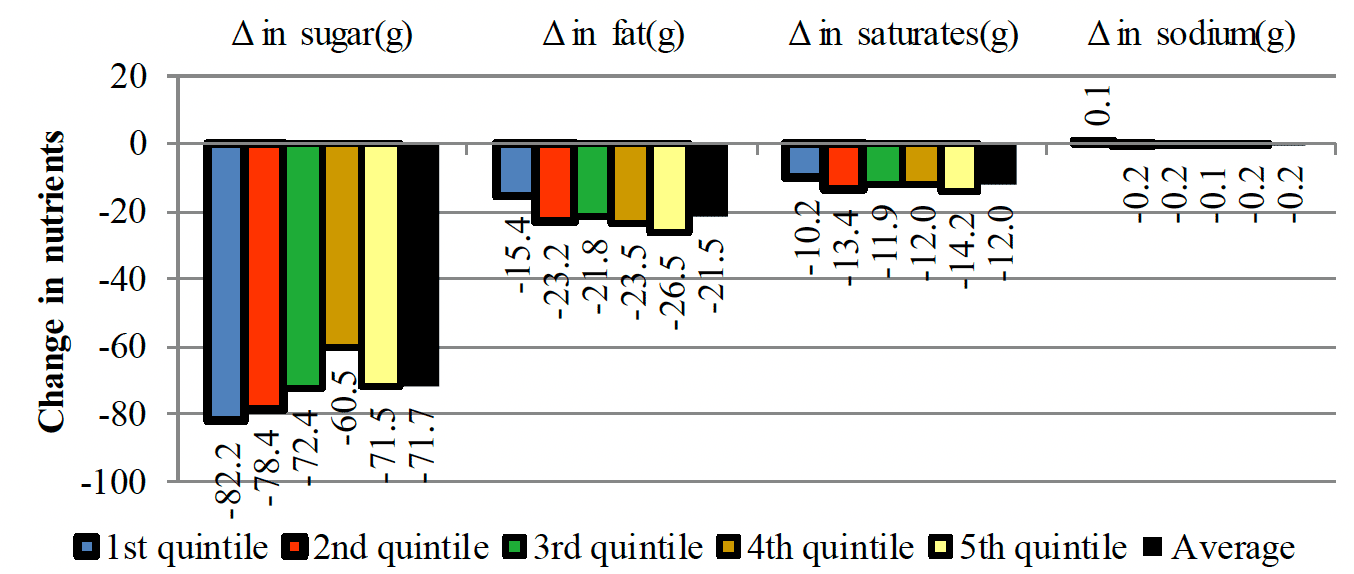
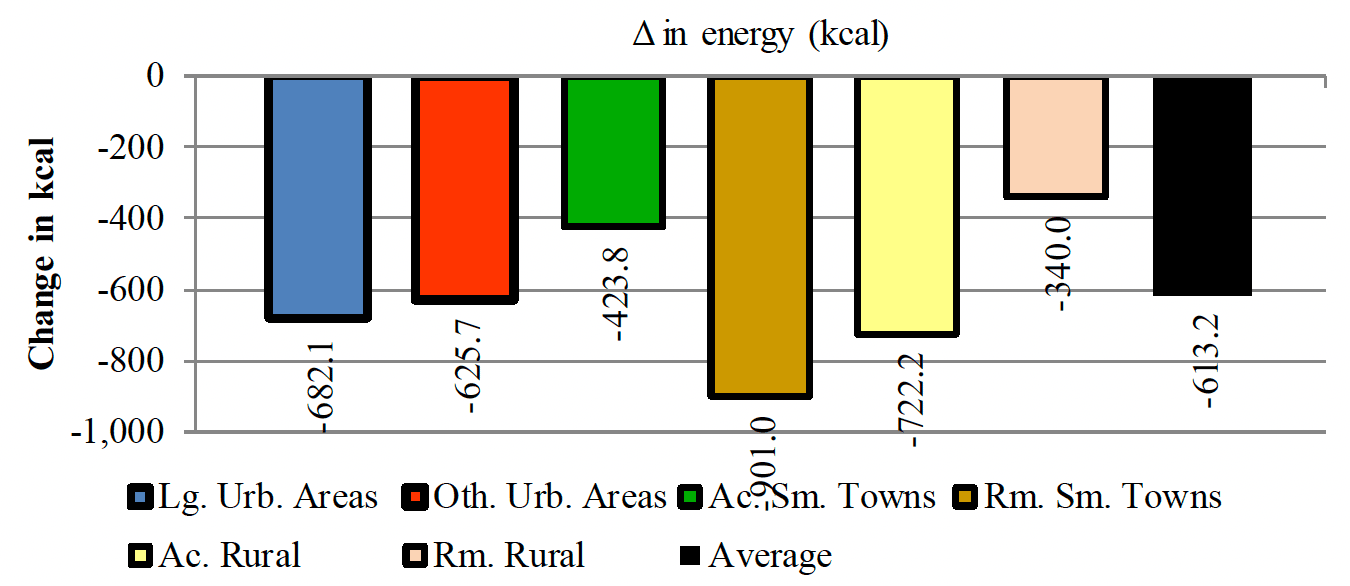
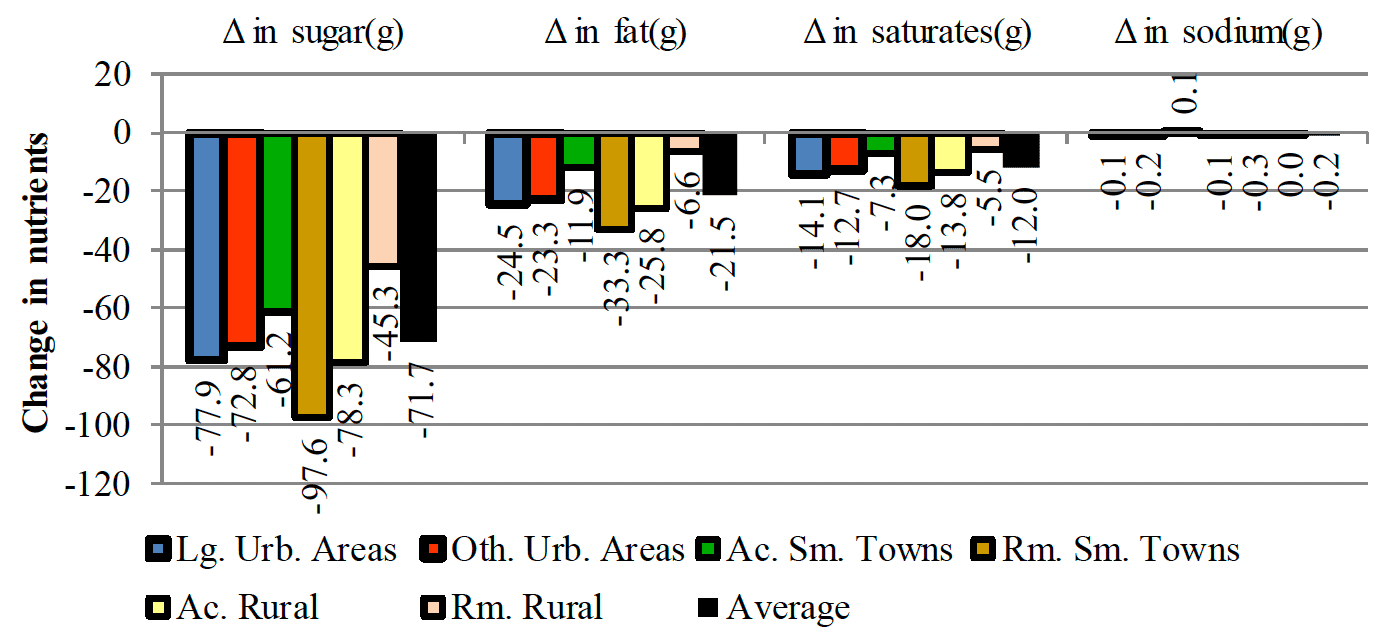
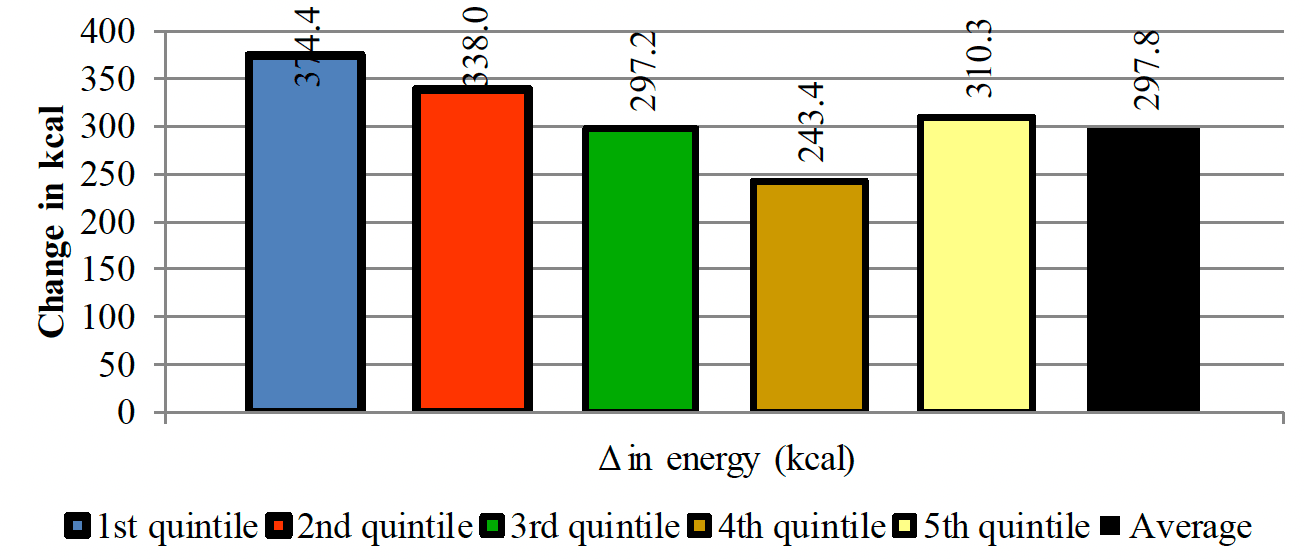
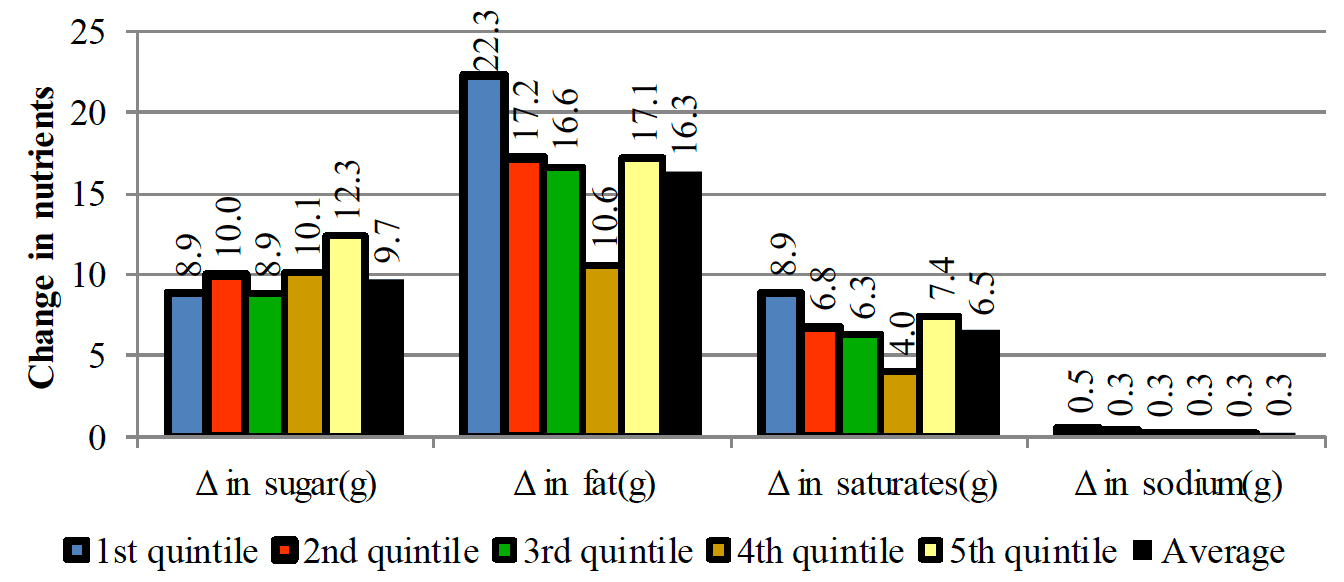
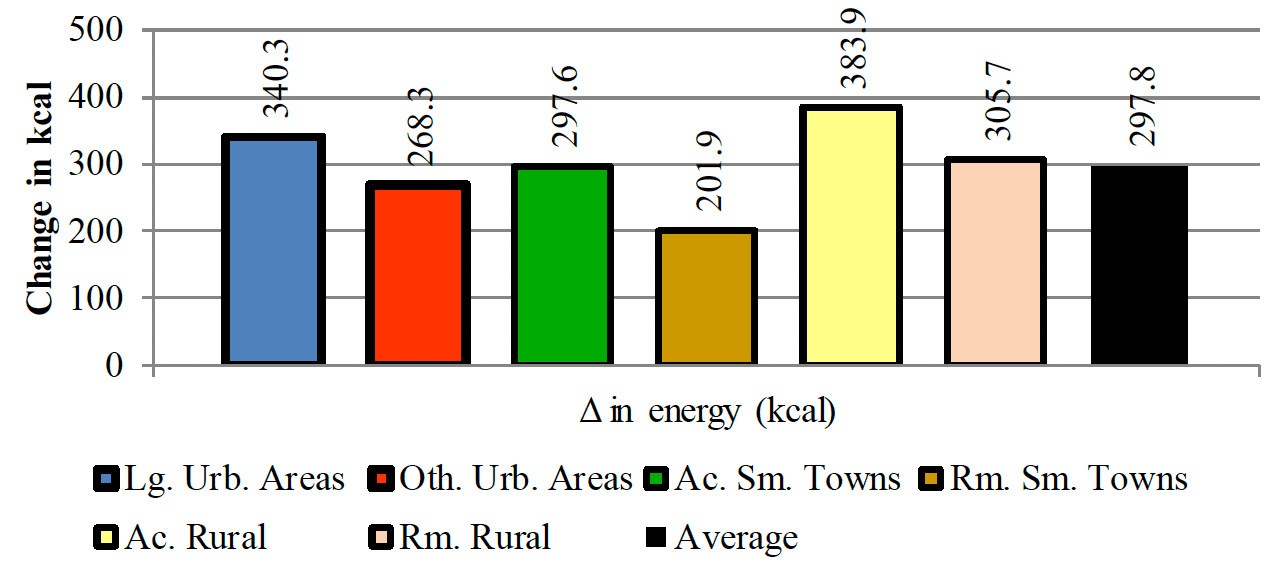
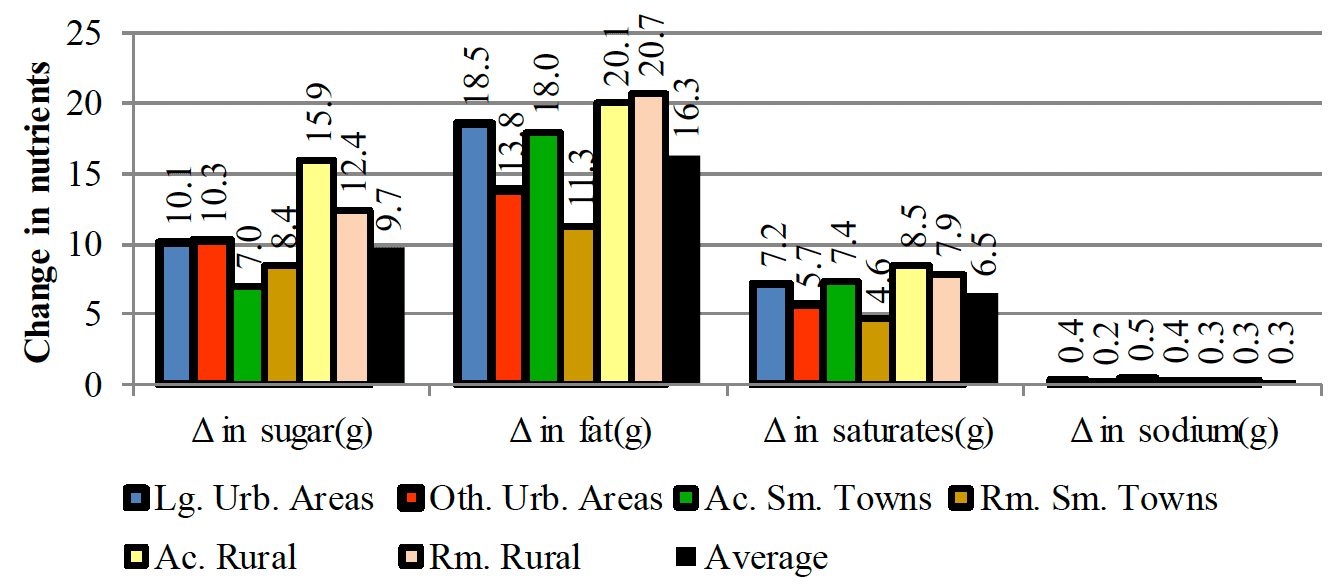
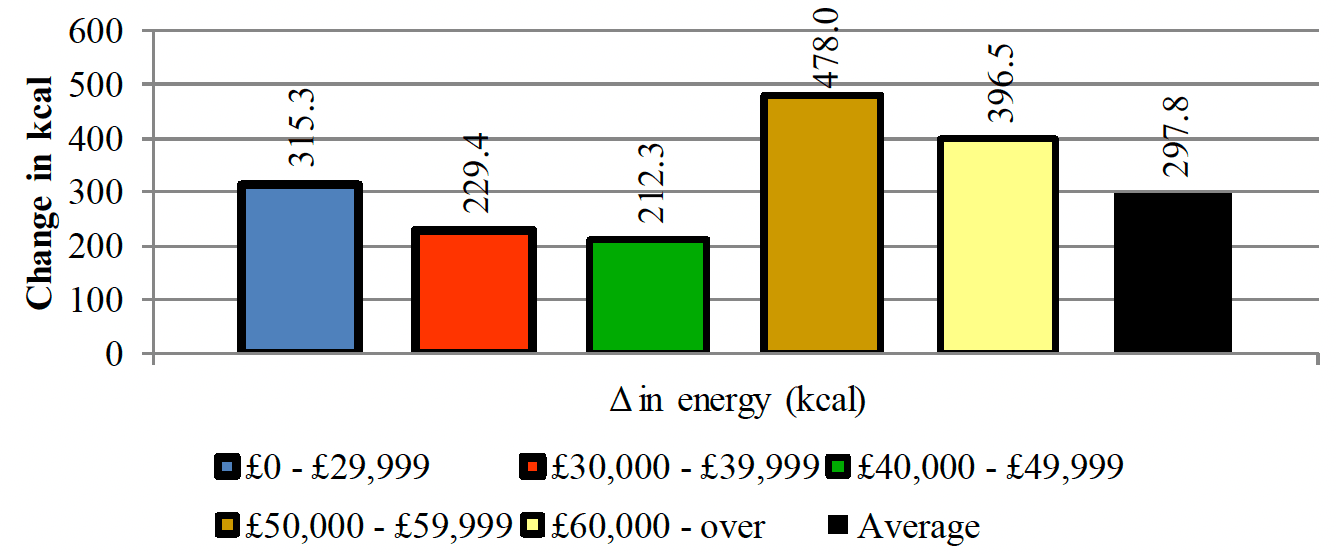
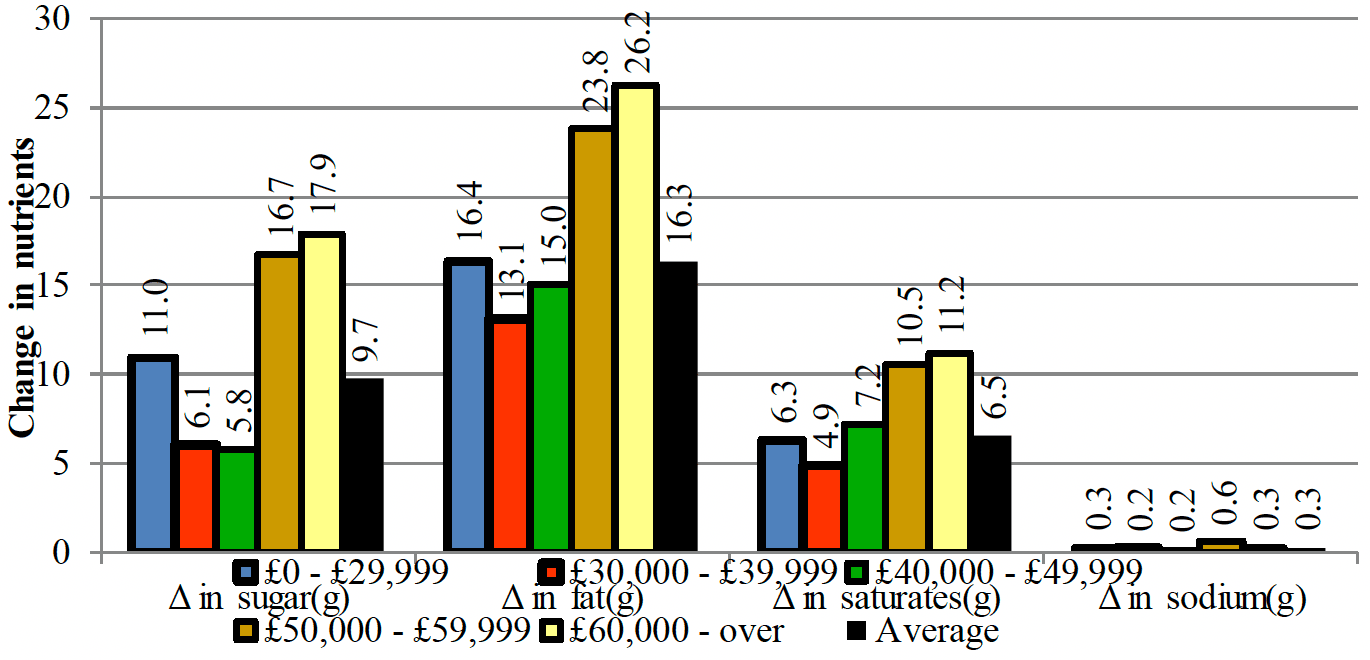
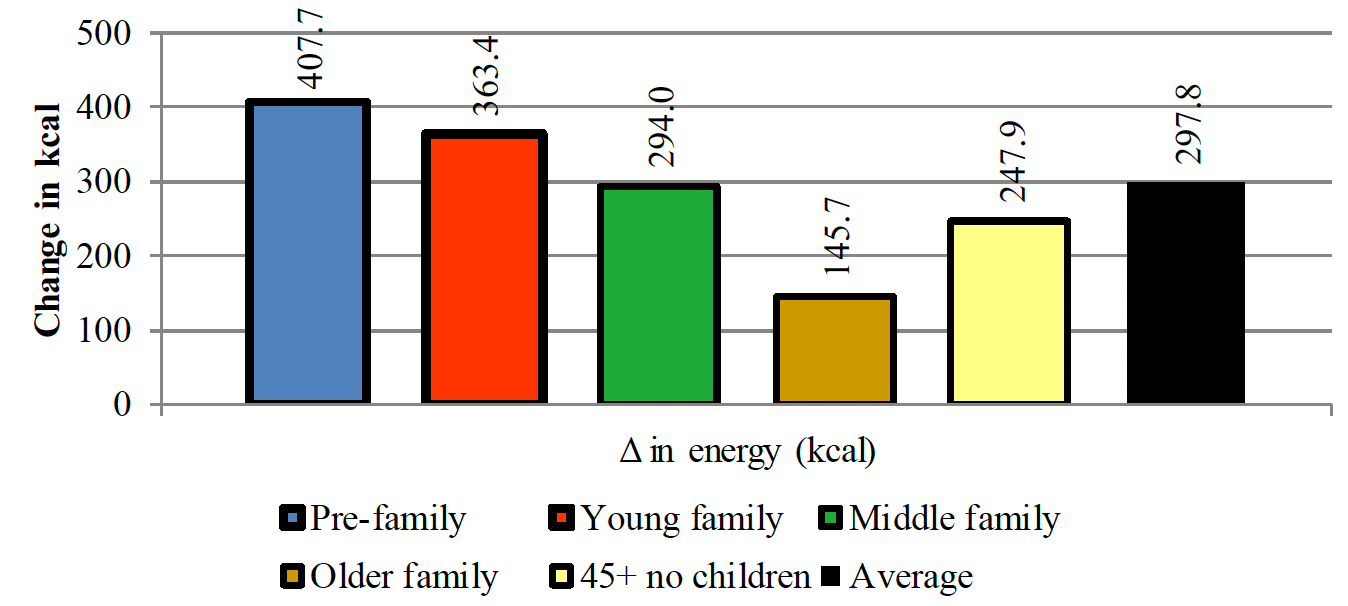
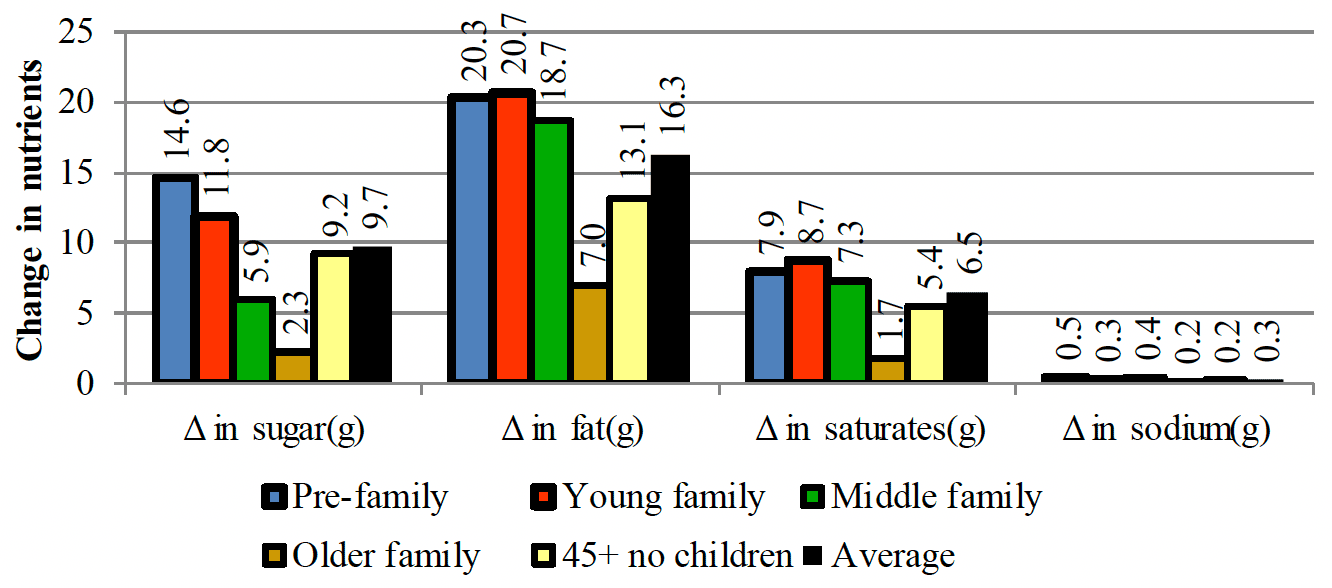
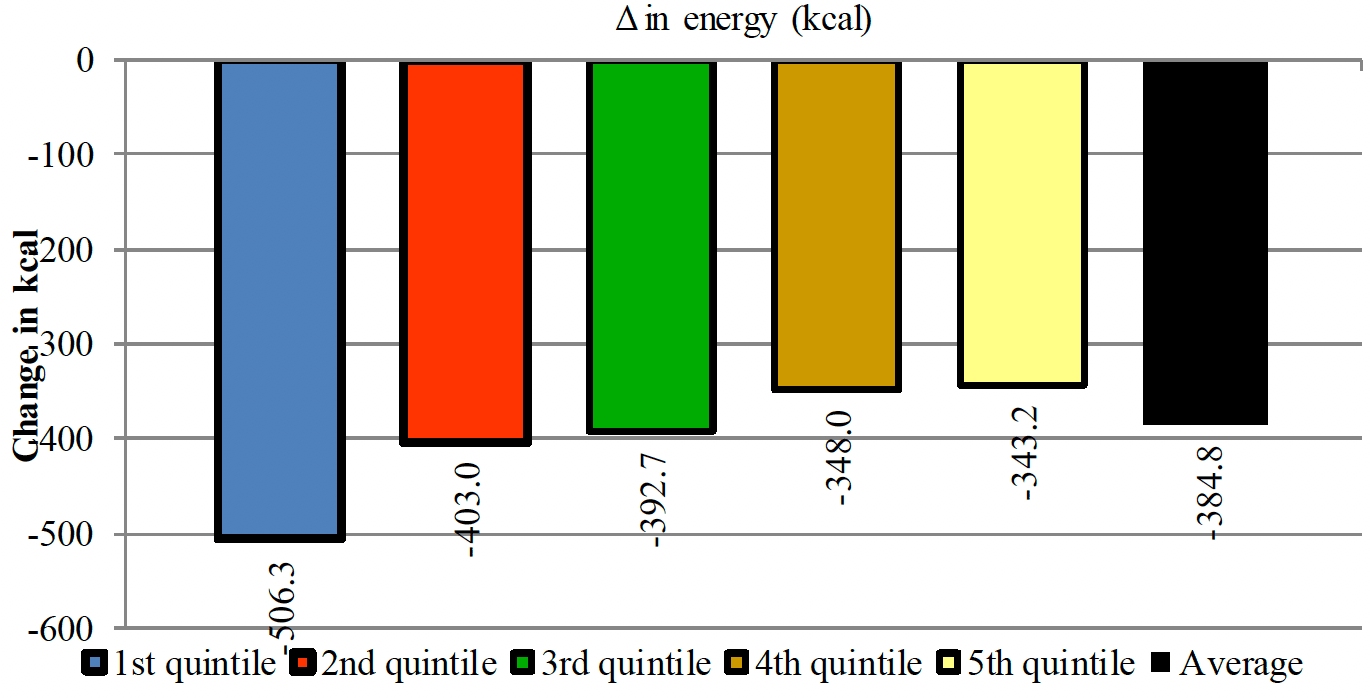
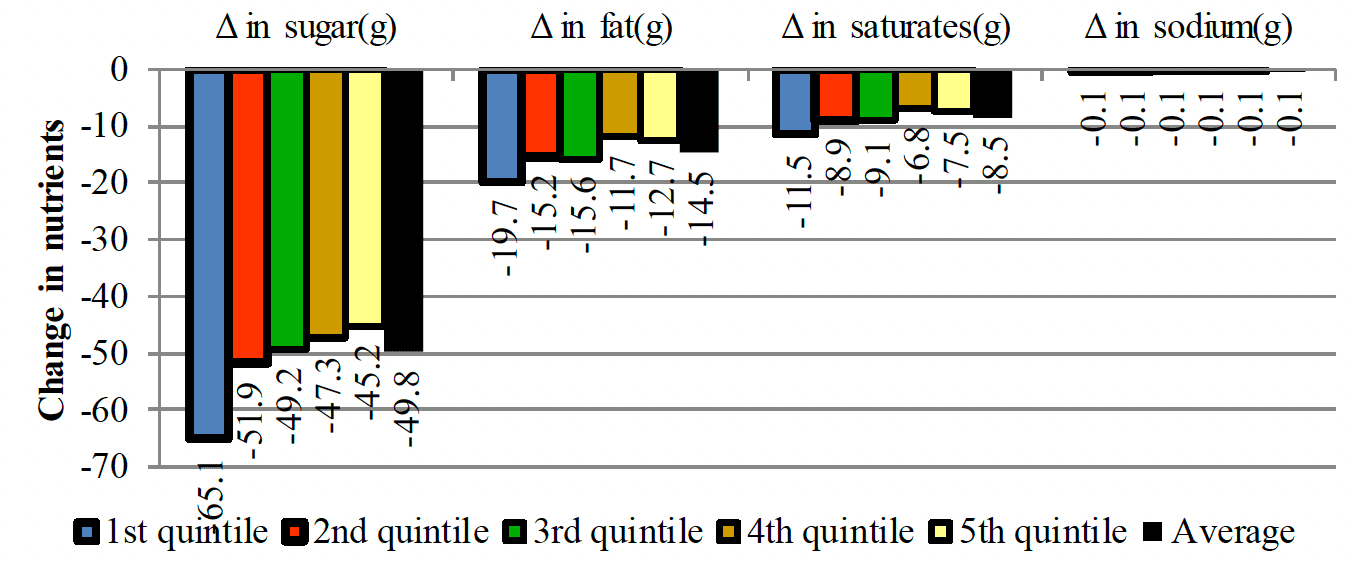
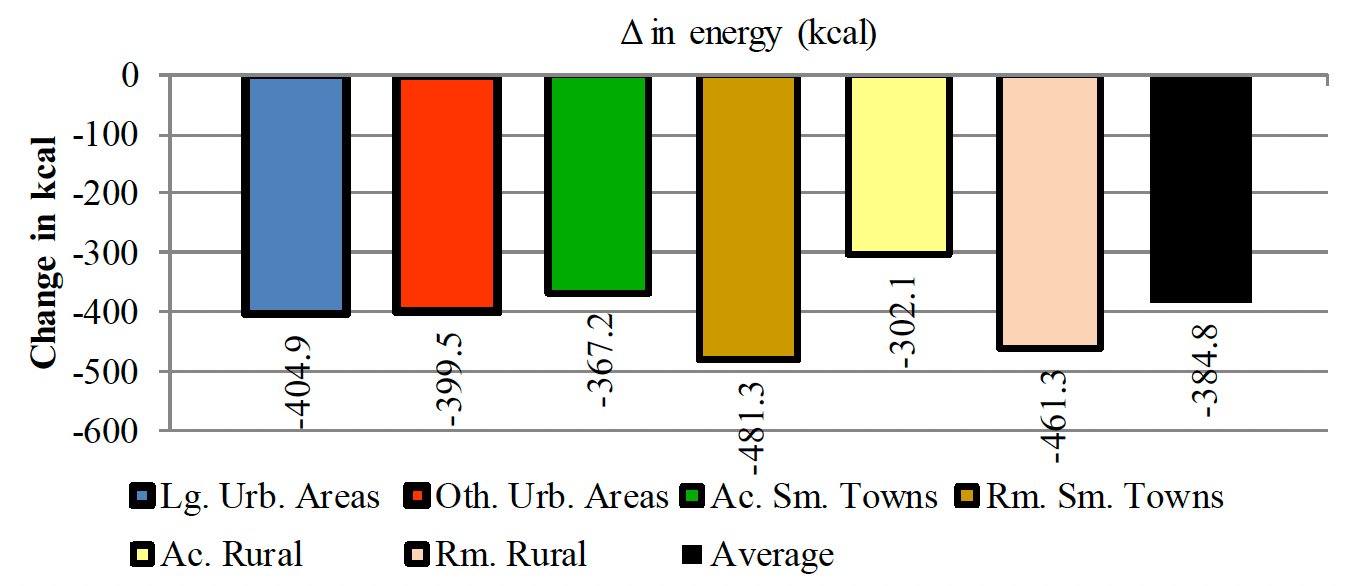
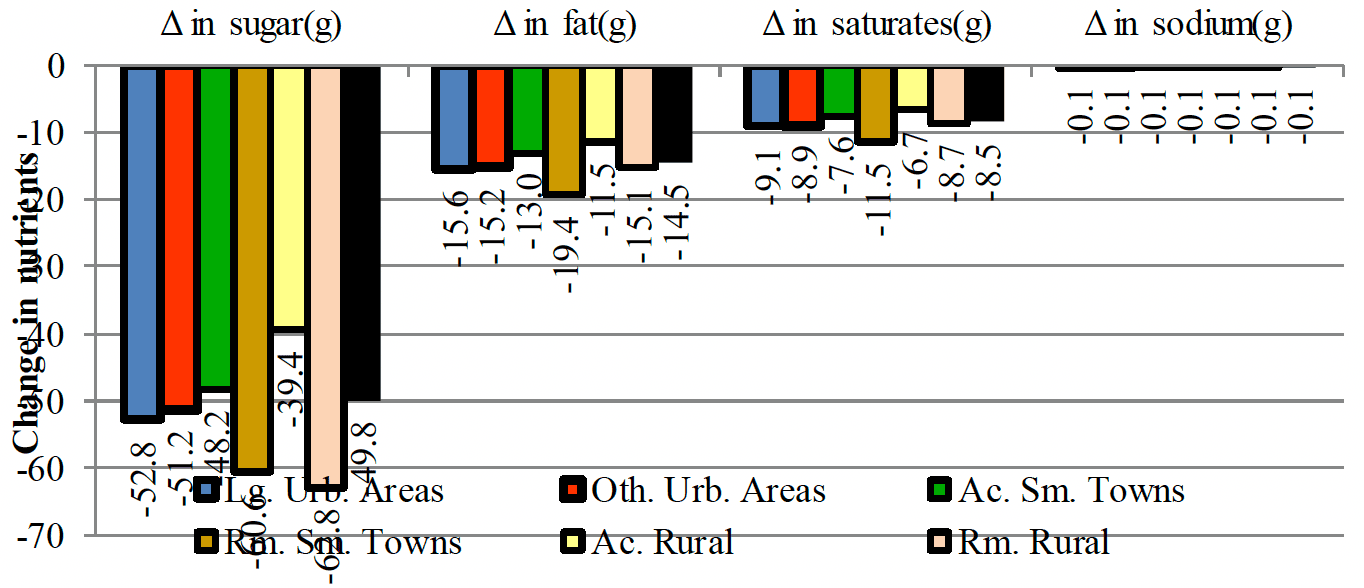
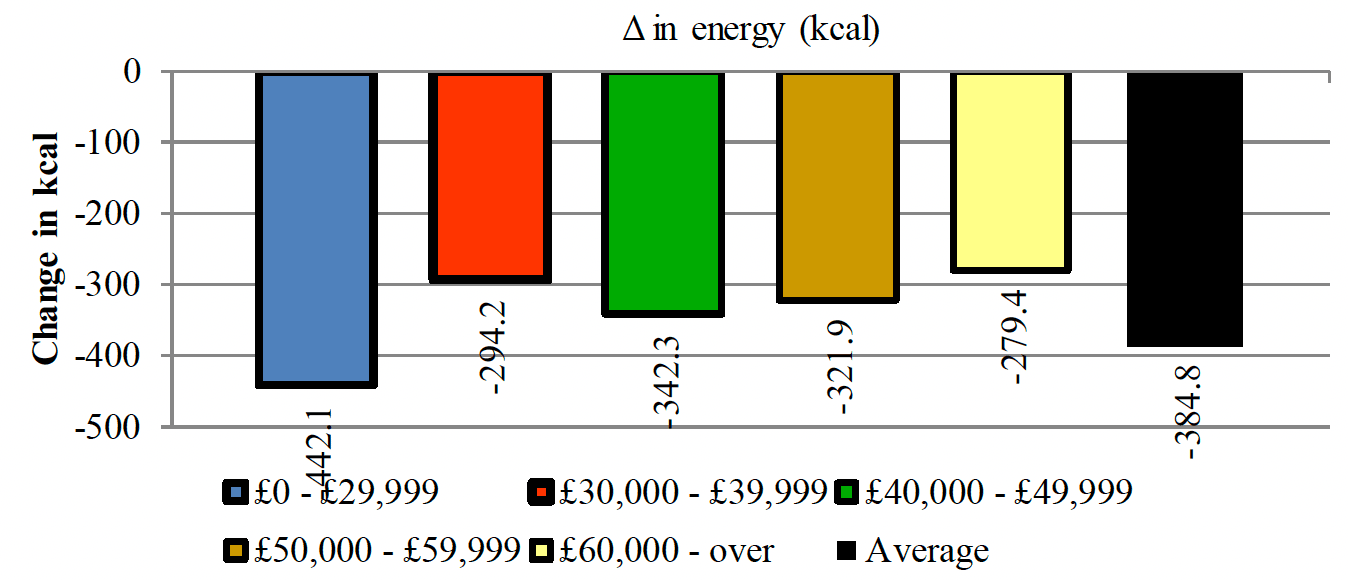
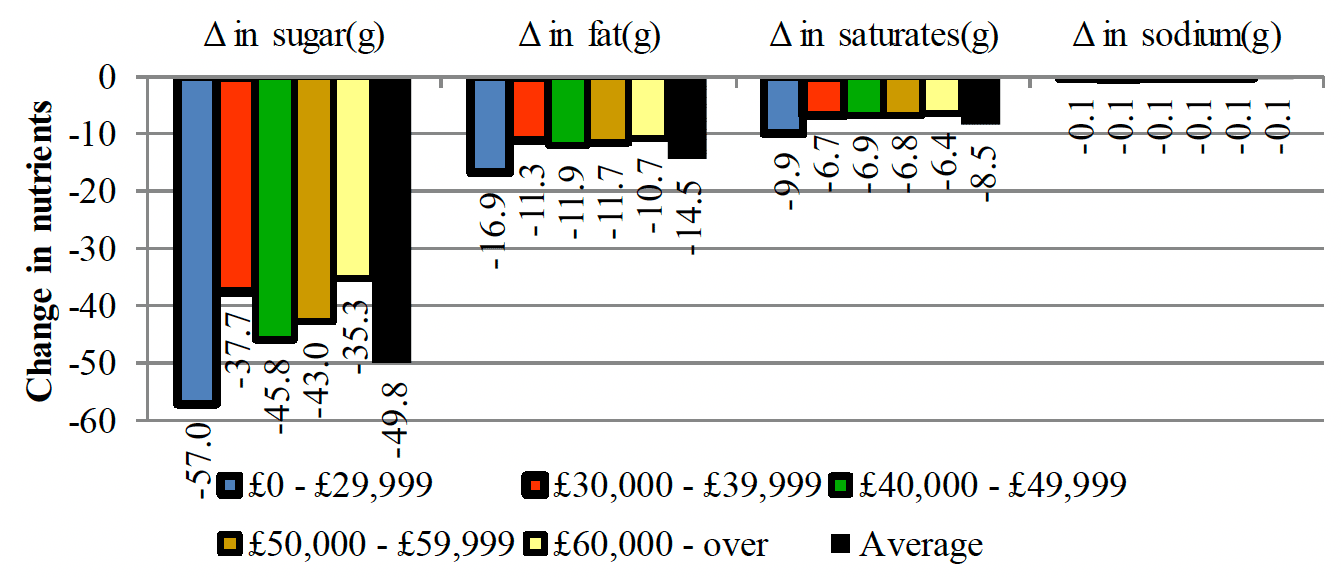
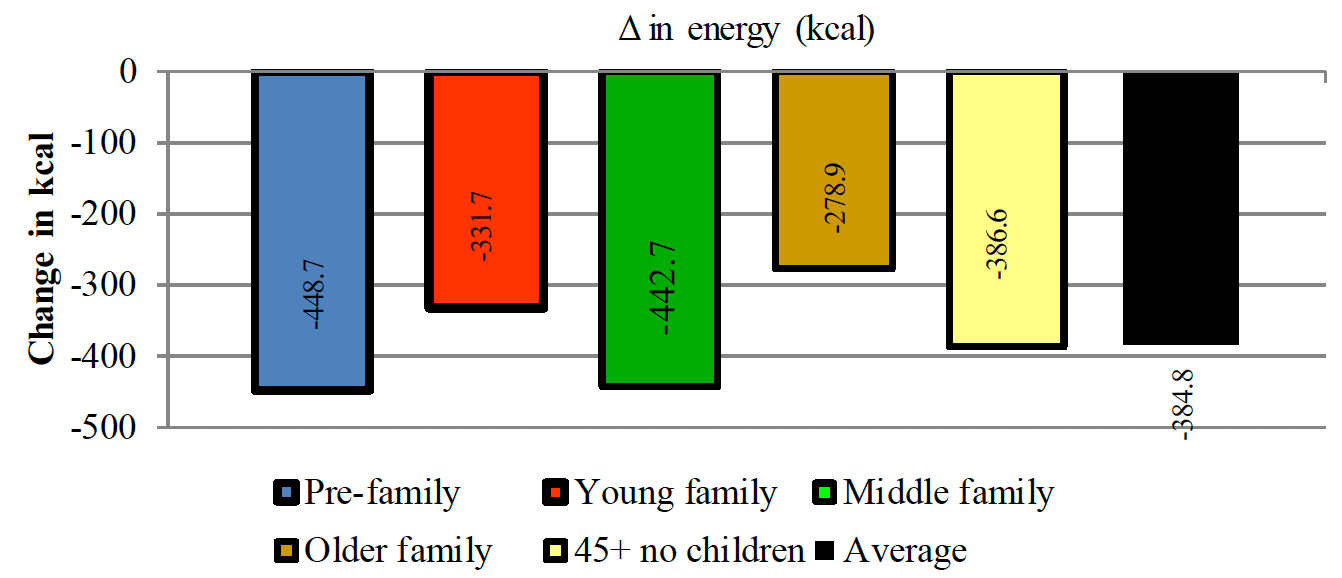
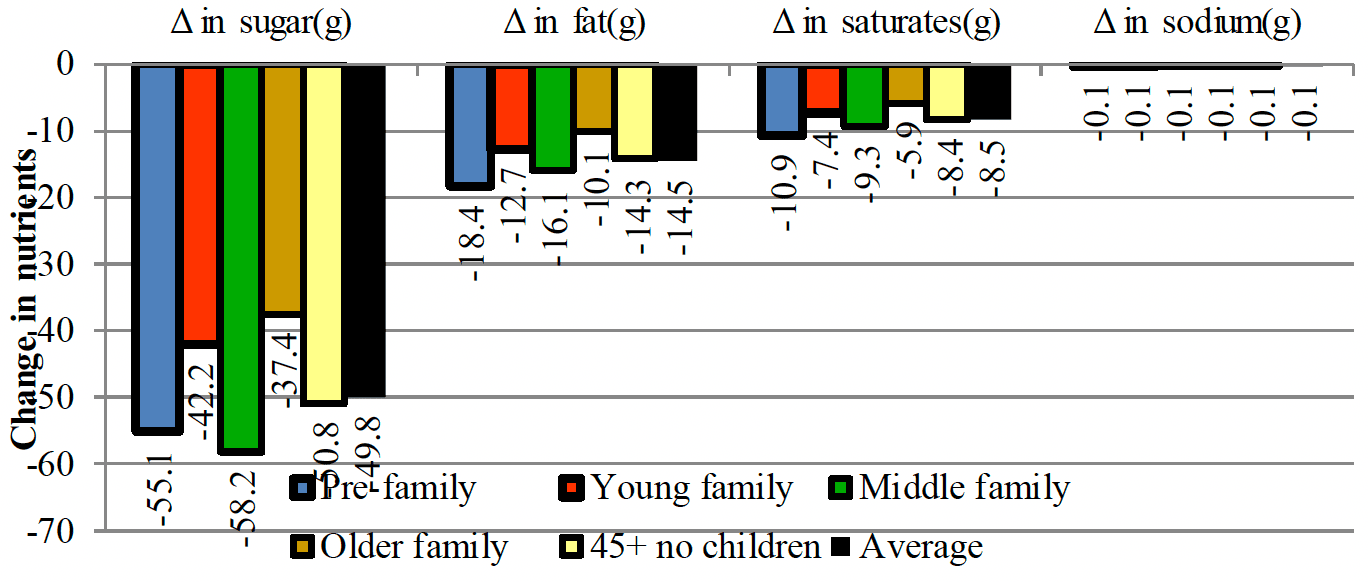
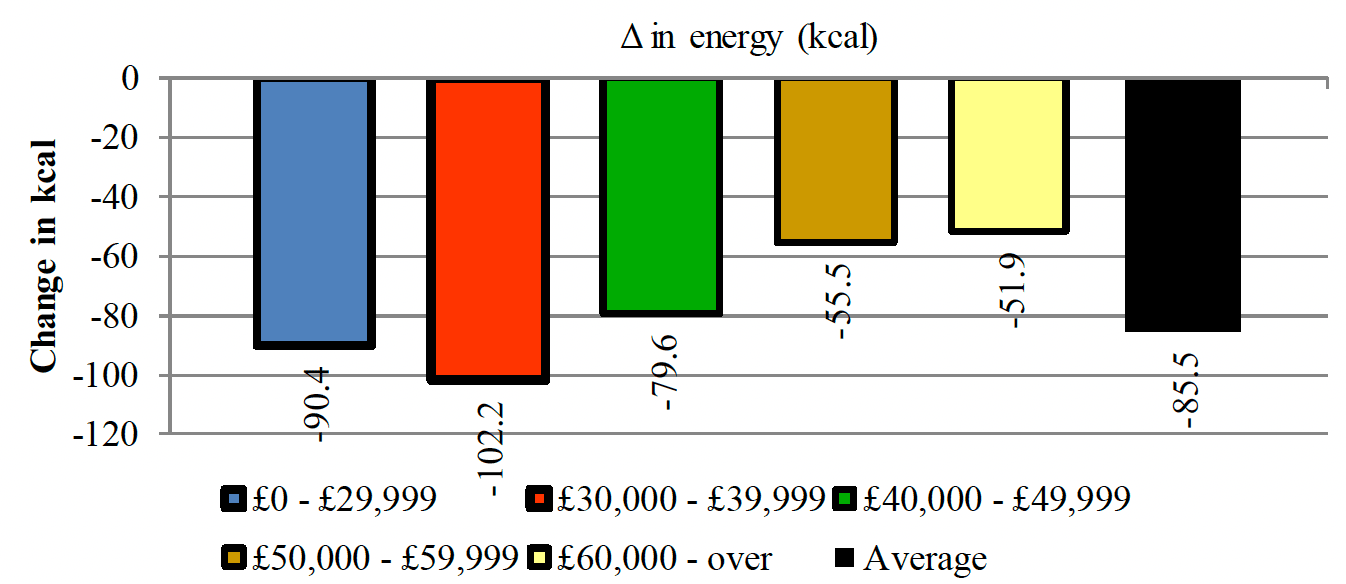
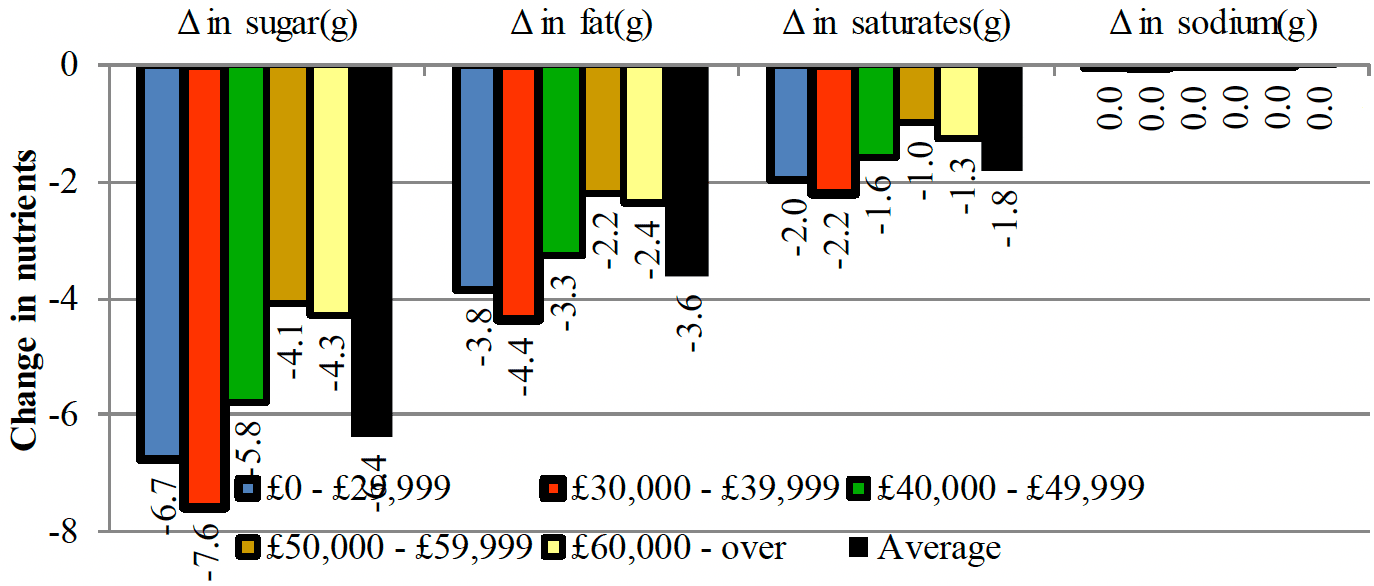
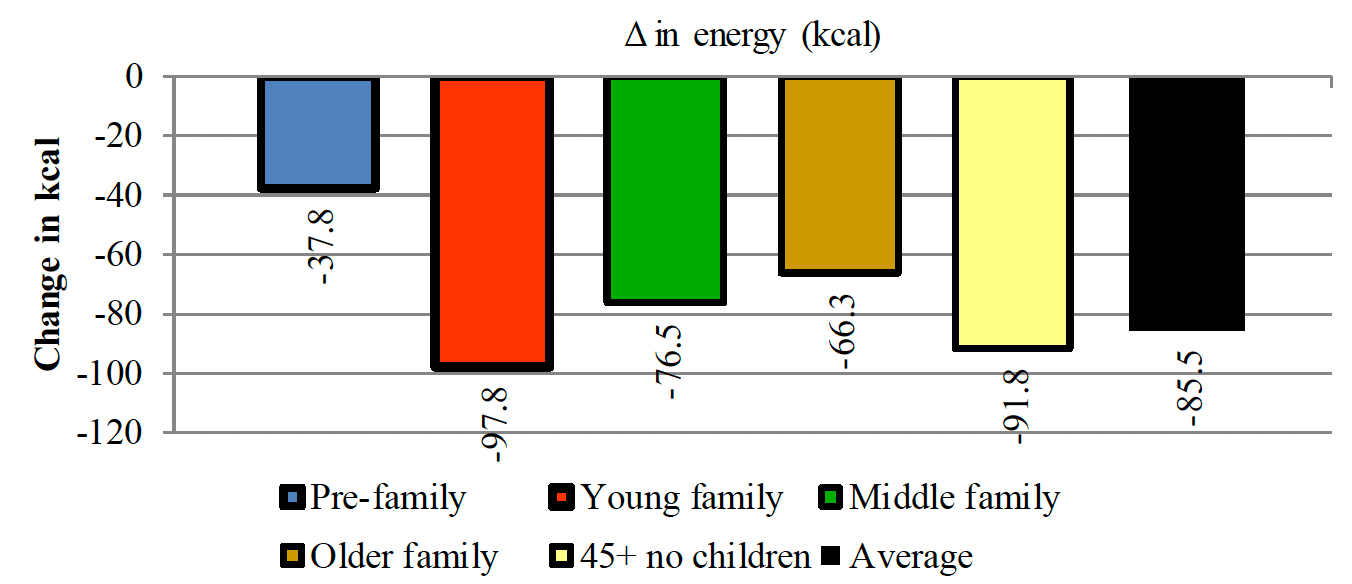
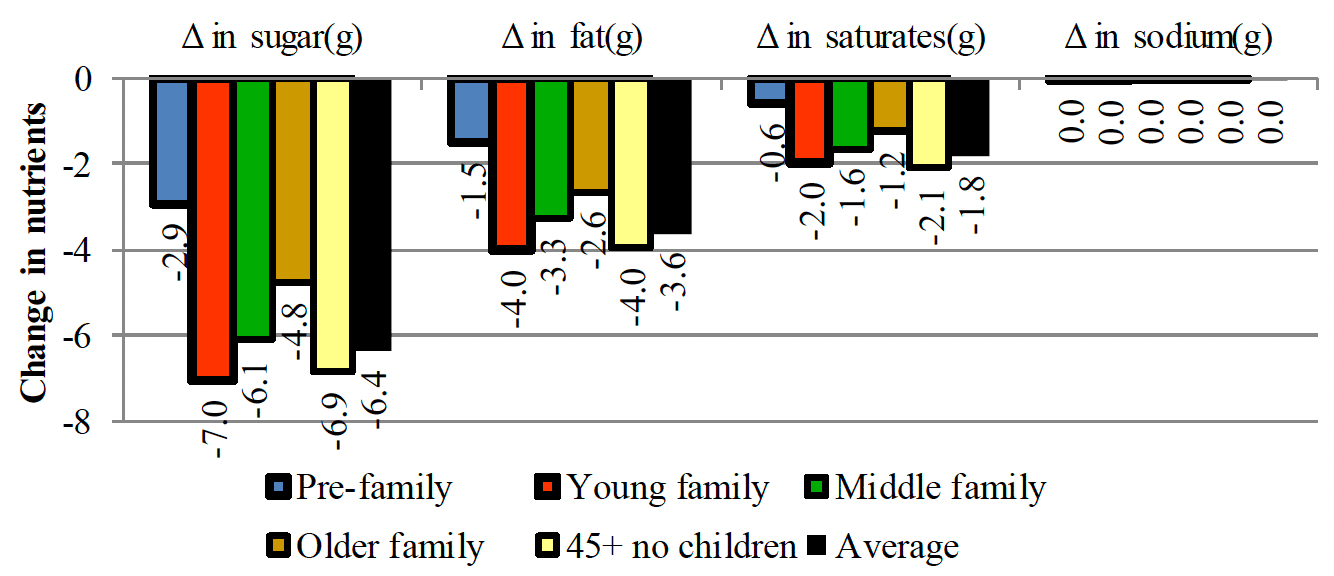
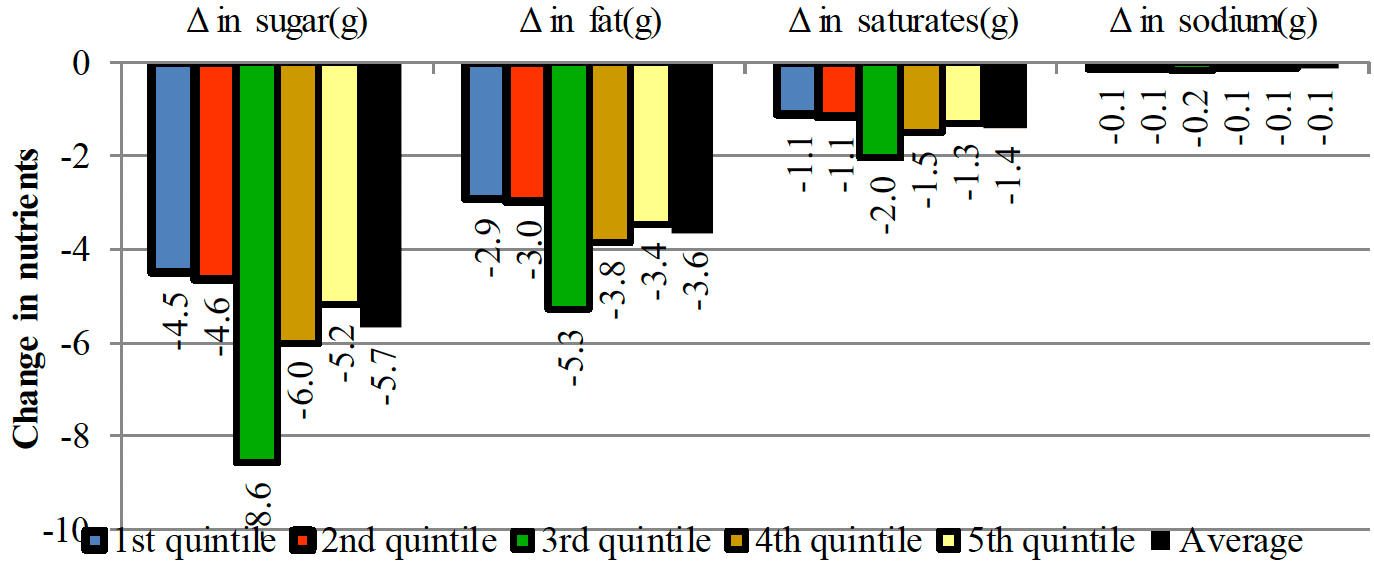
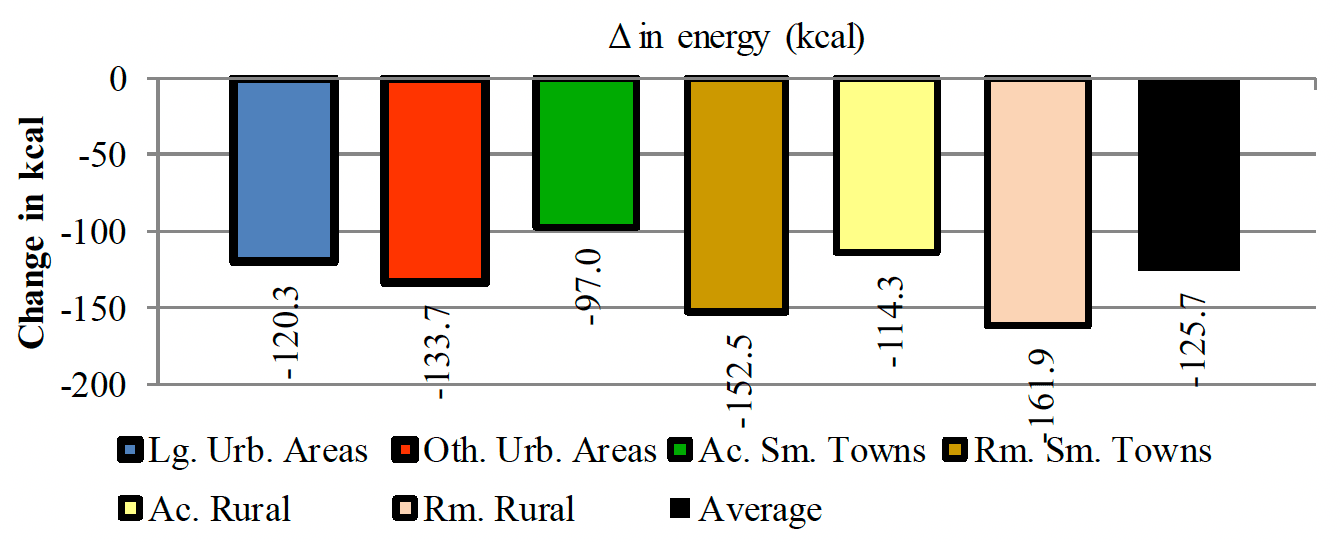
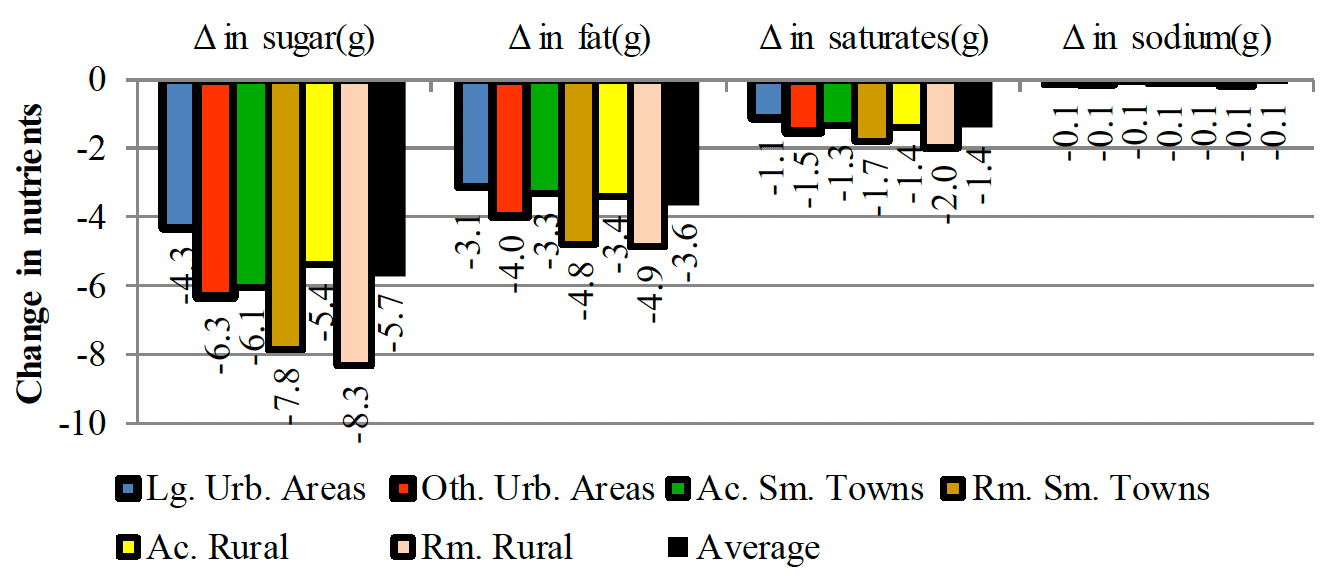
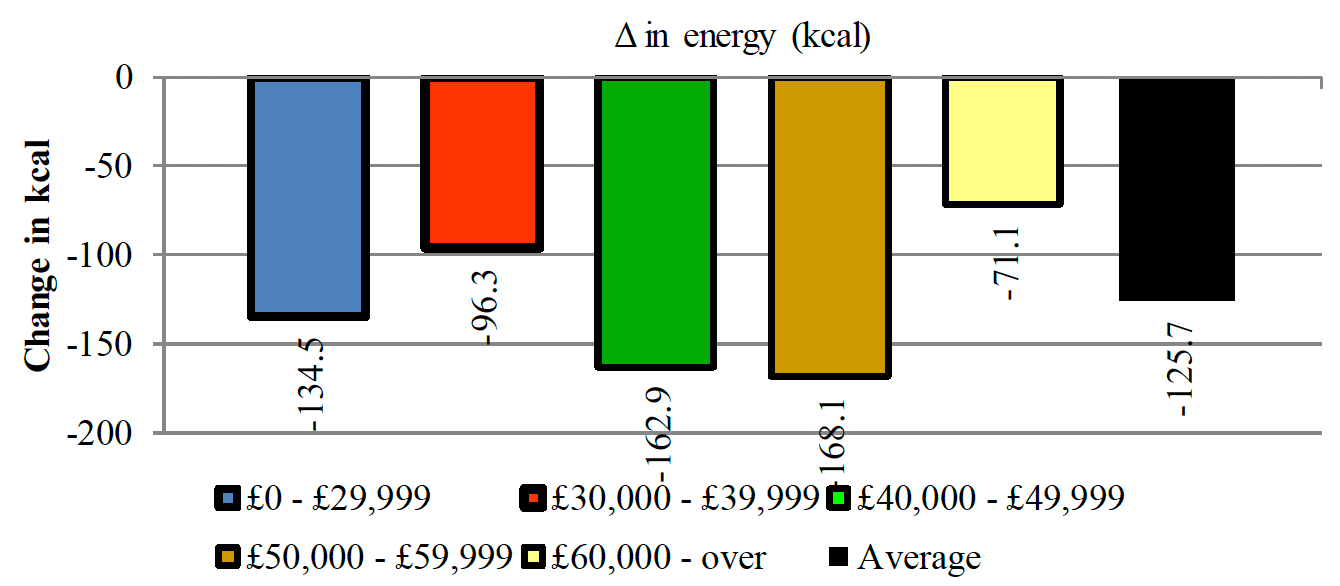
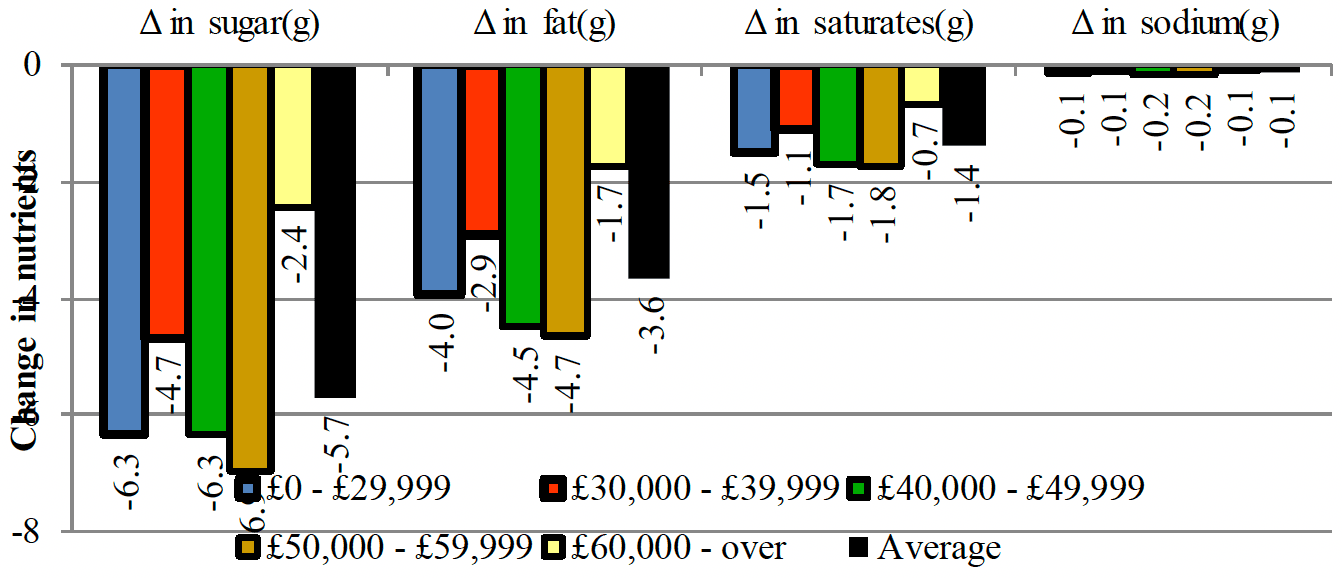
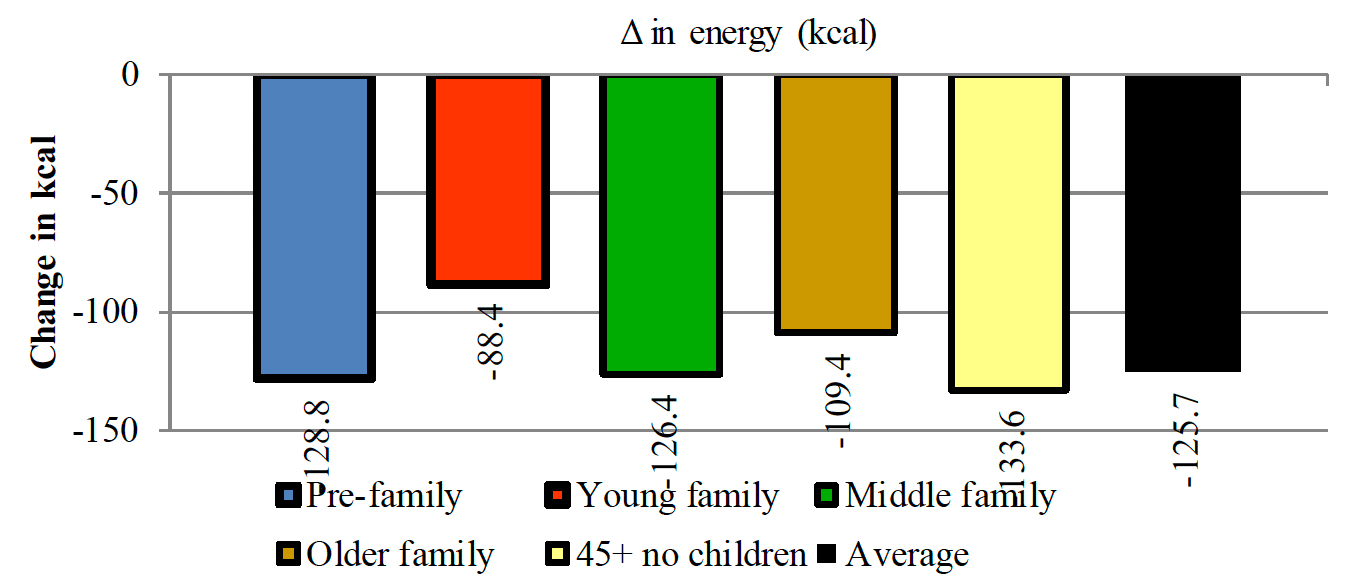
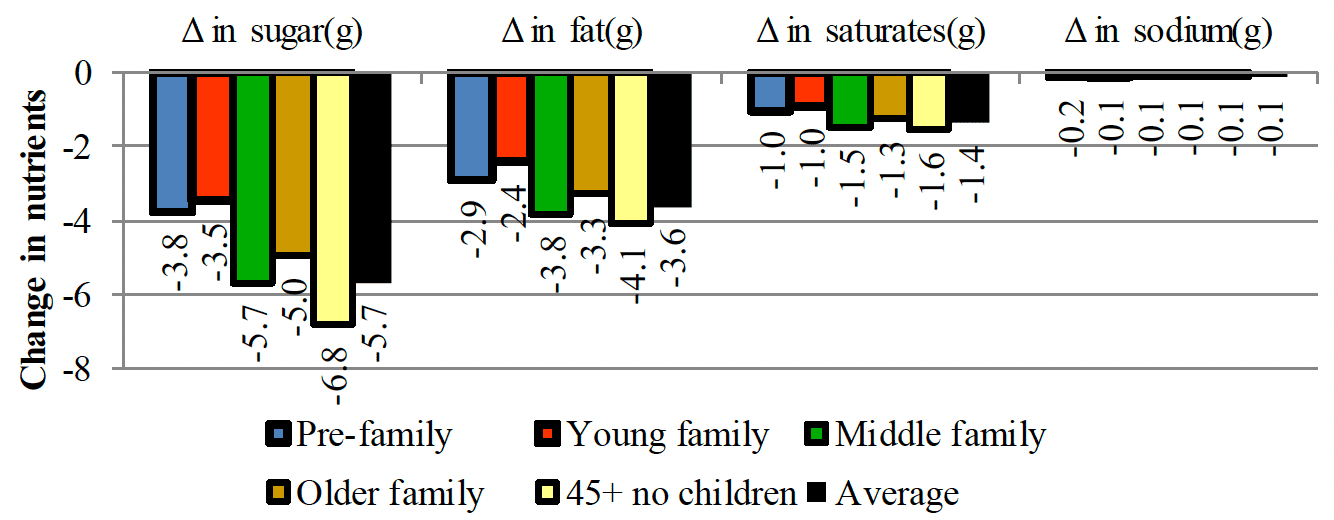
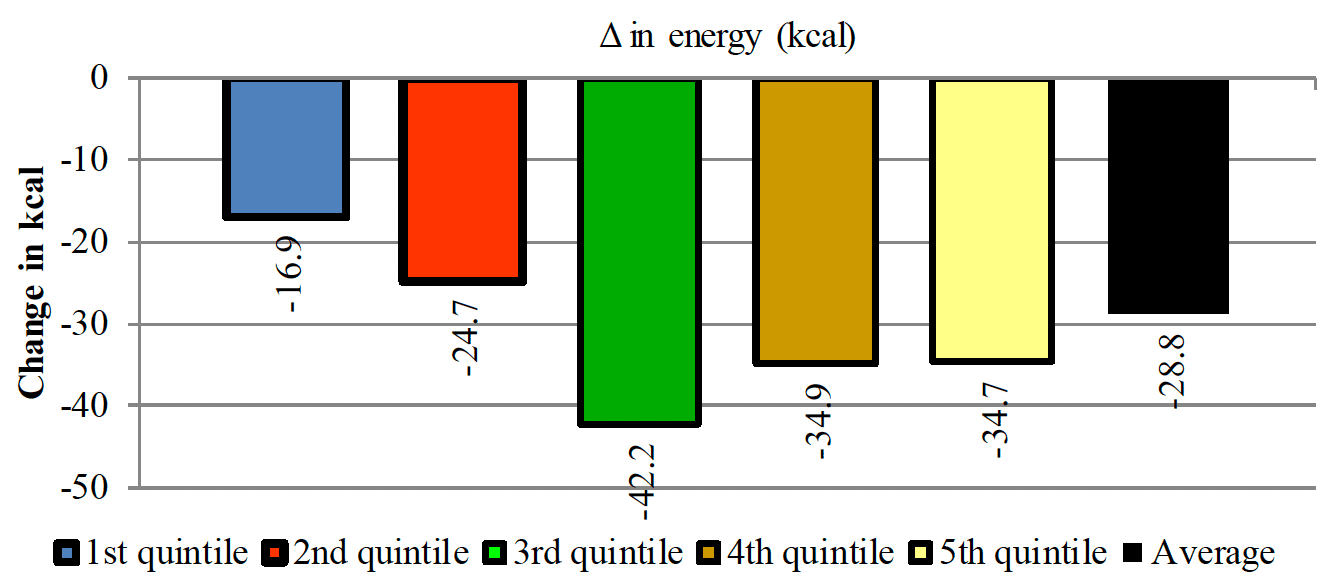
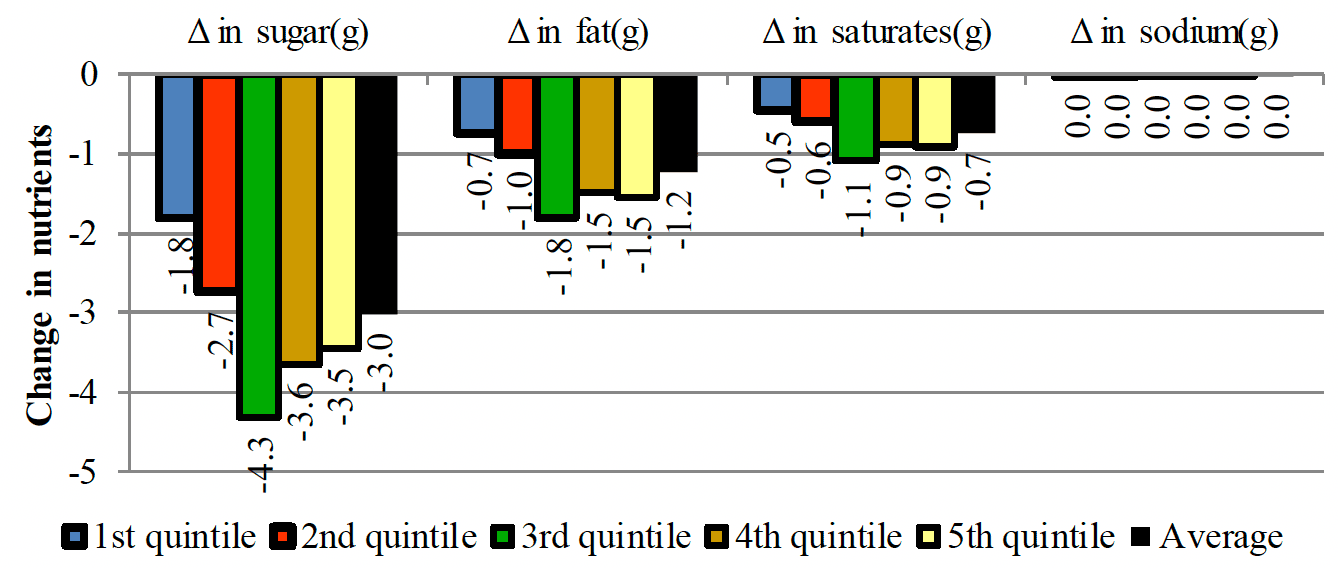
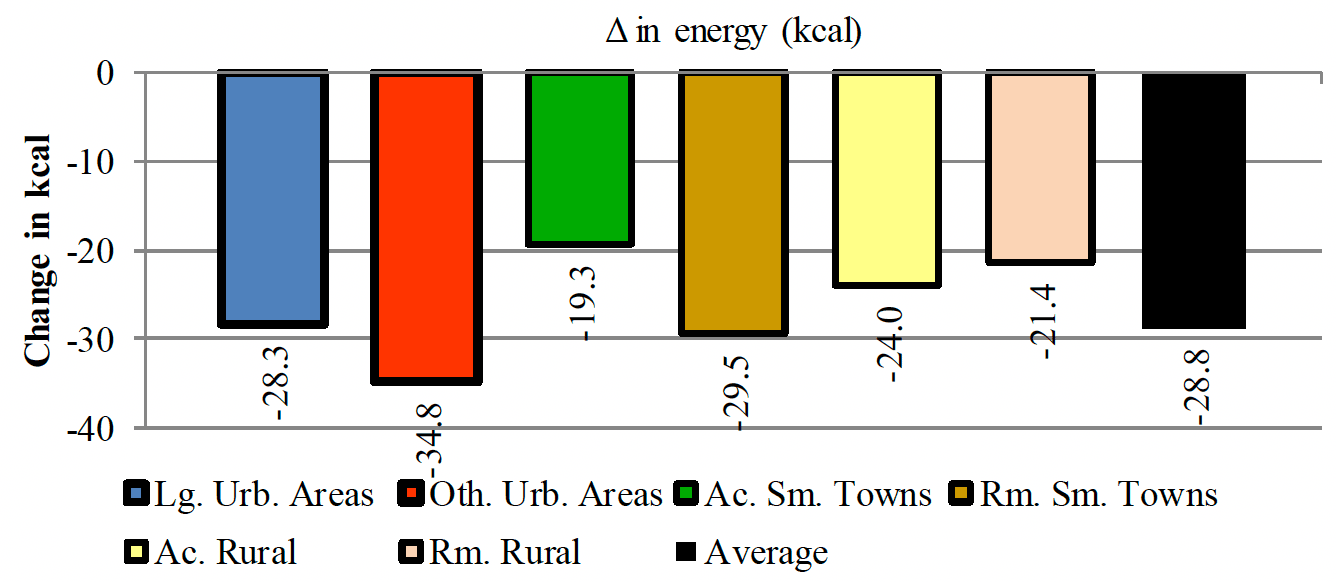
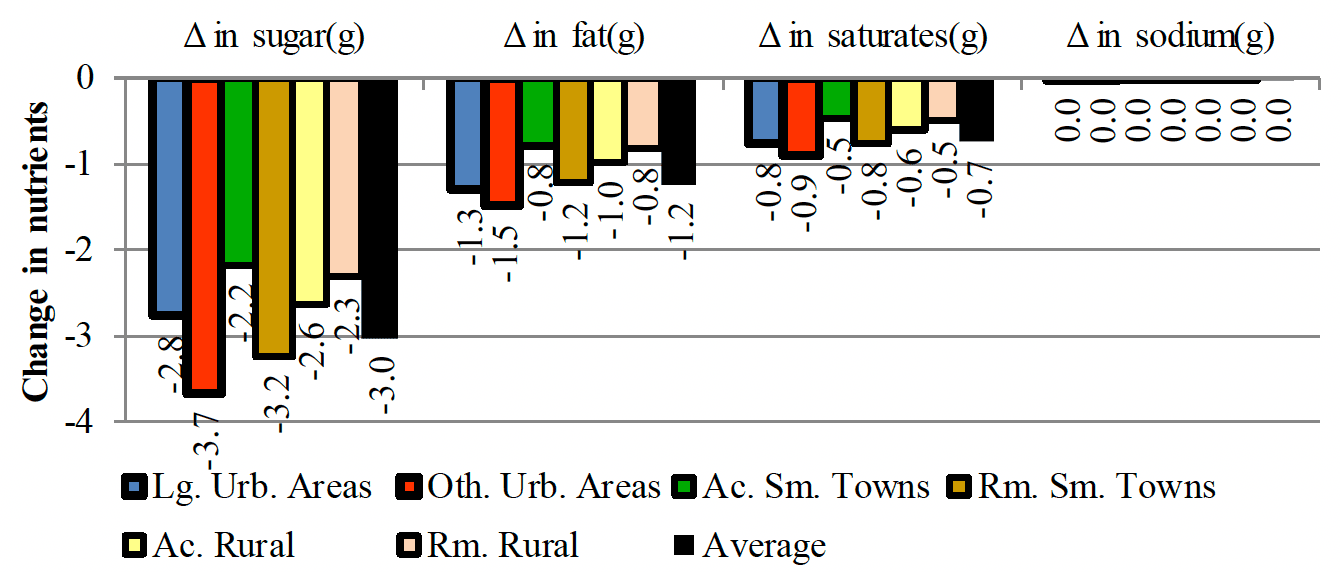
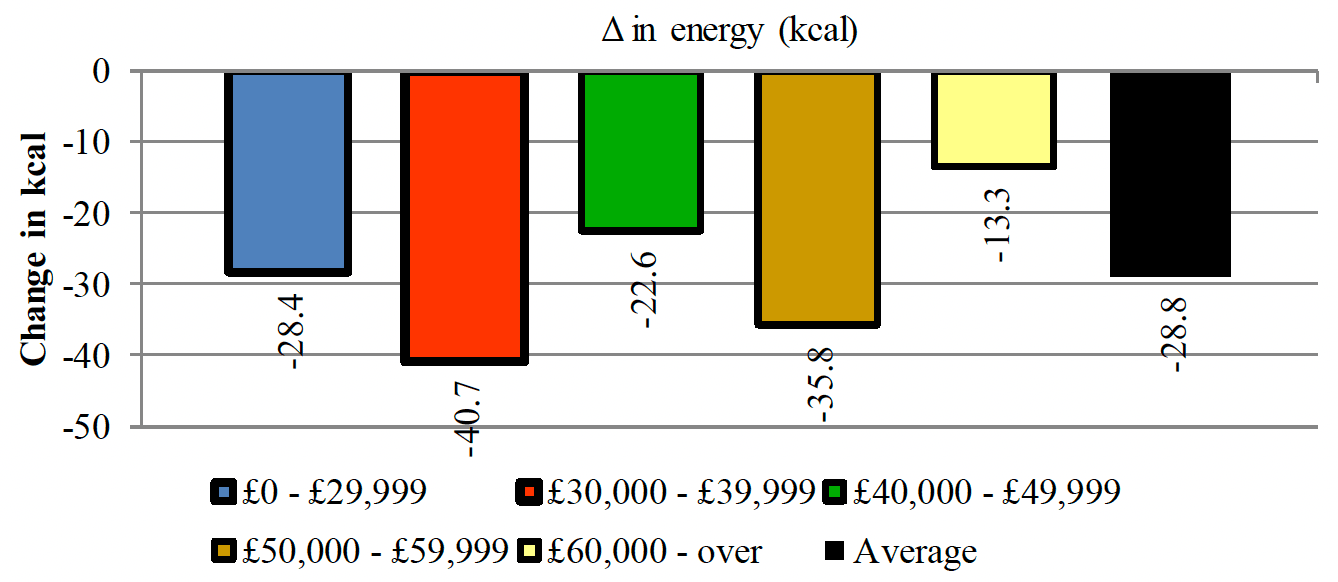
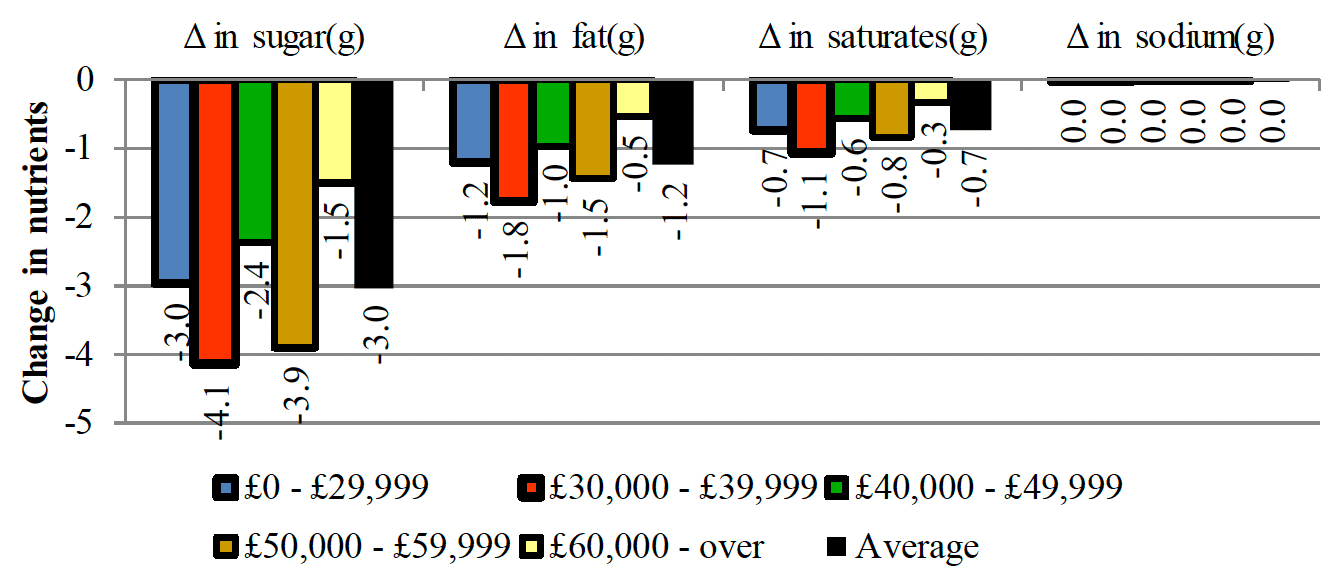
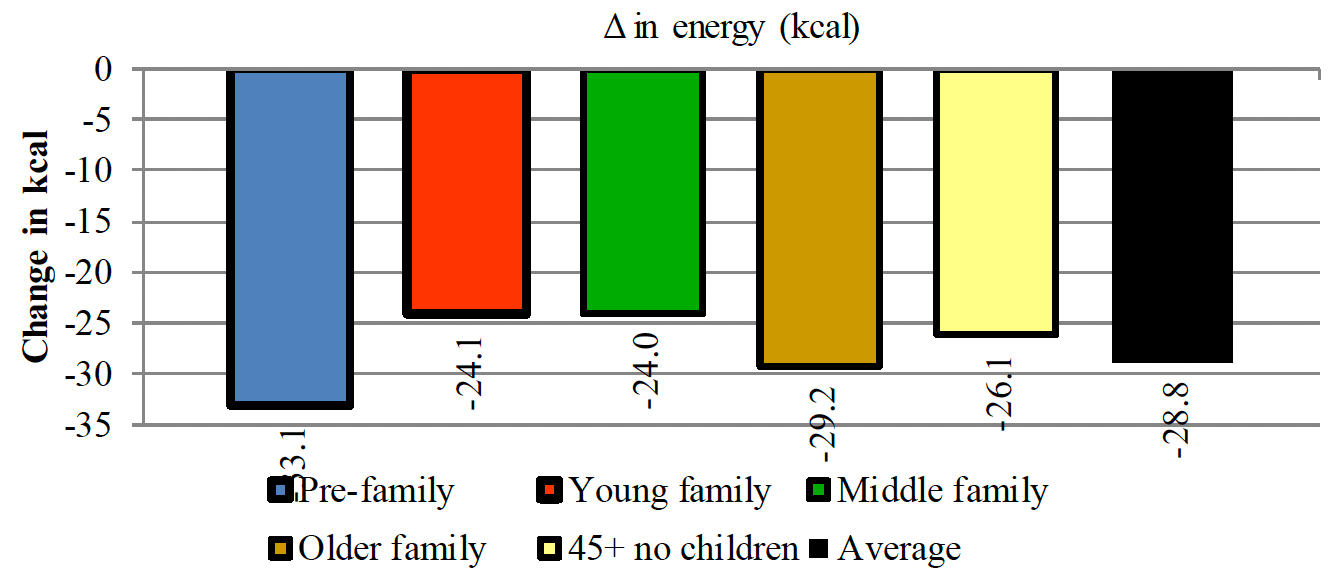
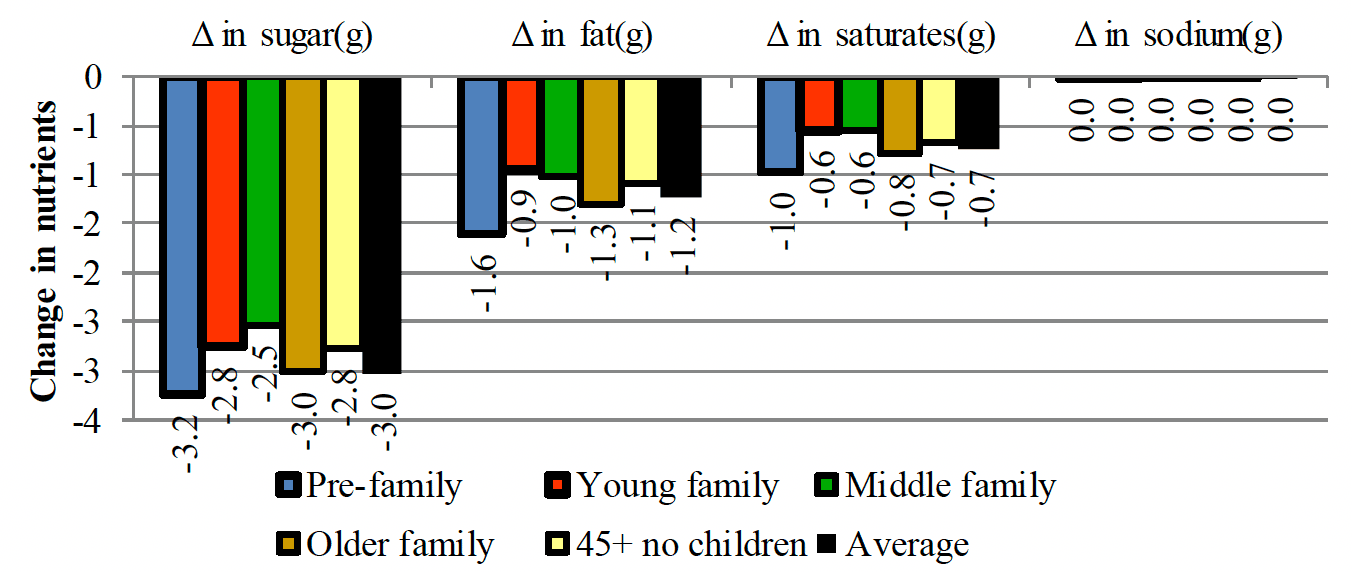
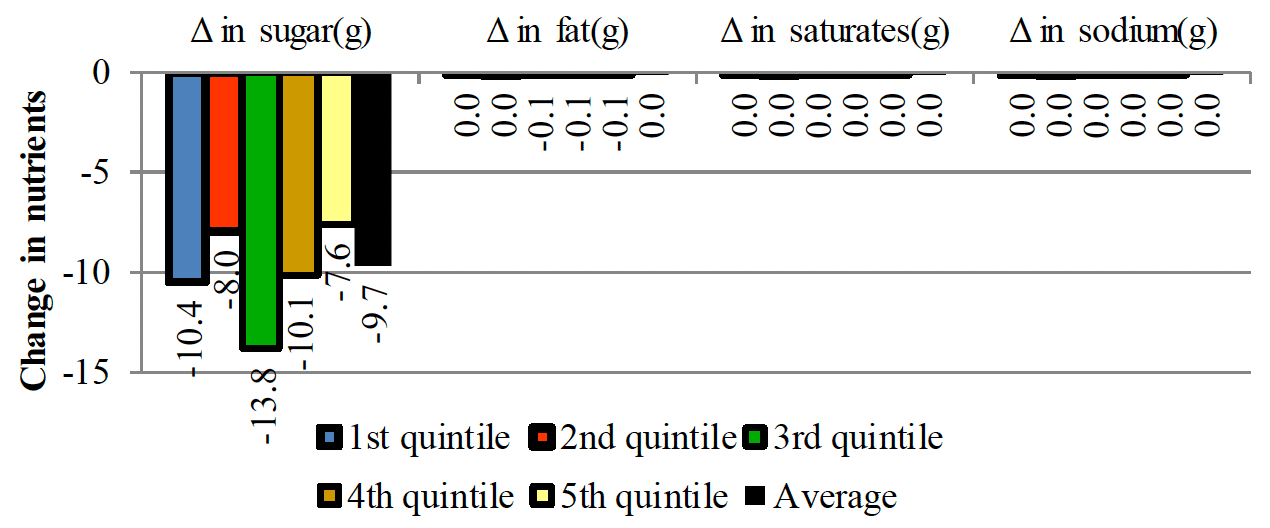
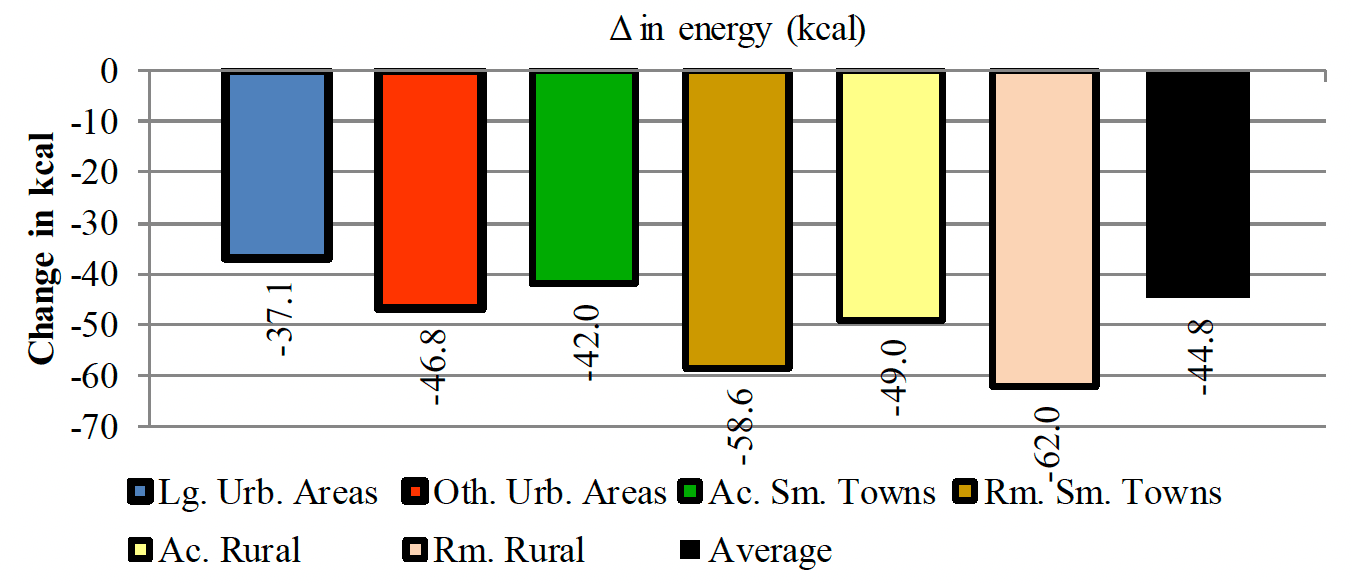
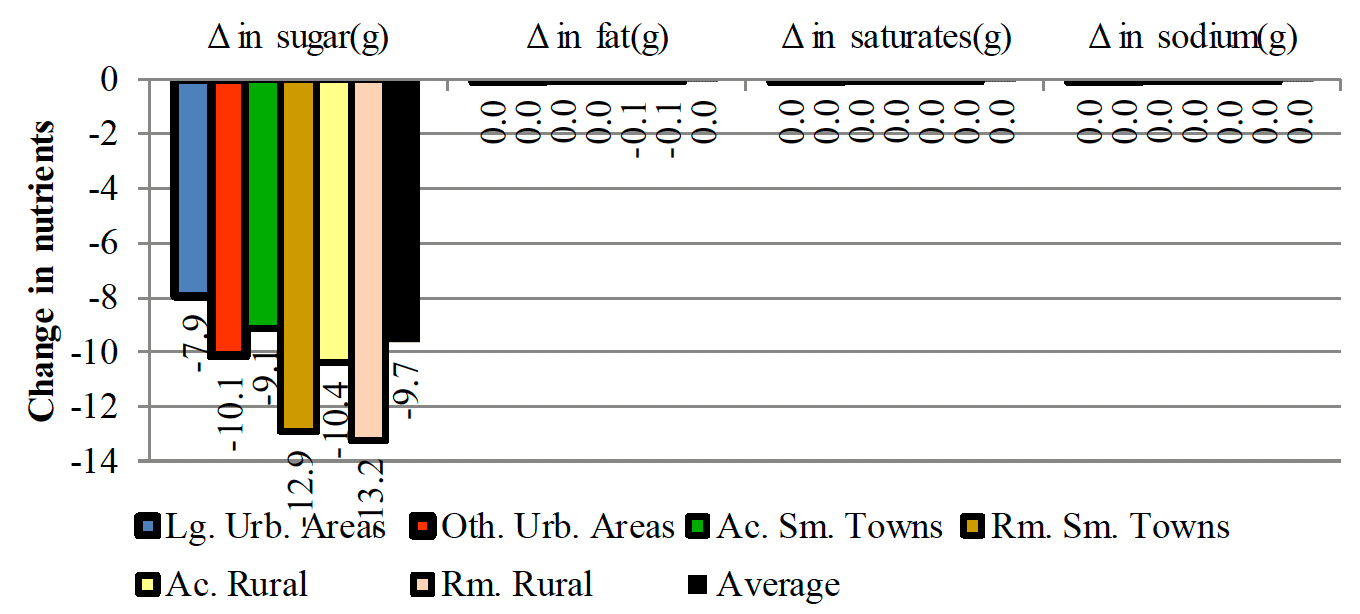
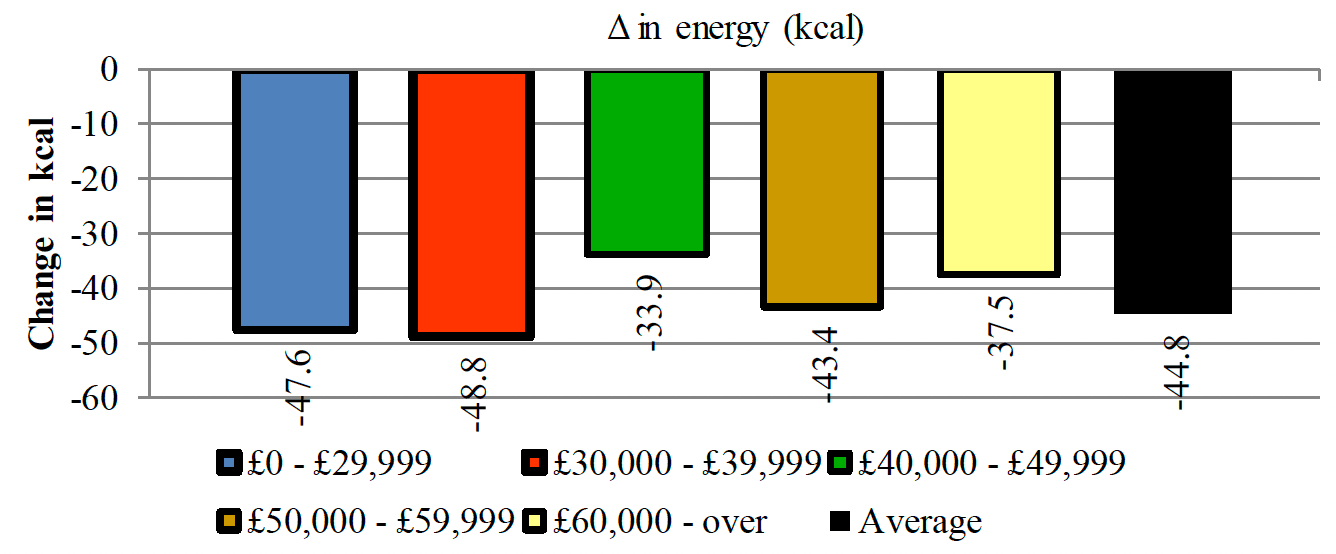
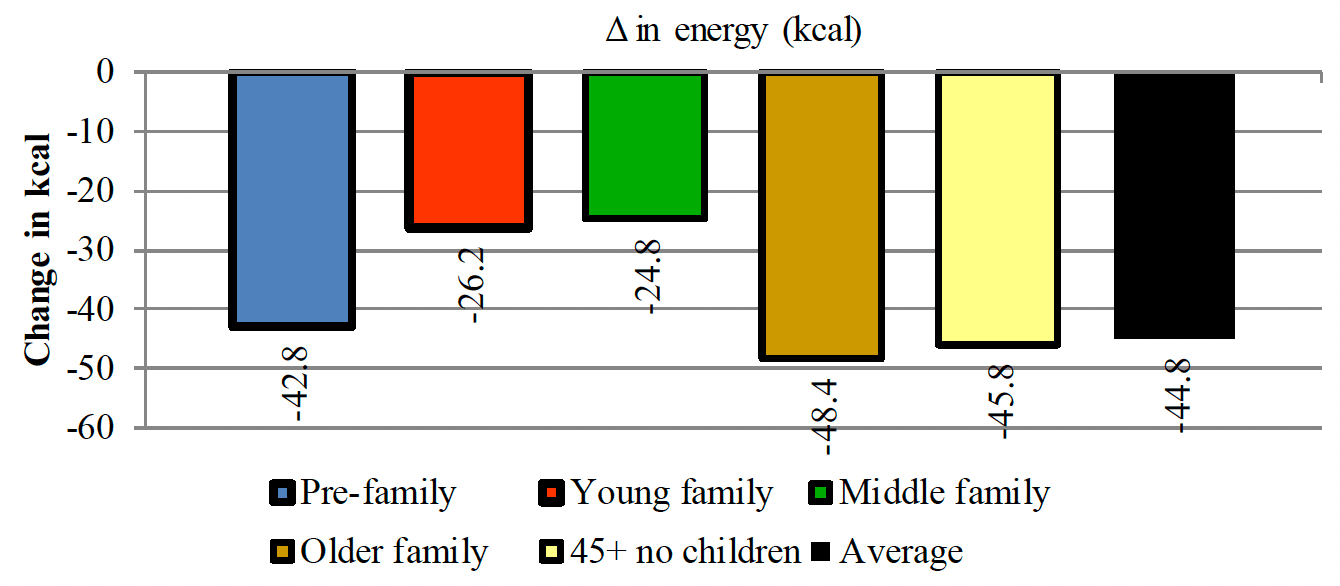
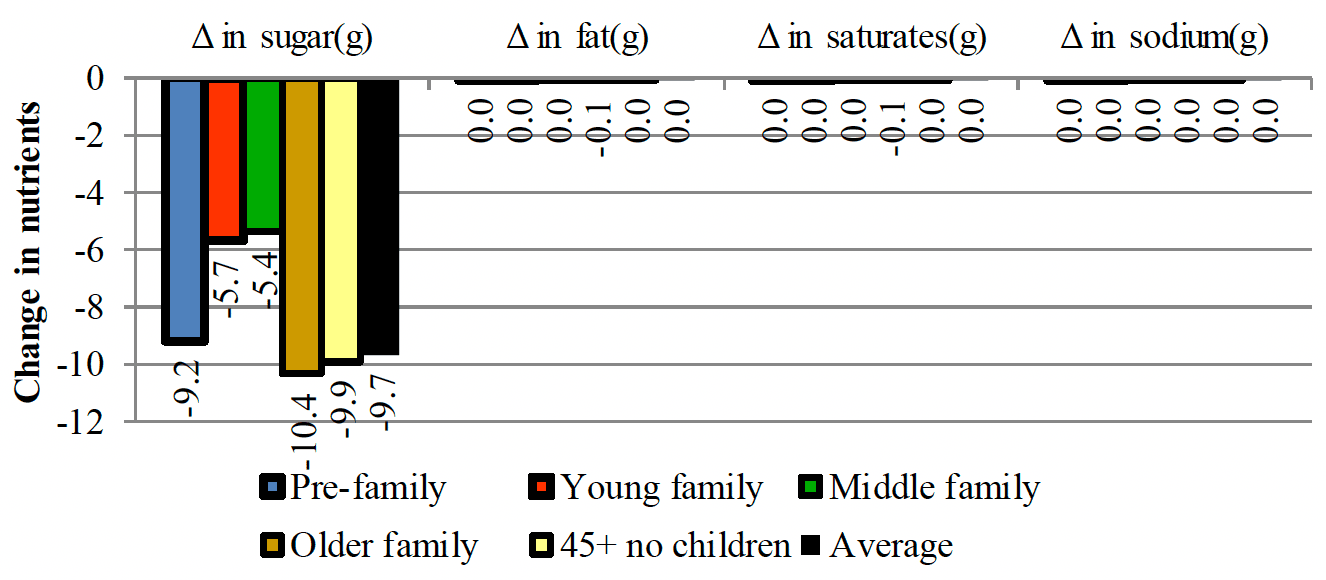
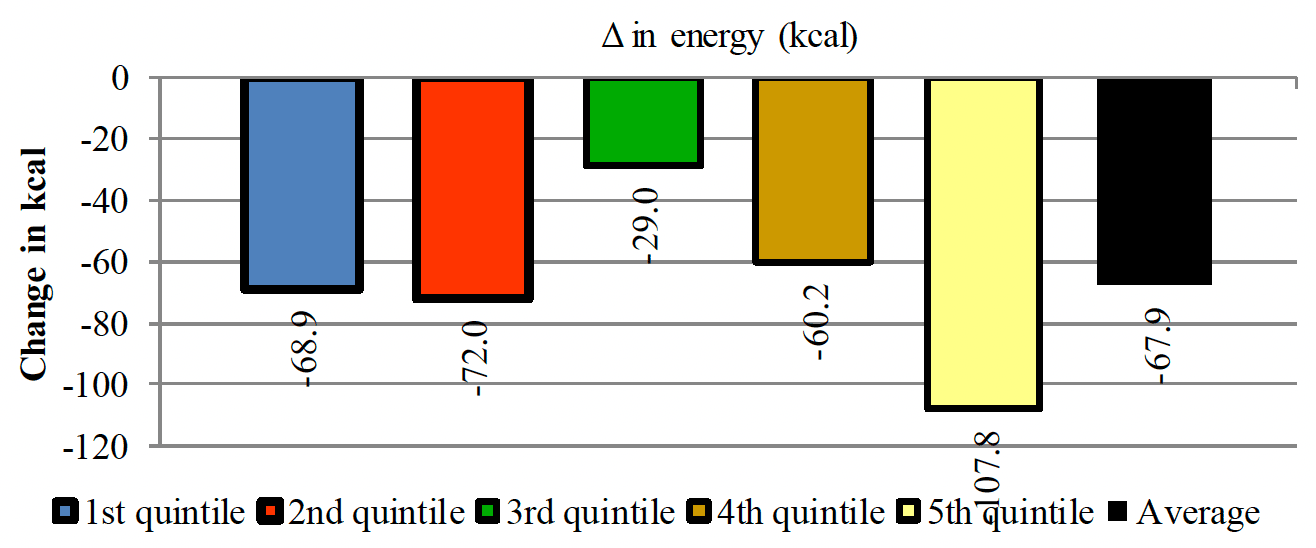
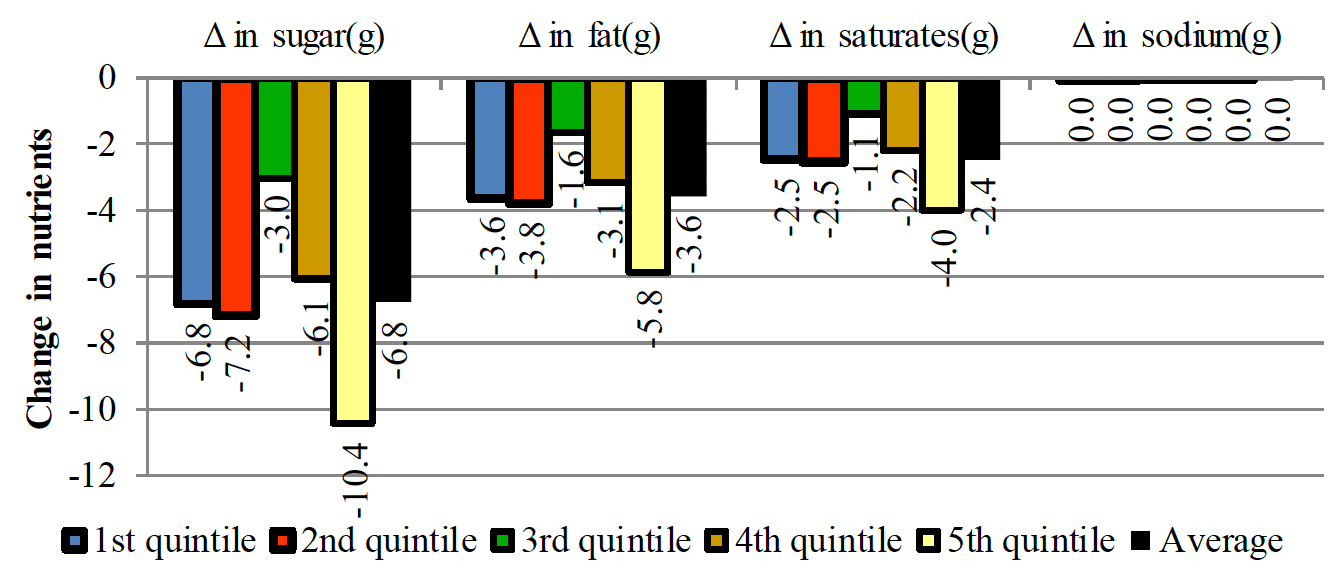
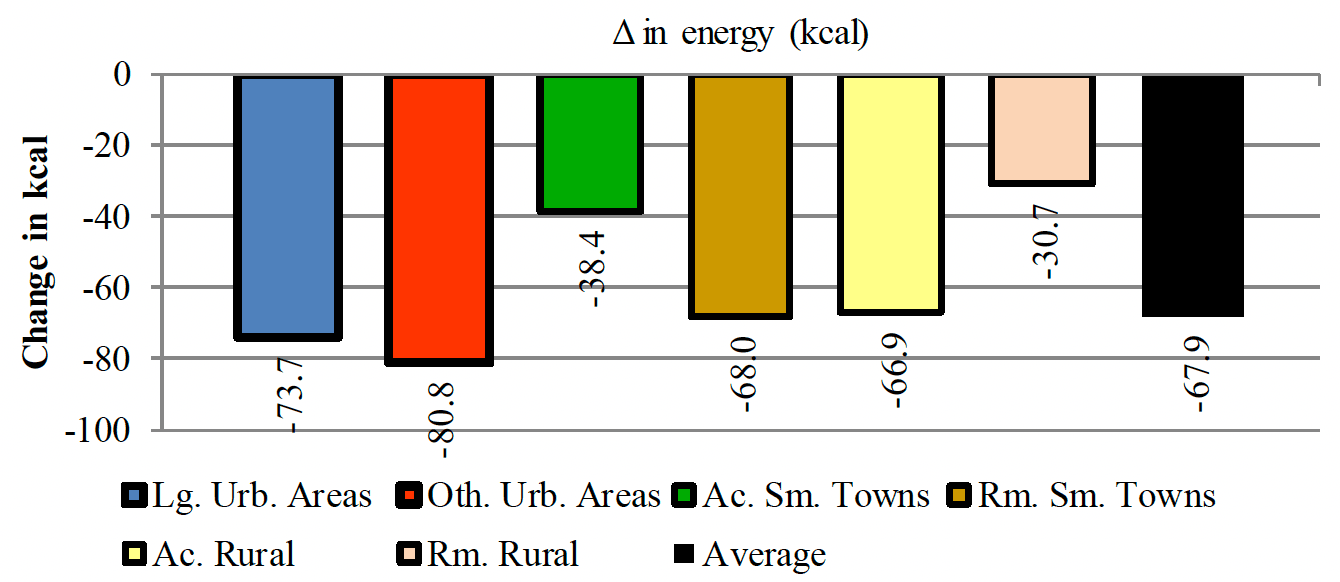
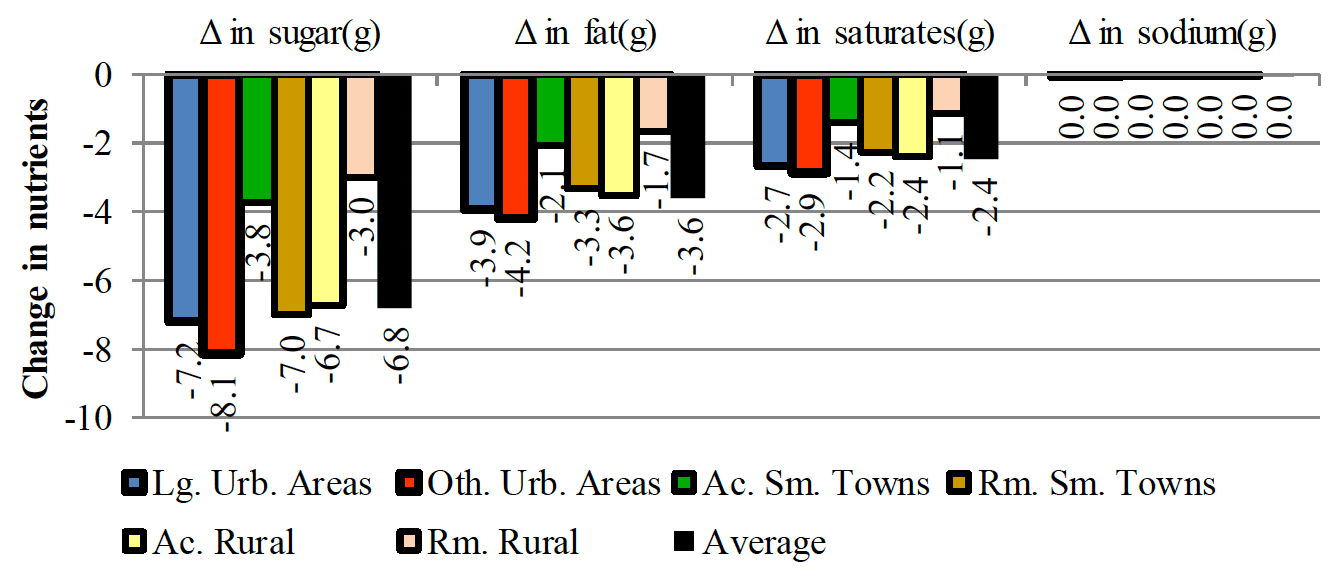
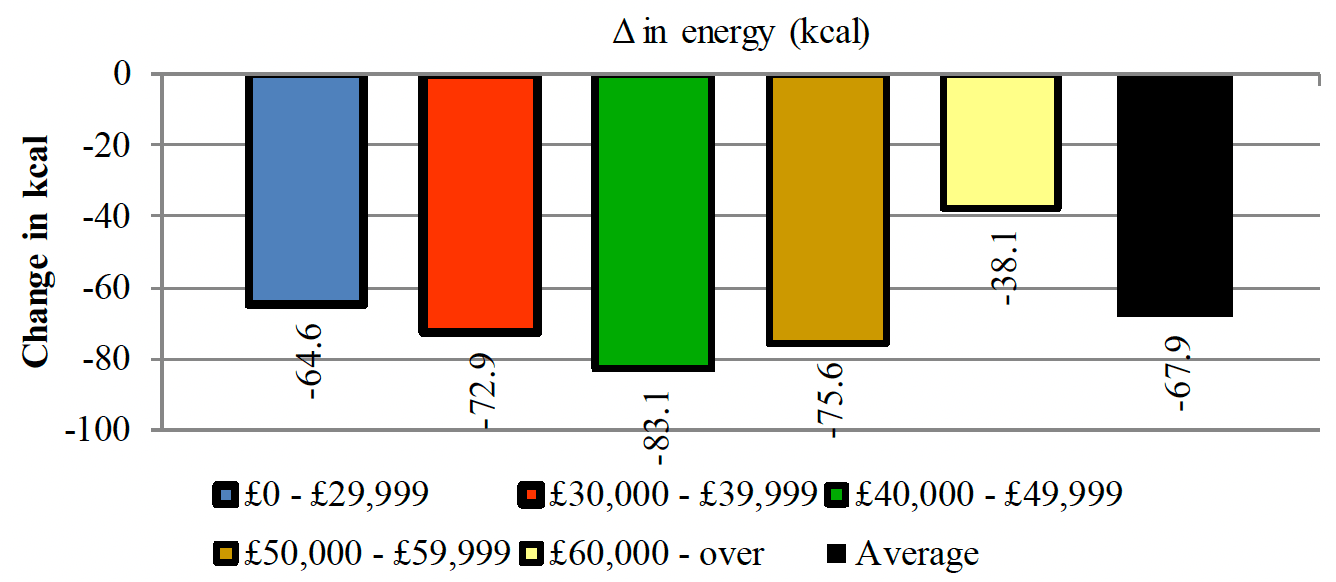
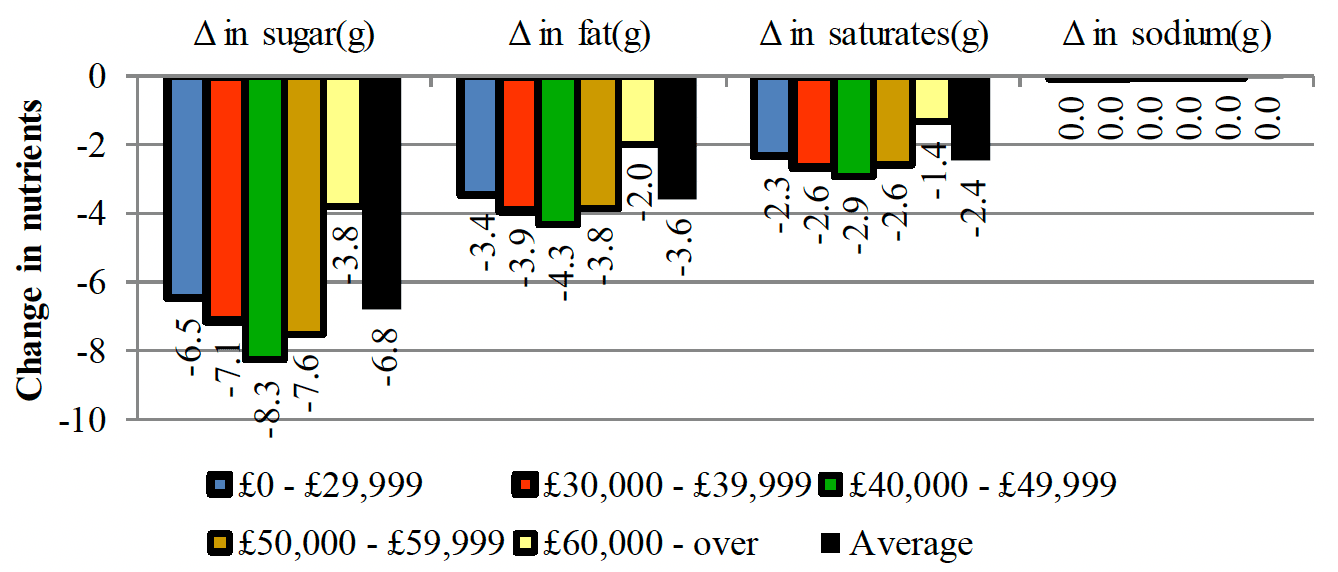
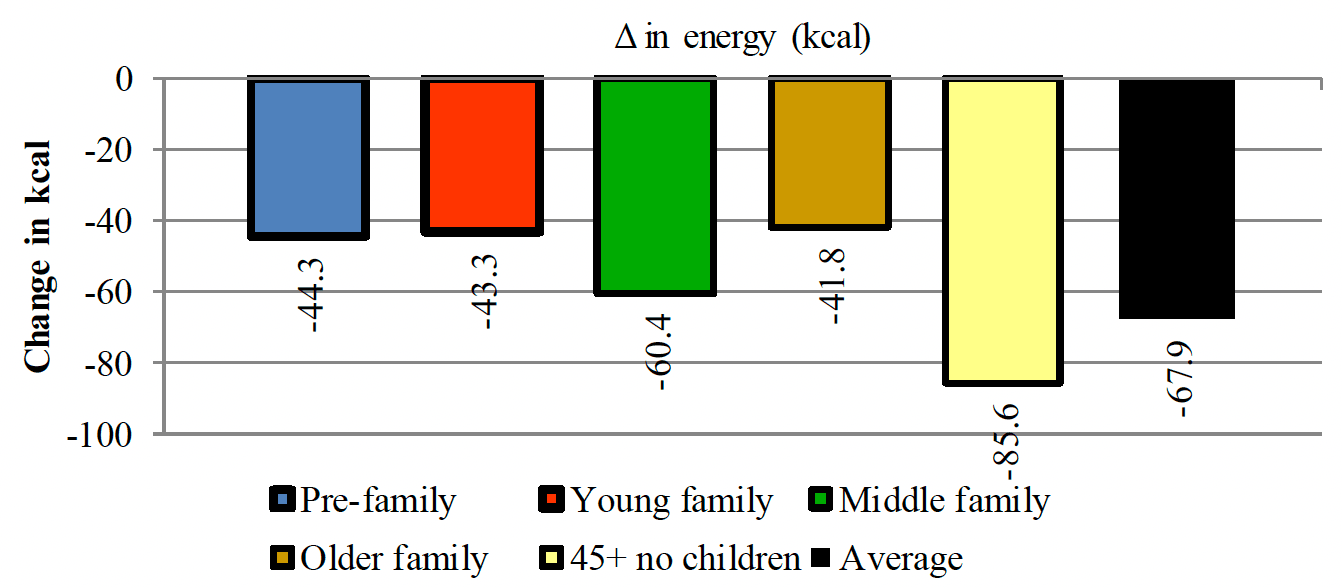
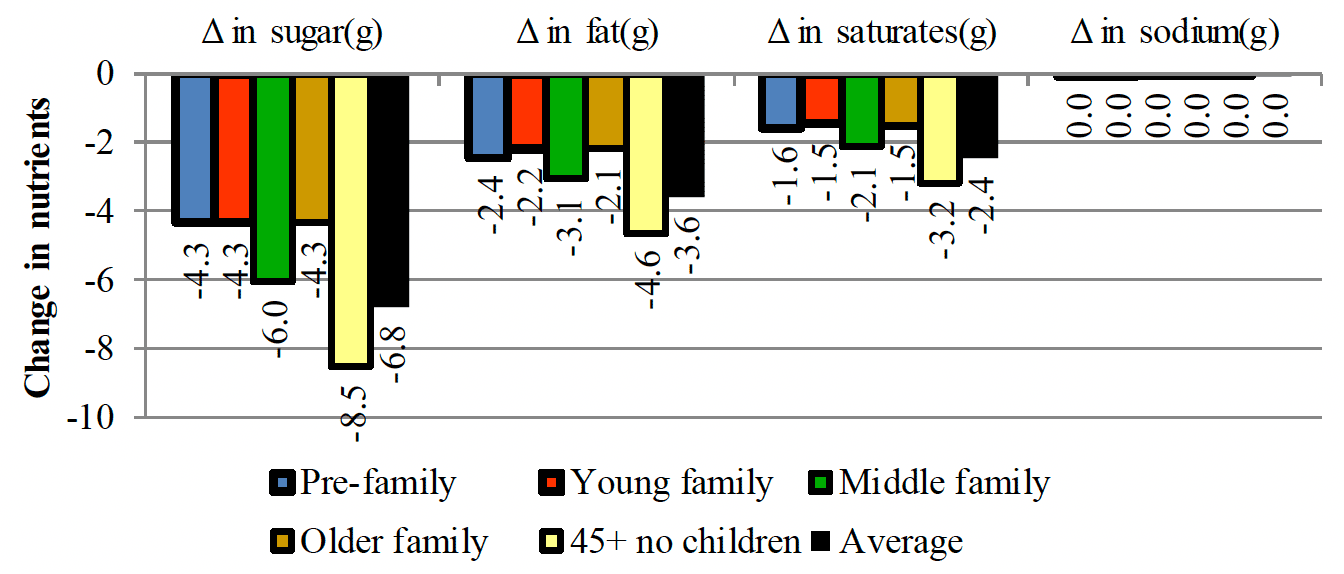
4.8 Figures 8 to 15 show the results in terms of net changes in energy and nutrients by different socioeconomic classifications (i.e., SIMD, rural-urban, income and life stage).
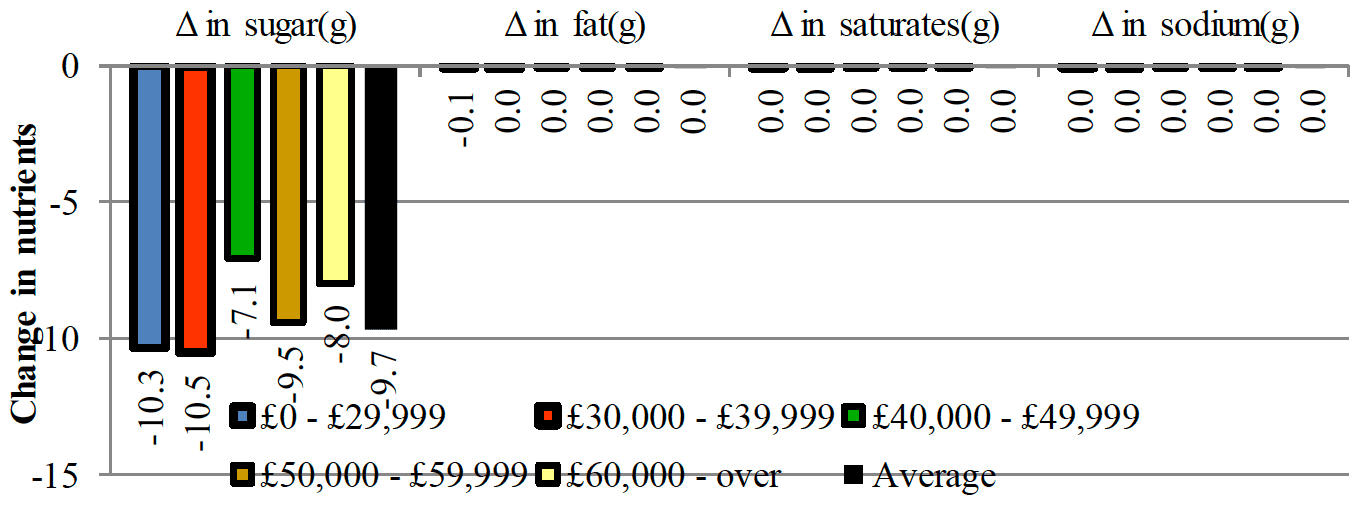
4.9 The simulations show that all the groups display a reduction in energy and nutrients. The range of net reduction of energy goes from 340 kcal (in remote rural areas) to 901 kcal (in remote small towns). The decrease in sugar ranges from 39.7 g. (income above £60,000) to 97.6 g. (in remote small towns). These two groups also provide the limits for fats (5.9 g. to 33.3 g.) and saturated fats (3 g. to 18 g.). In the case of sodium there are four cases that show a slight increase (SIMD 1, accessible small towns, income between £50,000 to £59,999 and middle families); all the other groups show a decrease in sodium.
4.3 Substitution towards non-discretionary food and drink
4.10 Table 16 provides the simulation of the substitution from discretionary food towards non-discretionary food and drink. This is measured in terms of energy and nutrients from the purchases of other food and drink categories.
4.11 Almost all the categories show increases in energy and nutrients except in the case of ready meals, which shows a slight decrease. However, note that this result changes by the different analysed groups (these results can be seen in the Appendix).
4.12 The highest increases in terms of energy are produced by fats and eggs (96.8 kcal.), which also shows the highest increases in fats (10.4 g.) and saturates (4.2 g.). The highest increases in total sugar come from fruit (3.6 g.) and vegetables (3.0 g.). Nevertheless, despite this increase the net effect is an overall reduction in sugar intake from the combined substitution effect within discretionary foods and substitution effect towards non-discretionary foods.
4.13 Table 16 and Figures 16 to 23 show the distribution of the other foods and drinks by the different classifications. From all the groups, fats and eggs is the one with the highest energy, fats and saturates. The category with the highest sugar contribution is fruit.
| Group | Other food and drinks | |||||||||||
|---|---|---|---|---|---|---|---|---|---|---|---|---|
| Dairy products | Meat and fish | Fats and eggs | Fruit | Vegetables | Grains | Prepared ready to eat foods | Sugar and preserves | Condiments and sauces | Low calorie soft drinks and juices | Alcoholic beverages | Total | |
| All the sample | ||||||||||||
| △ in share | 0.002 | 0.004 | 0.002 | 0.004 | 0.006 | 0.002 | -0.001 | 0.000 | 0.001 | 0.001 | 0.013 | 0.035 |
| △ in expenditure (£) | 0.060 | 0.123 | 0.056 | 0.112 | 0.158 | 0.041 | -0.021 | 0.012 | 0.036 | 0.026 | 0.371 | 0.973 |
| △ in quantity (Kg) | 0.016 | 0.015 | 0.020 | 0.029 | 0.062 | 0.014 | -0.004 | 0.002 | 0.003 | 0.003 | 0.033 | 0.193 |
| △ in energy (kcal) | 27.351 | 27.962 | 96.797 | 24.449 | 37.368 | 38.426 | -6.500 | 7.020 | 4.398 | 1.881 | 38.690 | 297.841 |
| △ in protein (g) | 1.524 | 3.100 | 0.637 | 0.434 | 1.443 | 1.162 | -0.307 | 0.094 | 0.086 | 0.063 | 0.035 | 8.270 |
| △ in carbohydrate (g) | 0.951 | 0.482 | 0.133 | 3.915 | 5.929 | 6.705 | -0.602 | 1.061 | 0.502 | 0.307 | 0.498 | 19.881 |
| △ in sugar (g) | 0.810 | 0.099 | 0.091 | 3.600 | 2.589 | 0.943 | -0.116 | 0.807 | 0.302 | 0.219 | 0.401 | 9.745 |
| △ in fat (g) | 1.925 | 1.512 | 10.434 | 0.796 | 0.753 | 0.665 | -0.308 | 0.262 | 0.212 | 0.045 | 0.012 | 16.309 |
| △ in saturates (g) | 1.227 | 0.569 | 4.153 | 0.147 | 0.151 | 0.193 | -0.088 | 0.108 | 0.047 | 0.035 | 0.005 | 6.548 |
| Δ in fibre (g) | 0.026 | 0.058 | 0.016 | 0.498 | 1.321 | 0.597 | -0.060 | 0.033 | 0.052 | 0.074 | 0.000 | 2.616 |
| Δ in sodium (g) | 0.040 | 0.069 | 0.057 | 0.006 | 0.030 | 0.037 | -0.014 | 0.005 | 0.062 | 0.002 | 0.002 | 0.296 |
4.4 Intra-category models
4.14 The purpose of the intra-category models is to provide further more detailed information regarding potential impact of a promotion restriction within each discretionary category.
4.4.1 Take home confectionery
4.15 Table 17 and Figures 24 to 31 present the results for the take home confectionery category. The simulation shows that the advertising of promotions has a positive impact; therefore, its elimination would decrease all quantities purchased. Also, note that despite their potential substitution, the effect of own promotions is the most important one. However, the exception is 'other confectionery', which shows a modest increase in quantity, in energy and nutrients. Nevertheless, the full effect is a decrease in energy and nutrients.
4.16 Within the category, the most important effect comes from branded chocolate confectionery, which achieve a decrease of 190.1 kcal per capita per week, i.e., about 50 per cent of the decrease within the category. It is followed by branded sugar confectionery with -85.4 kcal. Note that branded chocolate confectionery also shows the highest decrease in all the nutrients.
4.17 The results (Table 17) as regards nutrients are not linear as the 'egg novelty and seasonal sweets' shows decreases in both fat and saturates that are higher than branded sugar confectionery, whilst the latter shows a higher decrease in total sugar.
| Group | Category | Total | |||||
|---|---|---|---|---|---|---|---|
| Chocolate confectionery | Egg, novelty and seasonal sweets | Sugar confectionery | Other confectionery | ||||
| Private label | Branded | Private label | Branded | ||||
| All the sample | |||||||
| △ in share | 0.000 | -0.006 | 0.000 | -0.001 | -0.001 | 0.000 | -0.008 |
| △ in expenditure (£) | -0.009 | -0.161 | -0.013 | -0.014 | -0.027 | 0.007 | -0.217 |
| △ in quantity (Kg) | -0.003 | -0.037 | -0.007 | -0.016 | -0.023 | 0.002 | -0.084 |
| △ in energy (kcal) | -14.403 | -190.083 | -37.052 | -62.109 | -85.422 | 4.230 | -384.838 |
| △ in protein(g) | -0.171 | -2.191 | -0.448 | -0.385 | -0.659 | 0.024 | -3.830 |
| △ in carbohydrate(g) | -1.520 | -22.201 | -4.203 | -13.515 | -18.680 | 1.283 | -58.836 |
| △ in sugar(g) | -1.348 | -20.120 | -3.944 | -10.108 | -14.504 | 0.180 | -49.843 |
| △ in fat(g) | -0.829 | -10.095 | -2.033 | -0.745 | -0.892 | 0.067 | -14.527 |
| △ in saturates(g) | -0.478 | -5.873 | -1.215 | -0.423 | -0.551 | 0.041 | -8.500 |
| △ in fibre(g) | -0.089 | -0.711 | -0.116 | -0.068 | -0.100 | 0.018 | -1.066 |
| △ in sodium(g) | -0.002 | -0.042 | -0.007 | -0.016 | -0.020 | 0.001 | -0.086 |
4.18 Figures 24 and 25 show the changes in energy and nutrients by SIMD quintile. All the quintiles show a decrease in both energy and nutrients. Figures 26 and 27 indicates that the change in energy and nutrients is expected to be relatively similar in all areas.
4.19 The results by income (Figures 28 and 29) match the results by SIMD, i.e., all groups show a decrease in energy and nutrient.
4.21 As regards the impact of the policy by household's life stage (Figures 30 and 31), the results show that all the groups show a decrease in energy and nutrients.
4.4.2 Biscuits
4.22 Table 18 and Figures 32 to 39 present the results for energy and nutrients for the biscuit category. They show that the advertising of promotions has a positive impact on almost all the categories; therefore, their elimination decreases their quantities. However, the exception is 'crackers and crispbreads', where the substitution effect shows a modest increase in quantity, and in energy and nutrients. As in the case of take-home confectionery, the full effect is a decrease in energy and nutrients.
4.23 Within the sub-categories, 'chocolate biscuit bars and children biscuits' and 'everyday biscuits and treats' accumulate most of the impact, with a reduction of approximately 60 kcal per capita per week out of the 86 kcal per capita per week (70 per cent).
4.24 The results as regards 'healthier biscuits' indicate a complementary effect (i.e., healthier biscuits are purchased at the same time as less healthier biscuits) between different types of biscuits.
| Group | Category | Total | |||||
|---|---|---|---|---|---|---|---|
| Cereals and fruit bars | Chocolate biscuit bars and children biscuits | Everyday biscuits and treats | Crackers and crispbreads | Special treats and seasonal biscuits | Healthier biscuits | ||
| All the sample | |||||||
| △ in share | -0.001 | -0.001 | -0.001 | 0.000 | 0.000 | -0.001 | -0.004 |
| △ in expenditure (£) | -0.029 | -0.037 | -0.021 | 0.001 | -0.002 | -0.017 | -0.105 |
| △ in quantity (Kg) | -0.003 | -0.007 | -0.006 | 0.000 | 0.000 | -0.003 | -0.018 |
| △ in energy (kcal) | -13.457 | -32.391 | -27.030 | 0.412 | -1.120 | -11.956 | -85.542 |
| △ in protein(g) | -0.231 | -0.369 | -0.333 | 0.009 | -0.013 | -0.171 | -1.108 |
| △ in carbohydrate(g) | -1.964 | -4.259 | -3.729 | 0.063 | -0.138 | -1.836 | -11.864 |
| △ in sugar(g) | -0.952 | -2.747 | -1.804 | 0.005 | -0.073 | -0.789 | -6.359 |
| △ in fat(g) | -0.468 | -1.514 | -1.166 | 0.013 | -0.056 | -0.420 | -3.612 |
| △ in saturates(g) | -0.184 | -0.891 | -0.582 | 0.005 | -0.030 | -0.138 | -1.820 |
| △ in fibre(g) | -0.268 | -0.150 | -0.155 | 0.005 | -0.005 | -0.123 | -0.695 |
| △ in sodium(g) | -0.006 | -0.012 | -0.016 | 0.000 | -0.001 | -0.007 | -0.041 |
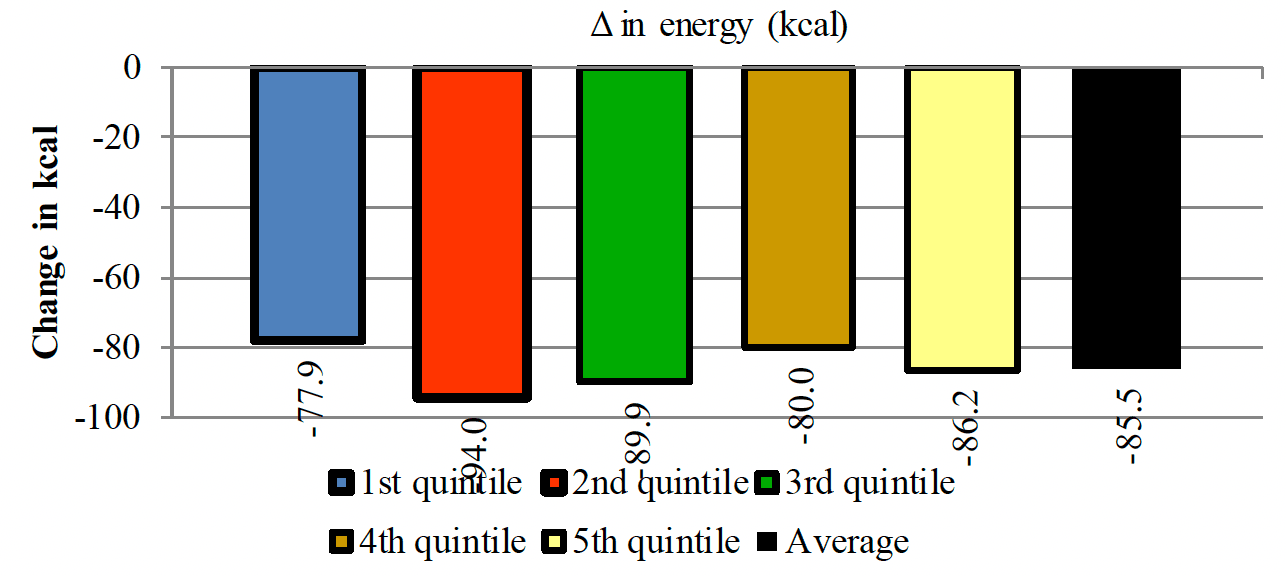
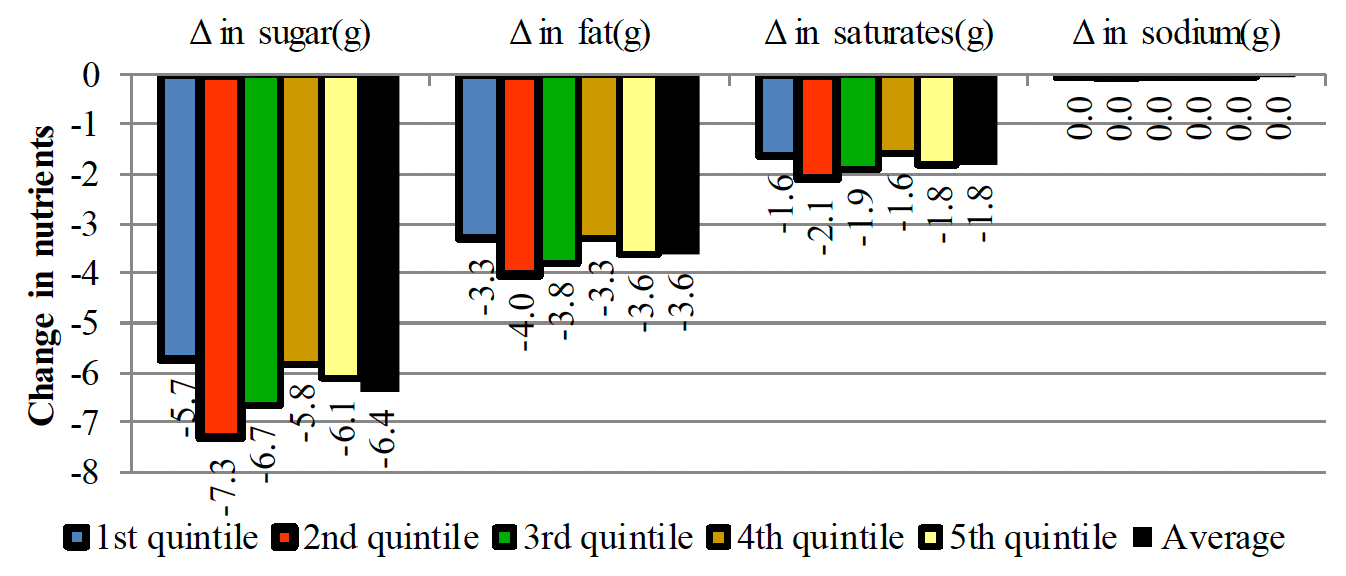
4.25 Figures 32 and 33 shows that the decrease in energy by SIMD quintile is very similar by quintile ranging from 77.9 (1st quintile) to 94 (2nd quintile) kcal per capita per week. This is similar for all the nutrients.
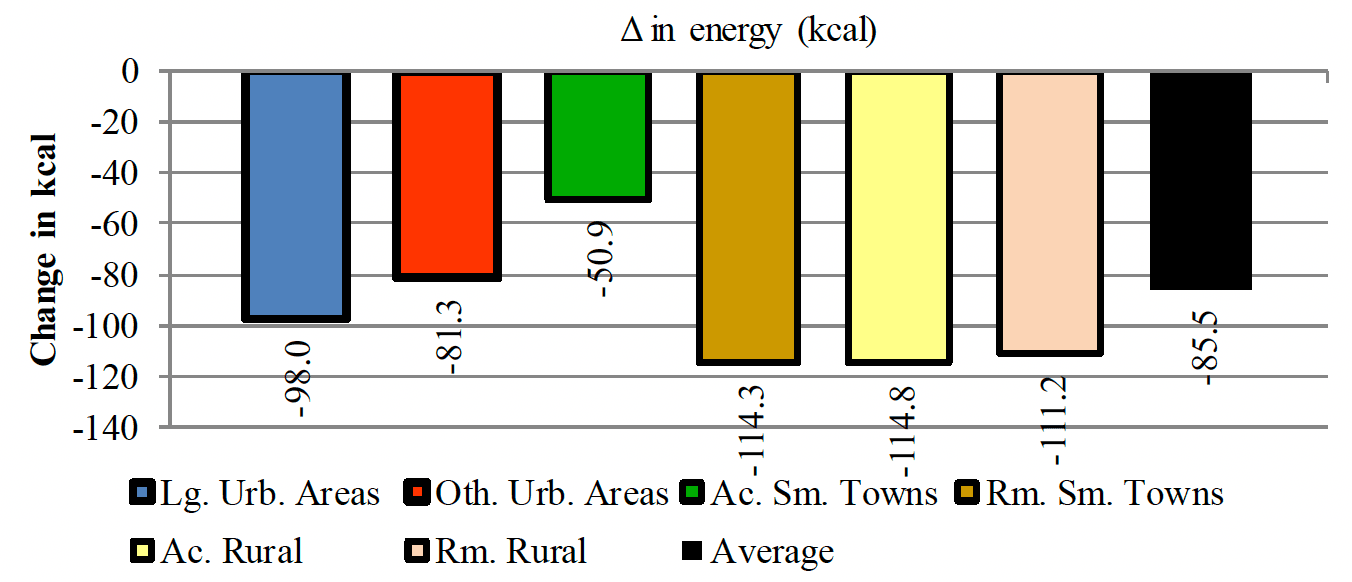
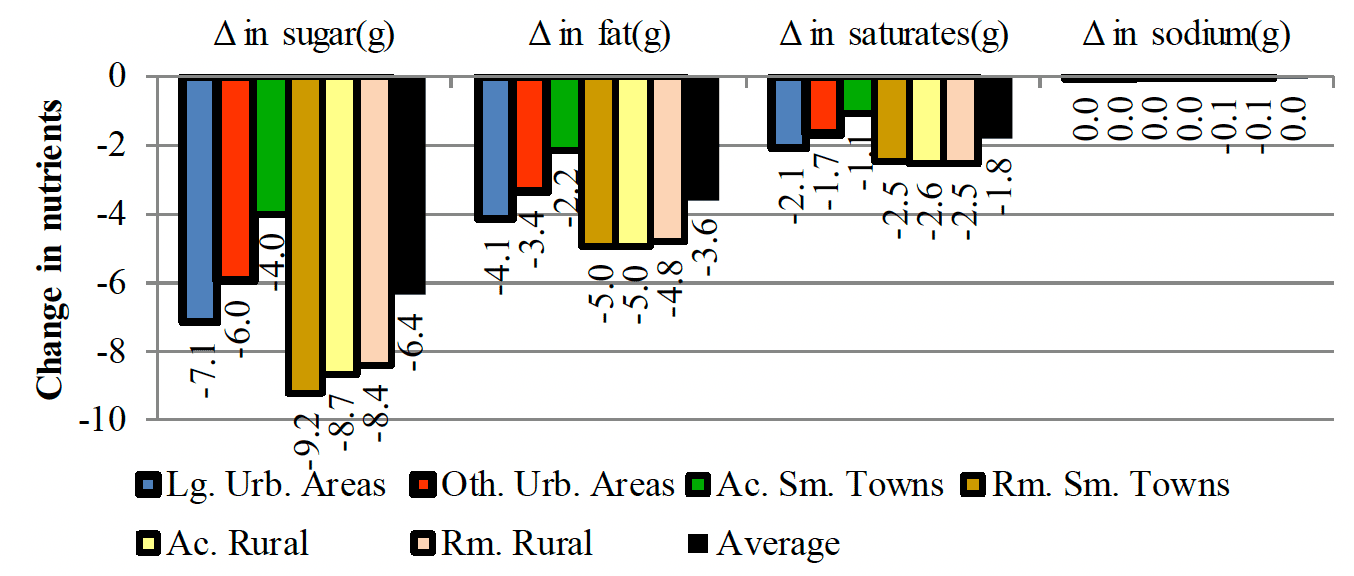
4.26 In comparison with the results by SIMD, the ones by rural-urban (Figures 35 and 36) show far more variability, with remote areas (urban and rural) and accessible rural showing the highest decrease in energy. Nevertheless, all the results show the expected effect of the elimination of the advertising of promotions.
4.27 Figures 36 and 37 show the results by income ranges for energy and nutrients, and indicate a reduction in energy in all the groups. The changes in nutrients by group mimic the changes in energy.
4.28 As regards the results by life stage groups (Figures 38 and 39), the expected impact is to decrease the purchase of energy. As in the case of income ranges, the changes in nutrients by group mimic the changes in energy.
4.4.3 Take home savouries
4.29 Table 19 and Figures 40 to 47 present the results by take home savouries. Overall, the category shows a reduction of energy and there was no substitution effect within the category (i.e., all the sub-categories decreased their purchases). Branded crisps and branded savoury snacks represented most of the changes in the category (78 per cent of the total reduction of energy on the category). This is also reflected on the reduction of macronutrients.
| Group | Category | Total | |||||
|---|---|---|---|---|---|---|---|
| Crisps | Savoury snacks | Nuts | Popcorn | ||||
| Private label | Branded | Private label | Branded | ||||
| All the sample | |||||||
| △ in share | 0.000 | -0.003 | 0.000 | -0.003 | 0.000 | 0.000 | -0.006 |
| △ in expenditure (£) | -0.009 | -0.073 | -0.004 | -0.074 | 0.000 | -0.006 | -0.166 |
| △ in quantity (Kg) | -0.001 | -0.009 | -0.001 | -0.008 | 0.000 | -0.001 | -0.020 |
| △ in energy (kcal) | -6.921 | -47.850 | -2.589 | -42.008 | -0.029 | -3.353 | -102.750 |
| △ in protein(g) | -0.081 | -0.586 | -0.032 | -0.486 | -0.001 | -0.046 | -1.232 |
| △ in carbohydrate(g) | -0.733 | -5.124 | -0.310 | -4.812 | -0.001 | -0.463 | -11.444 |
| △ in sugar(g) | -0.035 | -0.240 | -0.020 | -0.296 | 0.000 | -0.163 | -0.754 |
| △ in fat(g) | -0.395 | -2.691 | -0.132 | -2.269 | -0.002 | -0.135 | -5.624 |
| △ in saturates(g) | -0.043 | -0.263 | -0.013 | -0.247 | 0.000 | -0.024 | -0.590 |
| △ in fibre(g) | -0.055 | -0.392 | -0.017 | -0.279 | 0.000 | -0.057 | -0.800 |
| △ in sodium(g) | -0.007 | -0.051 | -0.004 | -0.063 | 0.000 | -0.003 | -0.127 |
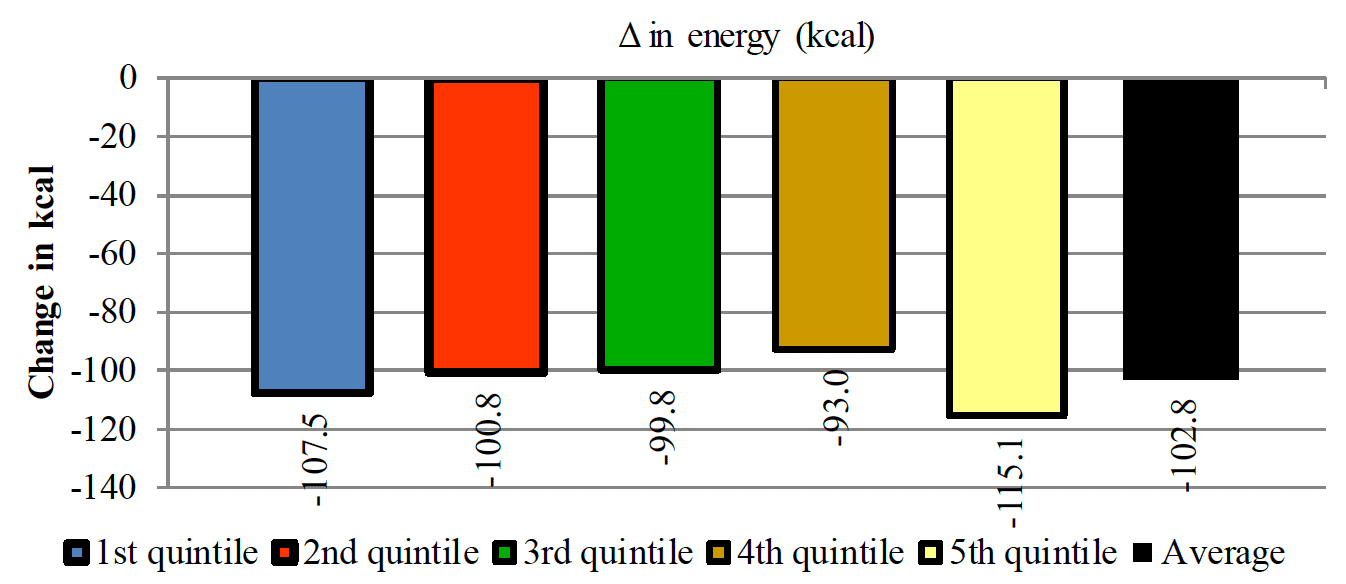
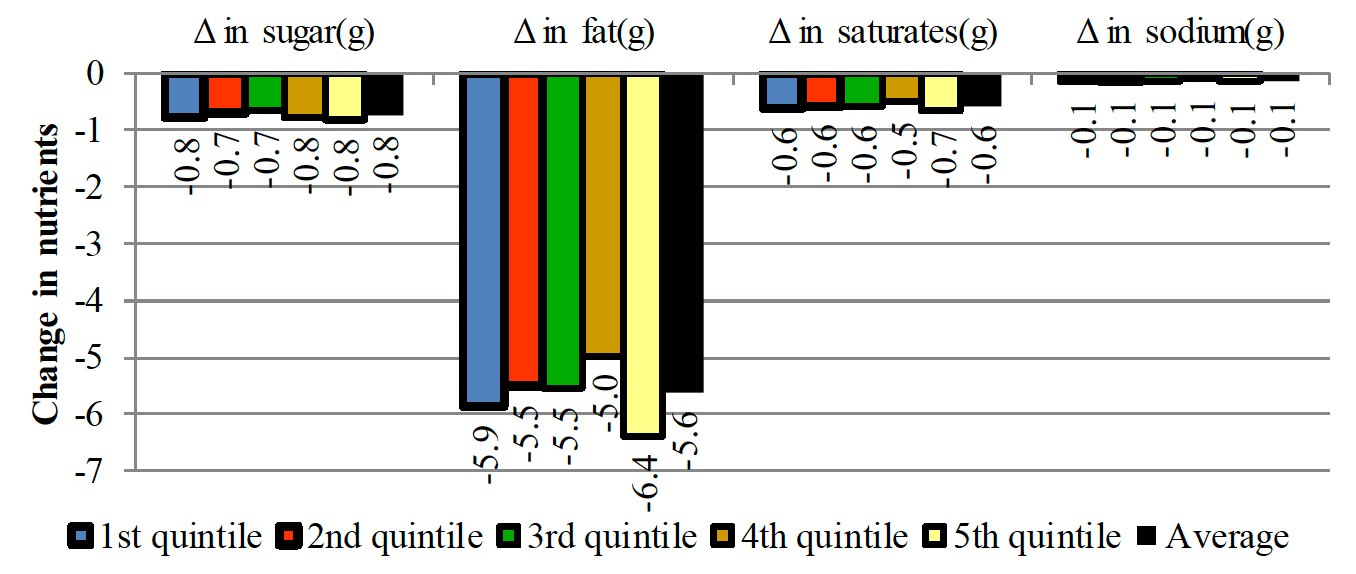
4.30 Figure 40 shows that the decrease in energy by SIMD quintile is very similar by quintile ranging from 93 (4th quintile) to 115 (5th quintile) kcal per capita per week. This reduction is similar for all the nutrients (Figure 41).
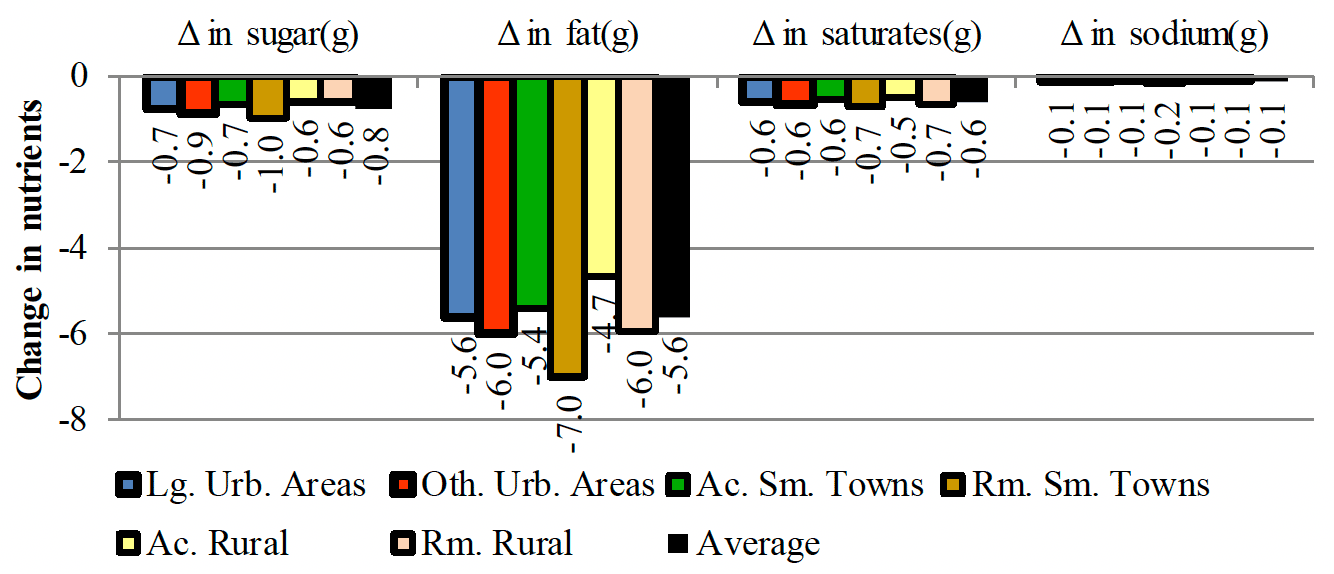
4.31 In terms of the urban and rural categories (Figures 42 and 43), the results show a decrease in all the groups in terms of energy reduction. The pattern of reduction is similar for all the nutrients.

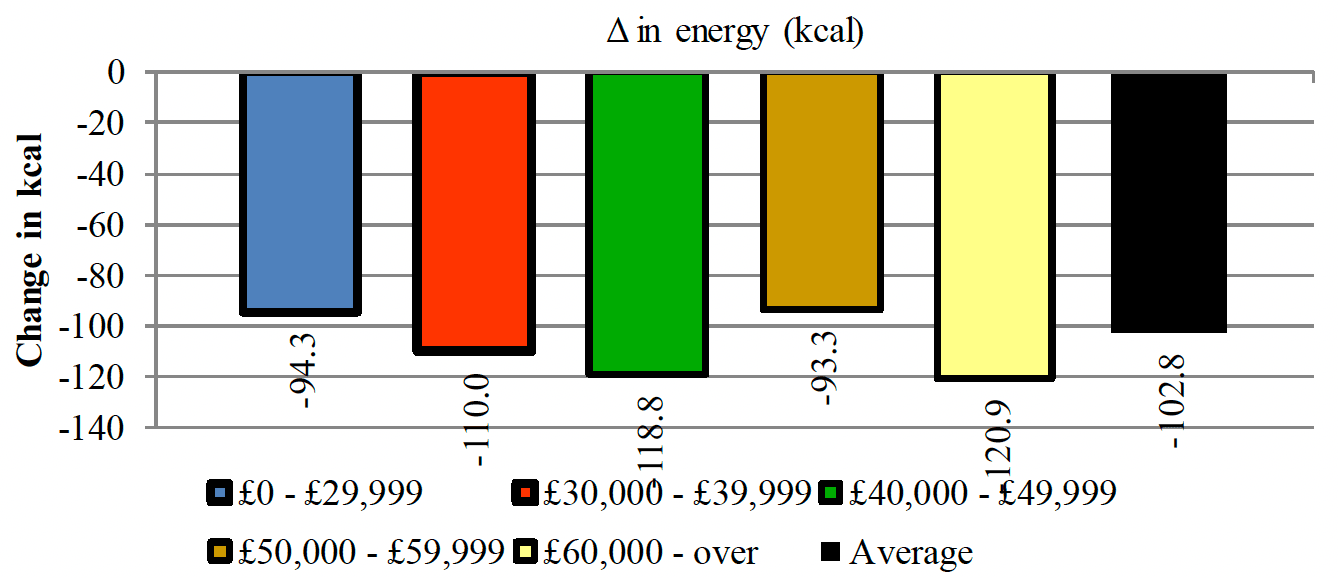
4.32 The results by income (Figures 44) show that all the groups would be expected to have a reduction on the purchases of take home savouries measured in terms of energy. The distribution of the reduction of macro nutrients shows the same distribution as energy (Figure 45).
4.33 The life stage results (Figures 46 and 47) indicates that all the groups are expected to show reductions on energy and nutrition.
4.4.4 Ambient cakes and pastries
4.34 Table 20 and Figures 48 to 55 present the results for ambient cakes and pastries. Overall, there is an estimated reduction of 126 kcal per capita per week. Morning goods represented most of the changes in the category (66 per cent of the total reduction of energy). This is also reflected in the nutrient effects, where reductions in carbohydrates are largest within the morning goods category, relative to cakes and pastries. Similar to the previous category of take-home savouries, there was no substitution effect within the category (i.e., purchases of cakes and pastries were also estimated to decrease).
| Group | Category | Total | |||||
|---|---|---|---|---|---|---|---|
| Cakes | Pastries | Morning goods | |||||
| Private label | Branded | Private label | Branded | Private label | Branded | ||
| All the sample | |||||||
| △ in share | 0.000 | 0.000 | 0.000 | -0.001 | -0.001 | -0.001 | -0.003 |
| △ in expenditure (£) | -0.002 | -0.010 | -0.007 | -0.014 | -0.023 | -0.027 | -0.084 |
| △ in quantity (Kg) | -0.001 | -0.006 | -0.006 | -0.011 | -0.027 | -0.019 | -0.070 |
| △ in energy (kcal) | -2.223 | -10.026 | -12.730 | -17.247 | -50.393 | -33.126 | -125.745 |
| △ in protein(g) | -0.026 | -0.108 | -0.151 | -0.215 | -1.836 | -1.009 | -3.345 |
| △ in carbohydrate(g) | -0.319 | -1.421 | -1.818 | -2.513 | -8.472 | -5.585 | -20.128 |
| △ in sugar(g) | -0.203 | -0.910 | -1.014 | -1.460 | -1.349 | -0.753 | -5.689 |
| △ in fat(g) | -0.103 | -0.445 | -0.553 | -0.695 | -1.148 | -0.703 | -3.647 |
| △ in saturates(g) | -0.041 | -0.192 | -0.223 | -0.294 | -0.426 | -0.217 | -1.393 |
| △ in fibre(g) | -0.011 | -0.046 | -0.070 | -0.155 | -0.582 | -0.431 | -1.295 |
| △ in sodium(g) | -0.001 | -0.004 | -0.005 | -0.010 | -0.058 | -0.045 | -0.123 |
4.35 Figures 48 and 49 show a decrease in energy and nutrients in all the SIMD quintile ranging from a high of 173 (3rd quintile), 133 (4th quintile) and 121 (5th quantile) kcal per capita per week.
4.36 Figure 50 indicates that all the groups are expected to show a reduction on energy. The pattern of reduction is similar for all the nutrients (Figure 51).
4.37 The results by income (Figures 52 and 53) as in the previous cases show a decrease in energy and nutrients.When looking at the effect by household life stage (Figures 54 and 55) it can be seen that all the groups show a decrease in energy and nutrients.
4.4.5 Total puddings and desserts
4.38 Table 21 and Figures 56 to 63 present the results for puddings and desserts. Overall, there is an estimated reduction of 29 kcal per capita per week, which is the smallest reduction across all the 7 sub-categories.
There was evidence of some substitution within the category, with purchases of puddings, canned goods and frozen desserts increasing. Branded chilled convenience foods represented most of the changes in the category (69 per cent of the total energy reduction). This is also reflected in the nutrient effects, where reductions in carbohydrates, sugar and fat being were largest within this sub-category.
| Group | Category | Total | ||||
|---|---|---|---|---|---|---|
| Puddings, canned goods and frozen desserts | Sweet home cooking | Chilled convenience | Products with healthy claims | |||
| Private label | Branded | |||||
| All the sample | ||||||
| △ in share | 0.000 | -0.001 | -0.001 | -0.002 | 0.000 | -0.003 |
| △ in expenditure (£) | 0.008 | -0.015 | -0.016 | -0.051 | -0.010 | -0.083 |
| △ in quantity (Kg) | 0.002 | -0.004 | -0.003 | -0.010 | -0.001 | -0.015 |
| △ in energy (kcal) | 5.485 | -6.860 | -6.504 | -19.973 | -0.926 | -28.778 |
| △ in protein(g) | 0.081 | -0.089 | -0.087 | -0.370 | -0.031 | -0.497 |
| △ in carbohydrate(g) | 0.749 | -1.279 | -0.780 | -2.454 | -0.154 | -3.917 |
| △ in sugar(g) | 0.438 | -0.878 | -0.563 | -1.917 | -0.106 | -3.027 |
| △ in fat(g) | 0.226 | -0.150 | -0.331 | -0.958 | -0.020 | -1.231 |
| △ in saturates(g) | 0.111 | -0.075 | -0.201 | -0.570 | -0.012 | -0.748 |
| △ in fibre(g) | 0.032 | -0.017 | -0.030 | -0.078 | -0.008 | -0.100 |
| △ in sodium(g) | 0.002 | -0.003 | -0.003 | -0.009 | -0.001 | -0.014 |
4.39 Figure 56 shows that all the SIMD quintiles presented a decrease in energy, ranging from 17 (1st quintile) to 42 kcal (3rd quintile). This reduction was also shown for nutrients (Figure 57).
4.40 Figure 58 indicates that all the rural-urban groups showed a decrease in energy. The pattern of reduction was similar for all the nutrients (Figure 59).
4.41 Figure 60 shows that all the income groups presented a decrease in energy. The distribution of the reduction of macro nutrients showed a similar distribution as energy (Figure 61).
4.42 Figure 62 looks at the results by life stage and the results are very similar for all life stages, with energy decreases ranging from 24 to 33 kcal per capita per week. This pattern is similar for all macronutrients (Figure 63).
4.4.6 Regular soft drinks
4.43 Table 22 and Figures 64 to 71 present the results for the soft drinks category. Overall, the category shows a reduction of energy from the policy for all sub-categories with the exception of a very small increase for mineral water. This reduction was mainly achieved through a decrease in sugar levels as the other macronutrients have very low levels in this category. Soft drinks specifically contributed over 60 per cent (-27.9 kcal per week per capita) to the total decrease in energy levels.
| Group | Category | Total | ||||
|---|---|---|---|---|---|---|
| Mineral water | Soft drinks | Juices | Other drinks | Drinks with healthy claims | ||
| All the sample | ||||||
| △ in share | 0.000 | -0.004 | -0.001 | -0.001 | -0.006 | -0.011 |
| △ in expenditure (£) | 0.013 | -0.115 | -0.019 | -0.025 | -0.163 | -0.308 |
| △ in quantity (Lt) | 0.024 | -0.082 | -0.020 | -0.016 | -0.127 | -0.222 |
| △ in energy (kcal) | 0.684 | -27.909 | -7.454 | -5.978 | -4.126 | -44.782 |
| △ in protein(g) | 0.021 | -0.006 | -0.070 | -0.103 | -0.028 | -0.186 |
| △ in carbohydrate(g) | 0.104 | -6.805 | -1.676 | -1.237 | -0.626 | -10.241 |
| △ in sugar(g) | 0.097 | -6.428 | -1.632 | -1.133 | -0.555 | -9.652 |
| △ in fat(g) | 0.012 | -0.002 | -0.008 | -0.041 | -0.009 | -0.049 |
| △ in saturates(g) | 0.002 | -0.001 | -0.001 | -0.023 | -0.006 | -0.029 |
| △ in fibre(g) | 0.004 | -0.018 | -0.042 | -0.043 | -0.025 | -0.123 |
| △ in sodium(g) | 0.000 | -0.004 | -0.007 | -0.003 | -0.014 | -0.028 |
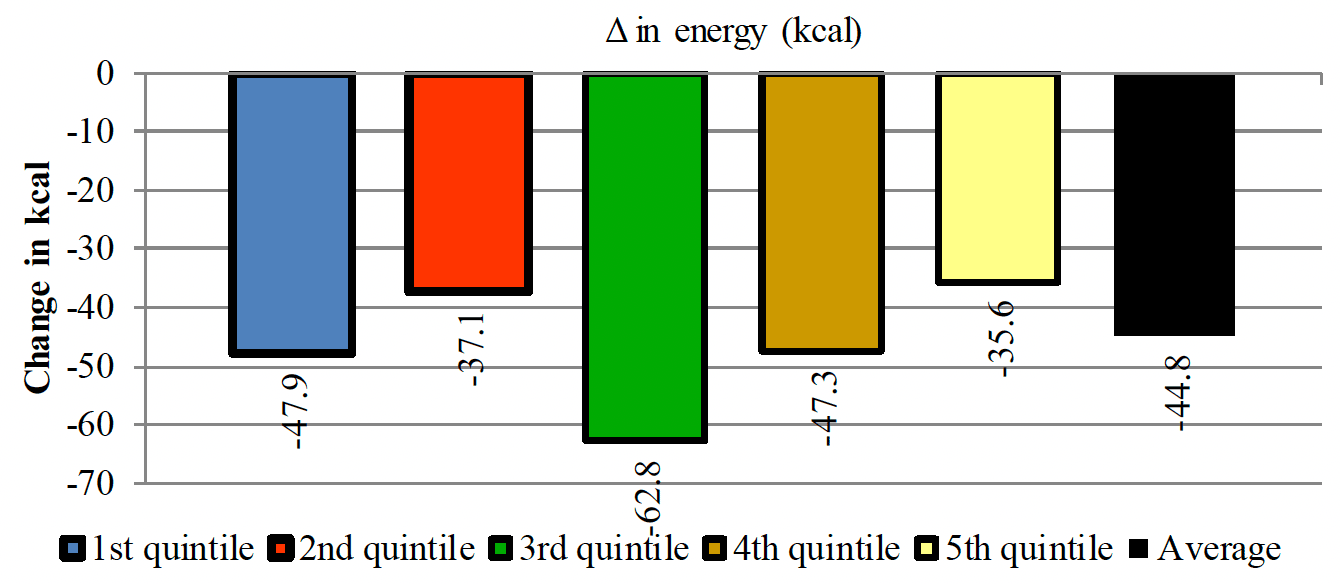
4.44 Figure 64 points out that all the SIMD quintiles show a decrease in energy, ranging from 35.6 (5th quintile) to 62.8 Kcal (3rd quintile). This applies to levels of sugar as well (Figure 65).Figures 67 and 68 show that all the areas show a decrease in terms of energy and sugar.
4.45 In terms of income, as shown in Figure 68 the situation is similar to SIMD, with little variation in the range energy levels decrease (33.9 to 48.8 kcal per capita per week). This is also reflected for sugar (Figure 69).
4.46 The results by life stage (Figures 70 and 71) show that all the groups experience a reduction in the levels of energy and nutrients.
4.4.7 Edible ices and ice cream
4.47 Table 23 and Figures 72 to 79 present the results for edible ices and ice cream. They show an expected reduction in energy levels in most sub-categories with the exceptions of premium ice-cream private label and frozen confectionery, which experienced modest increases. The overall effect, nevertheless, is a decrease in the total level of energy, with Lollies the biggest contributor to that decrease with 40 per cent of the total (-28.0 kcal per capita per week). This is similar for all the macronutrients.
| Group | Category | Total | ||||||
|---|---|---|---|---|---|---|---|---|
| Premium ice cream | Lollies | Other ice creams | Frozen confectionery | |||||
| Private label | Branded | Private label | Branded | Private label | Branded | |||
| All the sample | ||||||||
| △ in share | 0.000 | -0.001 | -0.001 | -0.002 | 0.000 | -0.001 | 0.000 | -0.004 |
| △ in expenditure (£) | 0.001 | -0.026 | -0.017 | -0.061 | -0.005 | -0.017 | 0.002 | -0.123 |
| △ in quantity (Kg) | 0.000 | -0.008 | -0.005 | -0.012 | -0.002 | -0.005 | 0.000 | -0.031 |
| △ in energy (kcal) | 0.670 | -16.197 | -11.910 | -27.958 | -4.048 | -9.700 | 1.201 | -67.942 |
| △ in protein(g) | 0.010 | -0.253 | -0.130 | -0.301 | -0.050 | -0.132 | 0.018 | -0.839 |
| △ in carbohydrate(g) | 0.085 | -1.829 | -1.393 | -3.190 | -0.539 | -1.195 | 0.149 | -7.912 |
| △ in sugar(g) | 0.071 | -1.553 | -1.251 | -2.828 | -0.399 | -0.919 | 0.100 | -6.779 |
| △ in fat(g) | 0.032 | -0.869 | -0.641 | -1.515 | -0.186 | -0.481 | 0.059 | -3.599 |
| △ in saturates(g) | 0.022 | -0.549 | -0.435 | -1.036 | -0.141 | -0.338 | 0.030 | -2.448 |
| △ in fibre(g) | 0.002 | -0.038 | -0.043 | -0.051 | -0.014 | -0.037 | 0.006 | -0.176 |
| △ in sodium(g) | 0.000 | -0.006 | -0.003 | -0.006 | -0.001 | -0.003 | 0.000 | -0.017 |
4.48 The results by SIMD quintile (Figure 72) show a decrease in energy in all of them. This is similar for all nutrients (Figure 73). Figures 74 and 75 show that all the groups present decrease in energy and sugar. Figure 76 shows the results by income group, with similar levels of energy decreases for most groups. This situation is reflected for macro nutrient levels (Figure 77).There is a decrease in the levels of energy for all the groups regardless of their life stage (Figure 78). The situation is the same regarding nutrients (Figure 79).
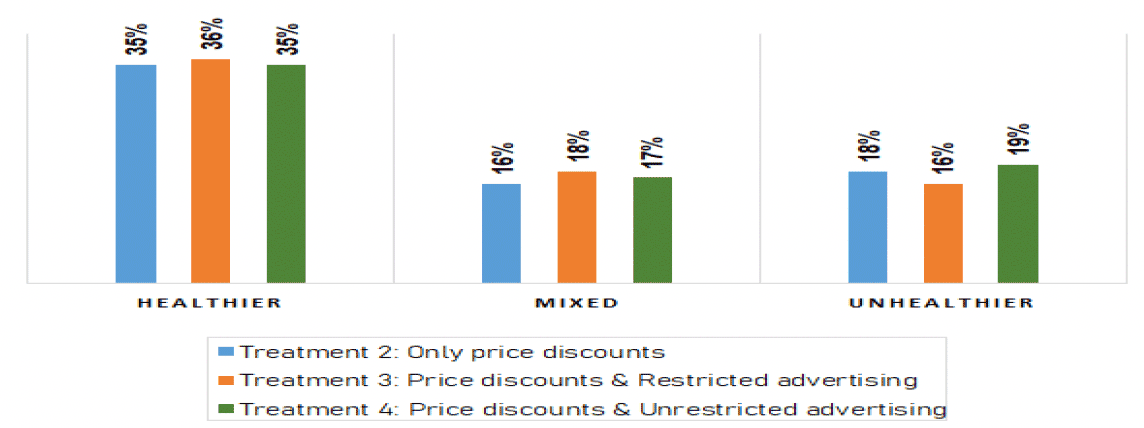
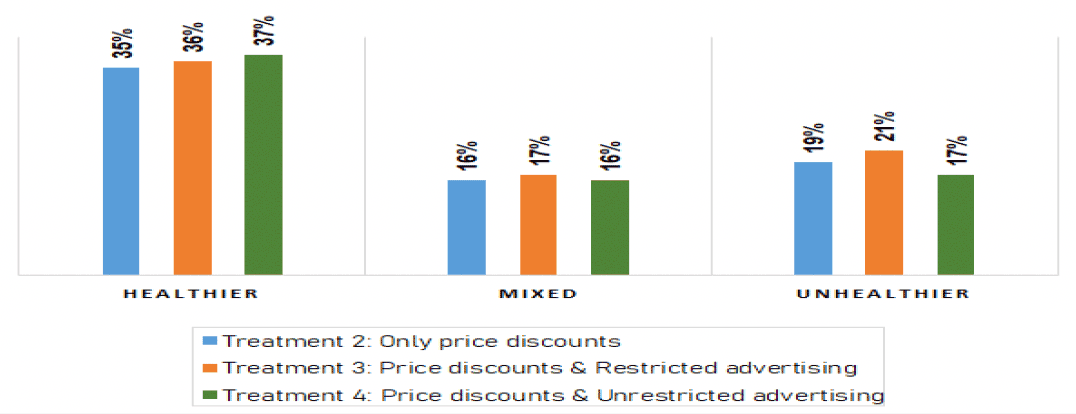
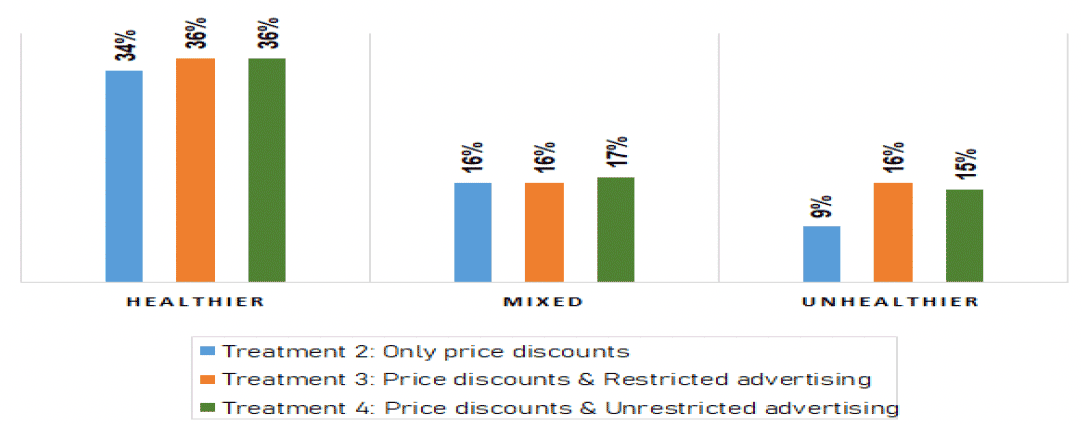
4.5 Choice experiment
4.49 Figures 80-82 present the percentages of chosen chocolates, biscuits, and crisps, respectively. The p-values from the two proportion z-test are shown in Table 24. In the three figures, the percentages of chosen products in treatment 3 (i.e., where the promotions are advertised only if the product has low or moderate content of sugar, fat, and salt) are compared to the percentages in the two baseline treatments (i.e., treatments 2, where the promotions are not advertised, and treatment 4, where the promotions are advertised for all the products).
4.5.1. Effect of restricting the promotion of price discounts on chocolate
4.50 In the case of chocolates, the results displayed in Figure 80 show that restricting the promotion of price discounts (treatment 3) had virtually no influence on respondents' choices: there was a 1% increase in respondents' choices of chocolates classified as healthier or "mixed". For unhealthier chocolates, there was a a reduction of between 2%-3% compared to respondents' choices in the baseline treatments (treatments 2 and 4). The results in Table 24 suggest that the effect of restricting the promotion of the price discounts is not statistically significant. It is noteworthy, that in all the three treatments, respondents chose significantly more healthier chocolates than mixed or unhealthier chocolates.
4.5.2. Effect of restricting the promotion of price discounts on biscuits
4.51 The results displayed in Figure 81 and Table 24 indicate that restricting the promotion of price discounts did not significantly alter respondents' choices of biscuits. The results also show that participants in all the treatments chose significantly more healthier biscuits (66 per cent of all chosen biscuits) than biscuits with a high content of sugar or/and fat (mixed and unhealthier biscuits).
4.5.3. Effect of restricting the promotion of price discounts on crisps
4.52 In line with the results on chocolates and biscuits, respondents' choices of crisps (Figure 82) were found to vary very little across treatments. The largest difference observed, occurring between treatments 2 and 3 (7%) in the case of unhealthier crisps, is statistically insignificant (see Table 24).
| Products | Choices | Treatment 2 vs Treatment 3 | Treatment 2 vs Treatment 4 | Treatment 3 vs Treatment 4 |
|---|---|---|---|---|
| Chocolates | Healthier | 0.46 | 0.80 | 0.62 |
| Mixed | 0.16 | 0.35 | 0.63 | |
| Unhealthier | 0.67 | 0.76 | 0.47 | |
| Biscuits | Healthier | 0.66 | 0.08 | 0.20 |
| Mixed | 0.35 | 0.68 | 0.61 | |
| Unhealthier | 0.68 | 0.70 | 0.42 | |
| Crisps | Healthier | 0.24 | 0.31 | 0.88 |
| Mixed | 0.87 | 0.45 | 0.56 | |
| Unhealthier | 0.09 | 0.16 | 0.77 |
Note: The difference in the number of choices between two treatments is statistically significant if the p-value is equal or lower than 0.05.
4.53 Overall the results show that restricting the advertising of promotions on chocolates, biscuits, and crisps with standard (higher) content of fat, sugar, or salt did not significantly affect respondents' choices. This indicates that the selected panellists were insensitive to changes in the marketing of products.
4.54 The data collected in this study cannot be used to investigate the reasons behind the lack of sensitivity of respondents' choices to changes in how promotions are advertised. Further research work is needed to understand why respondents' choices were not altered when the promotion of price discounts is restricted to chocolates, biscuits, and crisps with lower sugar, fat and salt content. It is possible to suggest that factors such as the importance of nutrition in consumers' food decisions, the role of consumers' purchasing habits (i.e., repetitive/variety-seeking/impulsive purchasing habits), the role that food attributes, other than nutrition, such as taste and brand play in determining consumers' choices, and the degree of respondents' familiarity with the products considered in the study (e.g., chocolates versus energy bars) should be considered in future studies that aim at determining the factors that drive consumers' response to restriction of advertising of food promotions.
4.55 When comparing with the results from the demand analysis, it is important to consider that the choice experiment analysis, due to budget limitations, focused on a very specific product instead of products within a category or the entire food and drink choices.
Contact
Email: DietPolicy@gov.scot