Reducing health harms of foods high in fat, sugar or salt: economic modelling – final report
This project modelled the impact of restricting in-premise all price promotions of discretionary foods on sales and on total calories purchased.
Executive summary
- Having a poor diet and being overweight can have a negative impact on health and wellbeing. To address this public health concern, the Scottish Government published its 'A healthier future: Scotland's diet and healthy weight delivery plan' (SG, 2018), which included a number of actions focusing on children, the food environment, weight management services, leadership to promote healthy weight and diet, and reducing diet-related health inequalities. One of the commitments was to consult on plans to restrict the promotion and marketing of targeted foods high in fat, sugar and salt (HFSS) where they are sold to the public (SG, 2018). An analysis of responses was published in September 2019 (SG, 2019) and subsequently a range of work has been undertaken to inform consideration of legislation and impact assessments.
- The primary aim of the restrictions is to reduce the public health harm associated with the excessive consumption of calories, fat, sugar and salt. The Scottish Government is also looking to the policy to reduce diet-related health inequalities, including in relation to socioeconomic disadvantage.
- By restricting in-store promotion and marketing of discretionary foods, the policy seeks to remove triggers that encourage people to purchase them.
- The Scottish Government consulted on targeting confectionery, sweet biscuits, crisps, savoury snacks, cakes, pastries, puddings, soft drinks with added sugar and possibly ice-cream and dairy desserts. These categories were matched with Kantar categories using information provided by Kantar from their study for Public Health England.
- This project contributes to informing the restrictions policy by providing an ex-ante analysis of the impact of restricting all the in-premise price promotion of discretionary foods on sales. Note that this does not mean that retailers cannot change prices, rather, the analysis considers what might be the effect of no longer allowing the advertisement of promotions. The effects of only restricting multi-buy promotions were estimated separately and provided with the Excel files accompanying this report.
- Due to data availability, specific focus was on estimating the effect of promoting (i.e., advertising) the price/value offer, as opposed to the effect from lowering the price/value without advertising it. In addition, this project also estimated the impact of restricting the price promotion of discretionary food on total calories purchased, taking account of any effects of substituting different discretionary food items and other food and non-food items. The research also examined if there were any differences in impact between different types of households.
- Two complementary methods were performed to model the impact of restricting the advertising of promotions on the discretionary categories: (1) demand analysis and (2) economic choice experiment.
- Two sets of demand models were estimated: first, an inter-category demand model that considered the aggregated discretionary food categories as well as other food and drink categories (i.e., non-discretionary) and a non-food category. This allowed us to measure the substitution from the discretionary food categories to the other food categories. In this way, it was possible to model the potential knock-on effects of the policy measure (i.e., increases in energy, sugar, fat or salt) due to substitution or reallocation of money from discretionary to non-discretionary categories. Second, intra-category demand models, which estimated the effect of the policy for sub-categories within each discretionary food categories. This allowed us to explore the substitution within each discretionary category.
- The data used for these analyses were from the Kantar Worldpanel for Scotland, a dataset where information about grocery purchases for consumption at home are collected from households, i.e., the analysis in this report excludes out of household consumption. According to the most recent information from Defra's Family Food 2017/18 (Defra, 2019), household consumption accounted for 1,737 kcal and out of home consumption 202 kcal.
- The demand analyses were carried out for five socioeconomic groups: (1) the entire sample; (2) by Scottish Index of Multiple Deprivation (SIMD) quintile; (3) by the rural-urban classification group (4) by household income ranges and (5) by life stage group[1].
- The economic choice experiment explored whether there was an effect from advertising a price discount that was over and above that of the impact of the price discount alone. The data were constructed to reflect four advertising options (i.e., treatments). In the first treatment, respondents were shown the full price of chocolates, biscuits and crisps (i.e., the prices were not discounted). In the second treatment, the prices of chocolates, biscuits and crisps were discounted by 50 per cent, but the price discount was not advertised. In the third treatment, the prices of chocolates, biscuits and crisps were discounted by 50 per cent and the price discount was advertised, but only in the case of lower sugar and fat alternatives of chocolates, biscuits, and crisps. In the fourth treatment, the prices of standard and lower sugar and fat alternatives chocolates, biscuits, and crisps were discounted by 50 per cent and the discounts for all were advertised. Respondents were randomly assigned to each one of the treatments (500 respondents per treatment). Z-tests were used to test the statistical significance of the difference in respondents' choices across treatments.
- The choice experiment focused on the advertising of the promotions and made no allowance for businesses not reducing prices as a response to the introduction of promotion restrictions. The experiment was conducted online with 2,000 primary grocery shopper panellists that were representative of the UK population in terms of gender, age, employment status, and across the UK nations. A respondent sample across the UK was chosen rather than one limited to Scotland only in order to ensure a representative sample in the short data collection period that was available.
Results
Demand analysis
The following specific research questions were addressed using demand analysis:
Question 1: Is there a promotion of value effect?
- The results indicate that there is a promotion of value effect amongst all discretionary food categories. Table 1 shows that if this promotion of value is eliminated, the results are decreases in the share of income that is allocated to discretionary foods, together with reductions in expenditure on those categories and on quantities purchased.
| Group | Category | |||||||
|---|---|---|---|---|---|---|---|---|
| Discretionary foods | ||||||||
| Take home confectionery | Biscuits | Take home savouries | Cakes pastries and sugar morning goods | Total puddings and desserts | Take home sugary drinks | Edible ices and ice cream | Total | |
| All the sample | ||||||||
| △ in share | -0.009 | -0.006 | -0.005 | -0.005 | -0.003 | -0.007 | -0.004 | -0.039 |
| △ in expenditure (£) | -0.254 | -0.177 | -0.131 | -0.125 | -0.083 | -0.192 | -0.102 | -1.064 |
| △ in quantity (Kg) | -0.080 | -0.030 | -0.017 | -0.090 | -0.015 | -0.167 | -0.029 | -0.428 |
Question 2: What is the net effect on energy and nutrients?
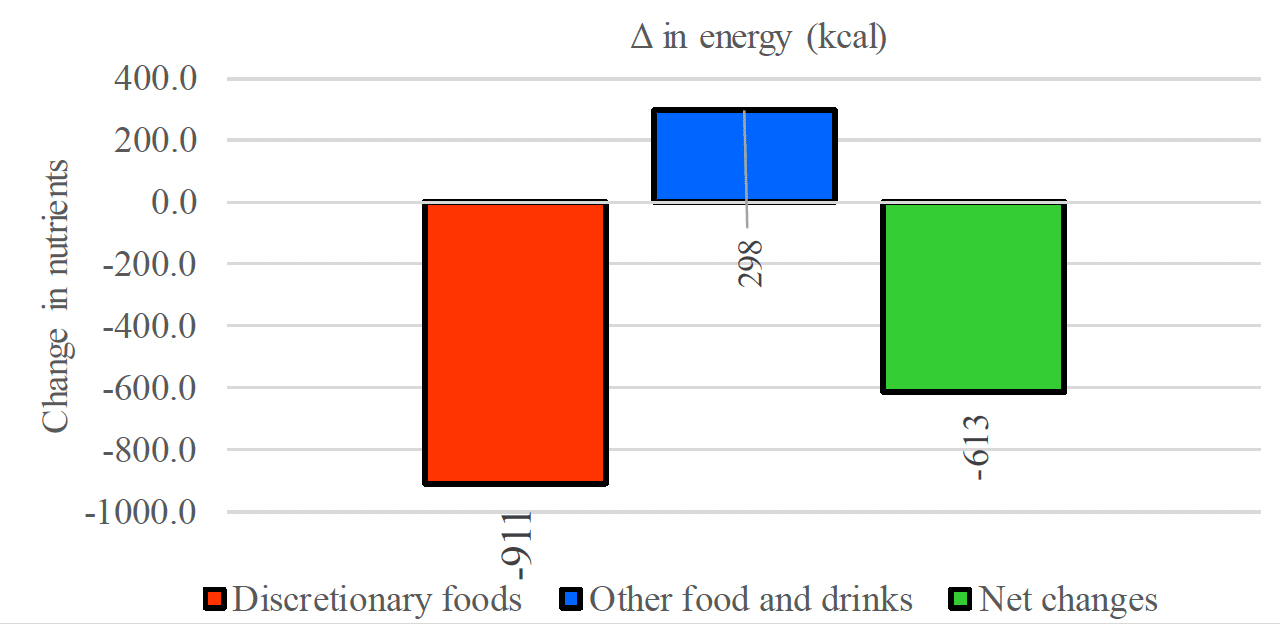
- Figures 1 and 2 present the result of a simulated restriction on the advertising of all promotions on discretionary food products. It was shown to have a net impact (i.e., taking into account any substitution effects) of reducing energy (Figure 1) by 613 kcal per capita per week (i.e., 87.6 kcal per capita per day or 4.4 per cent of a daily diet of 2,000 kcal).
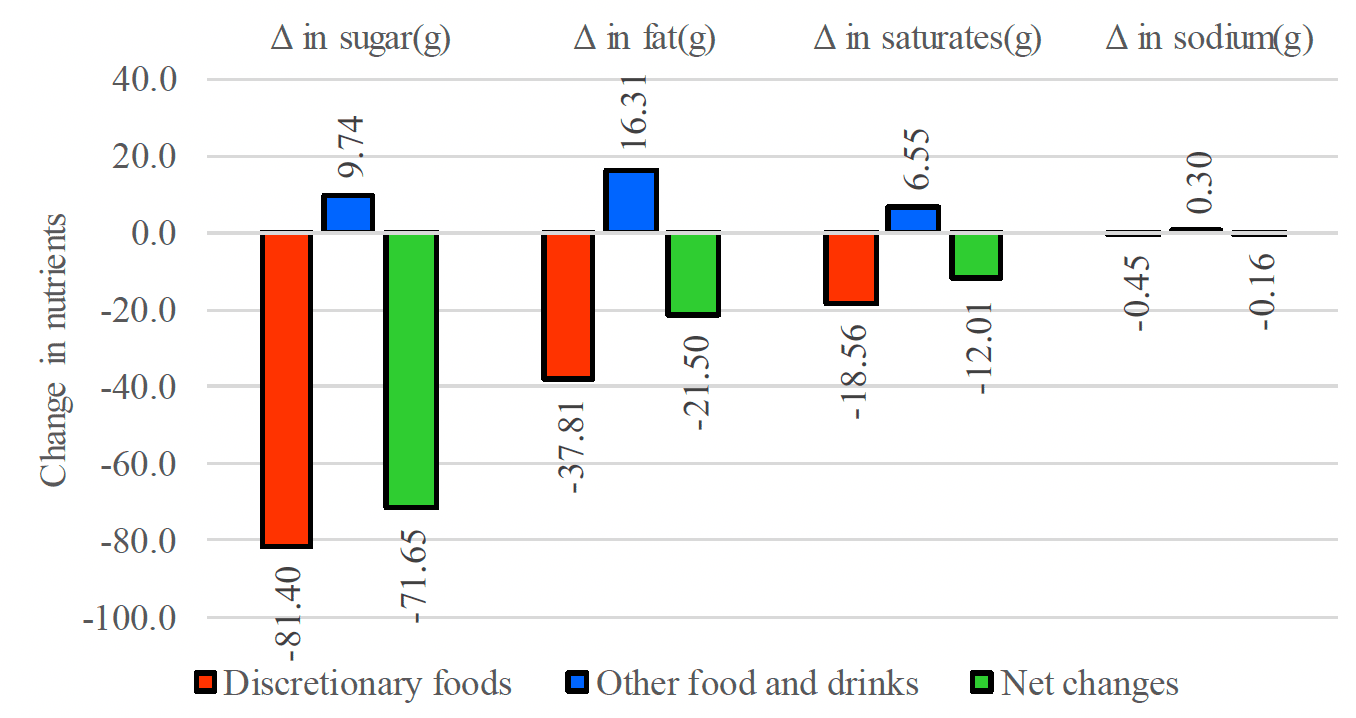
- As shown in Figure 2, all the nutritional categories show similar results, i.e., a reduction, which indicates that the expected impact of a restriction on promotion of value is positive for health in terms of the purchase/consumption of food high in fat, sugar and salt. The reduction in harmful nutrients from discretionary foods is partly compensated by the increase in quantities from non-discretionary food and drinks (i.e., other food and drinks) but these are not enough to offset the reductions in discretionary products purchased.
Question 3: What is the substitution effect towards non-discretionary foods?
- Table 2 provides an estimation of the changes in purchases of non-discretionary food and drink categories, measured in terms of energy and nutrient categories. Almost all of the categories show increases in energy and nutrients except in the case of ready meals, which shows a slight decrease. The highest increases in terms of energy are produced by fats and eggs (96.8 kcal.), which also shows the highest increases in fats (10.4 g.) and saturates (4.2 g.). The highest increases in total sugar come from fruit (3.6 g.) and vegetables (3.0 g.).
Source: Own elaboration based on Kantar Worldpanel data.
Note: Estimates considering the entire sample.
Source: Own elaboration based on Kantar Worldpanel data.
Note: Estimates considering the entire sample.
| Changes in | |||||
|---|---|---|---|---|---|
| Energy | Sugar | Fat | Saturates | Sodium | |
| (kcal) | (g) | (g) | (g) | (g) | |
| Dairy products | 27.4 | 0.81 | 1.93 | 1.23 | 0.040 |
| Meat and fish | 28.0 | 0.10 | 1.51 | 0.57 | 0.069 |
| Fats and eggs | 96.8 | 0.09 | 10.43 | 4.15 | 0.057 |
| Fruit | 24.4 | 3.60 | 0.80 | 0.15 | 0.006 |
| Vegetables | 37.4 | 2.59 | 0.75 | 0.15 | 0.030 |
| Grains | 38.4 | 0.94 | 0.66 | 0.19 | 0.037 |
| Prepared ready foods | -6.5 | -0.12 | -0.31 | -0.09 | -0.014 |
| Sugar and preserves | 7.0 | 0.81 | 0.26 | 0.11 | 0.005 |
| Condiments and sauces | 4.4 | 0.30 | 0.21 | 0.05 | 0.062 |
| Low calorie soft drinks and juices | 1.9 | 0.22 | 0.05 | 0.04 | 0.002 |
| Alcoholic beverages | 38.7 | 0.40 | 0.01 | 0.01 | 0.002 |
| Total | 297.8 | 9.74 | 16.31 | 6.55 | 0.296 |
Source: Own elaboration based on Kantar Worldpanel data.
Note: Estimates considering the entire sample.
Question 4: What is the substitution effect within discretionary foods?
- As regards the results for intra-category analyses (i.e., the substitution of products within the discretionary categories), overall, all categories experienced a decrease in total number of kcal. The total decrease in energy in the take home confectionery (348.8 kcal) was much bigger than in the other categories (85.4 kcal for biscuits, 102.8 kcal for take home savouries, 125.8 kcal ambient cakes and pastries, 28.8 kcal. for total puddings and desserts, 44.8 kcal for regular soft drinks and 67.9 kcal. for edible ices and ice cream).
- There was an increase in some of the sub-categories. Thus, in the take home confectionery category, 'other confectionery' saw an increase in energy, as was also the case for crackers and crispbreads in the biscuits category, 'puddings, canned goods and frozen desserts' in the 'total puddings and desserts' category, 'mineral water' in the 'regular soft drinks' category and edible ices and 'premium ice-cream private label' and 'frozen confectionery' in the 'edible ices and ice cream' category.
- In terms of nutrients, the impact on sugar exceeded that of other nutrients by a considerable margin across the seven discretionary categories. The second largest impact was on fats and saturated fats, with almost no impact on salt. In the 'regular soft drinks' there was only an impact on sugar as this category has very low levels of fat, saturates and salt to start with. Overall, the impact on the different nutrients followed the pattern observed on energy.
- Table 3 summarises the decreases in energy and nutrients within the discretionary categories (i.e., across subcategories). The results show a wide range of decreases between subcategories, which reflect the variety of products within each category. Moreover, the fact that they show reductions in most of the cases is indicative that the effect of promotions tends to fall within a particular category (i.e., the cross effects of promotions is relatively small).
| Changes in | |||||
|---|---|---|---|---|---|
| Energy | Sugar | Fat | Saturates | Sodium | |
| (kcal) | (g) | (g) | (g) | (g) | |
| Discretionary products | |||||
| Take home confectionery | -14.4 to -190.1 | -1.3 to -20.1 | -0.7 to -10.1 | -0.4 to -5.8 | -0.002 to -0.042 |
| Biscuits | -1.1 to -32.4 | -0.1 to -2.8 | -0.1 to -1.5 | -0.03 to -0.9 | -0.001 to -0.016 |
| Take home savouries | -0.03 to -47.8 | -0.02 to -0.30 | -0.02 to -2.27 | -0.02 to -0.26 | -0.003 to -0.063 |
| Cakes, pastries, and sugar morning goods | -2.2 to -50.4 | -0.2 to -1.5 | -0.1 to -1.1 | -0.04 to -0.4 | -0.001 to -0.06 |
| Total puddings and desserts | -0.9 to -20.0 | -0.1 to -1.9 | -0.02 to -1.0 | -0.01 to -0.6 | -0.001 to -0.009 |
| Take home sugary drinks | -4.1 to -27.9 | -0.6 to -6.4 | -0.009 to -0.04 | -0.001 to -0.023 | -0.003 to -0.014 |
| Edible ices and ice creams | -4.1 to -28.0 | -0.4 to -2.8 | -0.5 to -1.5 | -0.1 to -1.0 | -0.001 to -0.006 |
Question 5: What is the substitution effect towards non-discretionary foods for different socioeconomic groups?
- Table 4 shows a summary of the results in terms of net changes in energy and nutrients by different socioeconomic classifications (i.e., SIMD[2], rural-urban, income and life stage).
- Overall, the results indicate that there were decreases in energy and nutrients across different groups of the population, with no group appearing to be adversely affected in terms of showing increases in energy or increases in sugar, fat and saturates intake. The range of net reduction of energy goes from 340 kcal. (in remote rural areas) to 901 kcal. (in remote small towns). The decrease in sugar ranges from 39.7 g. (income above £60,000) to 97.6 g. (in remote small towns). These two groups also provide the limits for fats (5.9 g. to 33.3 g.) and saturated fats (3 g. to 18 g.). In the case of sodium there are four cases that show a slight increase (SIMD 1, accessible small towns, income between £50,000 to £59,999 and middle families); all the other groups show a decrease in sodium.
| Changes in | ||||||
|---|---|---|---|---|---|---|
| Energy | Sugar | Fat | Saturates | Sodium | ||
| (kcal) | (g) | (g) | (g) | (g) | ||
| SIMD | SIMD 1 | -532.2 | -82.2 | -15.4 | -10.2 | 0.112 |
| SIMD 2 | -642.0 | -78.4 | -23.2 | -13.4 | -0.154 | |
| SIMD 3 | -637.0 | -72.4 | -21.8 | -11.9 | -0.234 | |
| SIMD 4 | -580.5 | -60.5 | -23.5 | -12.0 | -0.142 | |
| SIMD 5 | -686.9 | -71.5 | -26.5 | -14.2 | -0.235 | |
| Rural/urban | Lg. Urb. Areas | -682.1 | -77.9 | -24.5 | -14.1 | -0.107 |
| Oth. Urb. Areas | -625.7 | -72.8 | -23.3 | -12.7 | -0.226 | |
| Ac. Sm. Towns | -423.8 | -61.2 | -11.9 | -7.3 | 0.149 | |
| Rm. Sm. Towns | -901.0 | -97.6 | -33.3 | -18.0 | -0.140 | |
| Ac. Rural | -722.2 | -78.3 | -25.8 | -13.8 | -0.255 | |
| Rm. Rural | -340.0 | -45.3 | -6.6 | -5.5 | -0.024 | |
| Income | £0 - £29,999 | -648.3 | -76.5 | -23.5 | -13.6 | -0.161 |
| £30,000 - £39,999 | -768.1 | -84.6 | -28.1 | -15.3 | -0.261 | |
| £40,000 - £49,999 | -547.9 | -60.2 | -17.7 | -8.2 | -0.213 | |
| £50,000 - £59,999 | -596.7 | -76.0 | -19.4 | -9.6 | 0.006 | |
| £60,000 - over | -359.0 | -39.7 | -5.9 | -3.0 | -0.154 | |
| Lifestage | Pre-family | -587.9 | -73.8 | -21.0 | -11.7 | -0.003 |
| Young family | -490.1 | -64.1 | -15.5 | -8.6 | -0.100 | |
| Middle family | -380.1 | -55.3 | -9.0 | -6.4 | 0.104 | |
| Older family | -457.6 | -55.1 | -16.6 | -10.4 | -0.106 | |
| 45+ no children | -695.4 | -74.8 | -25.9 | -14.2 | -0.241 | |
Source: Own elaboration based on Kantar Worldpanel data.
Note: Estimates considering the entire sample.
Results from the economic choice experiment
- Restricting the advertising of promotions on chocolate, biscuits, and crisps with high content of fat, sugar, or salt did not significantly affect consumers' choices.
- Consumers were found to choose significantly more chocolate, biscuits, and crisps containing lower amounts of sugar, fat, and salt than standard products containing higher amounts of sugar, fat, and/or salt, independently of whether a restriction on the advertising of the promotion was imposed or not.
Overall conclusions
- The demand analyses results indicate that a policy to restrict all price promotions of discretionary foods would result in a net change of -613 kcal per capita per week (i.e., -87.6 kcal per capita per day or 4.4 per cent of a daily diet of 2,000 kcal) taking account of substitution of different items within food category and between food categories.
- All the nutritional categories showed similar results (calories, sugar, fat, salt), which indicates that the impact of promotion restrictions could be positive in terms of the purchase/consumption of foods high in fat, sugar and salt. The reduction in nutrients was only partially compensated by the increase in quantities in non-discretionary food and drinks (i.e., other food and drinks).
- The results from the choice experiment showed that restricting the advertising of promotions for chocolates, biscuits, and crisps did not significantly affect respondents' choices. However, when comparing with the results from the demand analysis, it is important to consider that the choice experiment analysis focused on very specific products instead of products within a category, and neither was it possible to consider the entire range of food and drink choices available to consumers.
- The overall results are aggregated across all price promotions and could be viewed as an upper bound on the overall actual impacts that could follow from an introduction of promotion restrictions for discretionary foods, as they are dependent on the types of promotions included in the package of restrictions, as well as other factors, such as future changes in consumer purchasing decisions and retailer behaviour.
Contact
Email: DietPolicy@gov.scot