Coronavirus (COVID-19) vaccine certification: evidence paper update
This paper summarises the range of evidence available on vaccination certification schemes. Evidence is drawn from clinical and scientific literature, from public opinion and from international experience.
3. The current state of the epidemic.
3.1 Cases, hospitalisations and deaths
In late August 2021, COVID-19 cases reached a higher peak than the last wave of cases in July 2021. Cases then declined and remained relatively stable throughout October but have started increasing in early November, and remain high across most local authorities[1]. Case rates are lower in fully vaccinated individuals, than unvaccinated and partially vaccinated individuals (Figure 1).
Cases remained broadly stable at around 2,500 new cases a day on average throughout October, but we have seen a gradual increase in cases over the past two weeks (ending 14 November) which are now at around 3,000 new cases a day. In the latest week (ending 14 November) cases increased across all age groups under 60, but fell for those 60+.
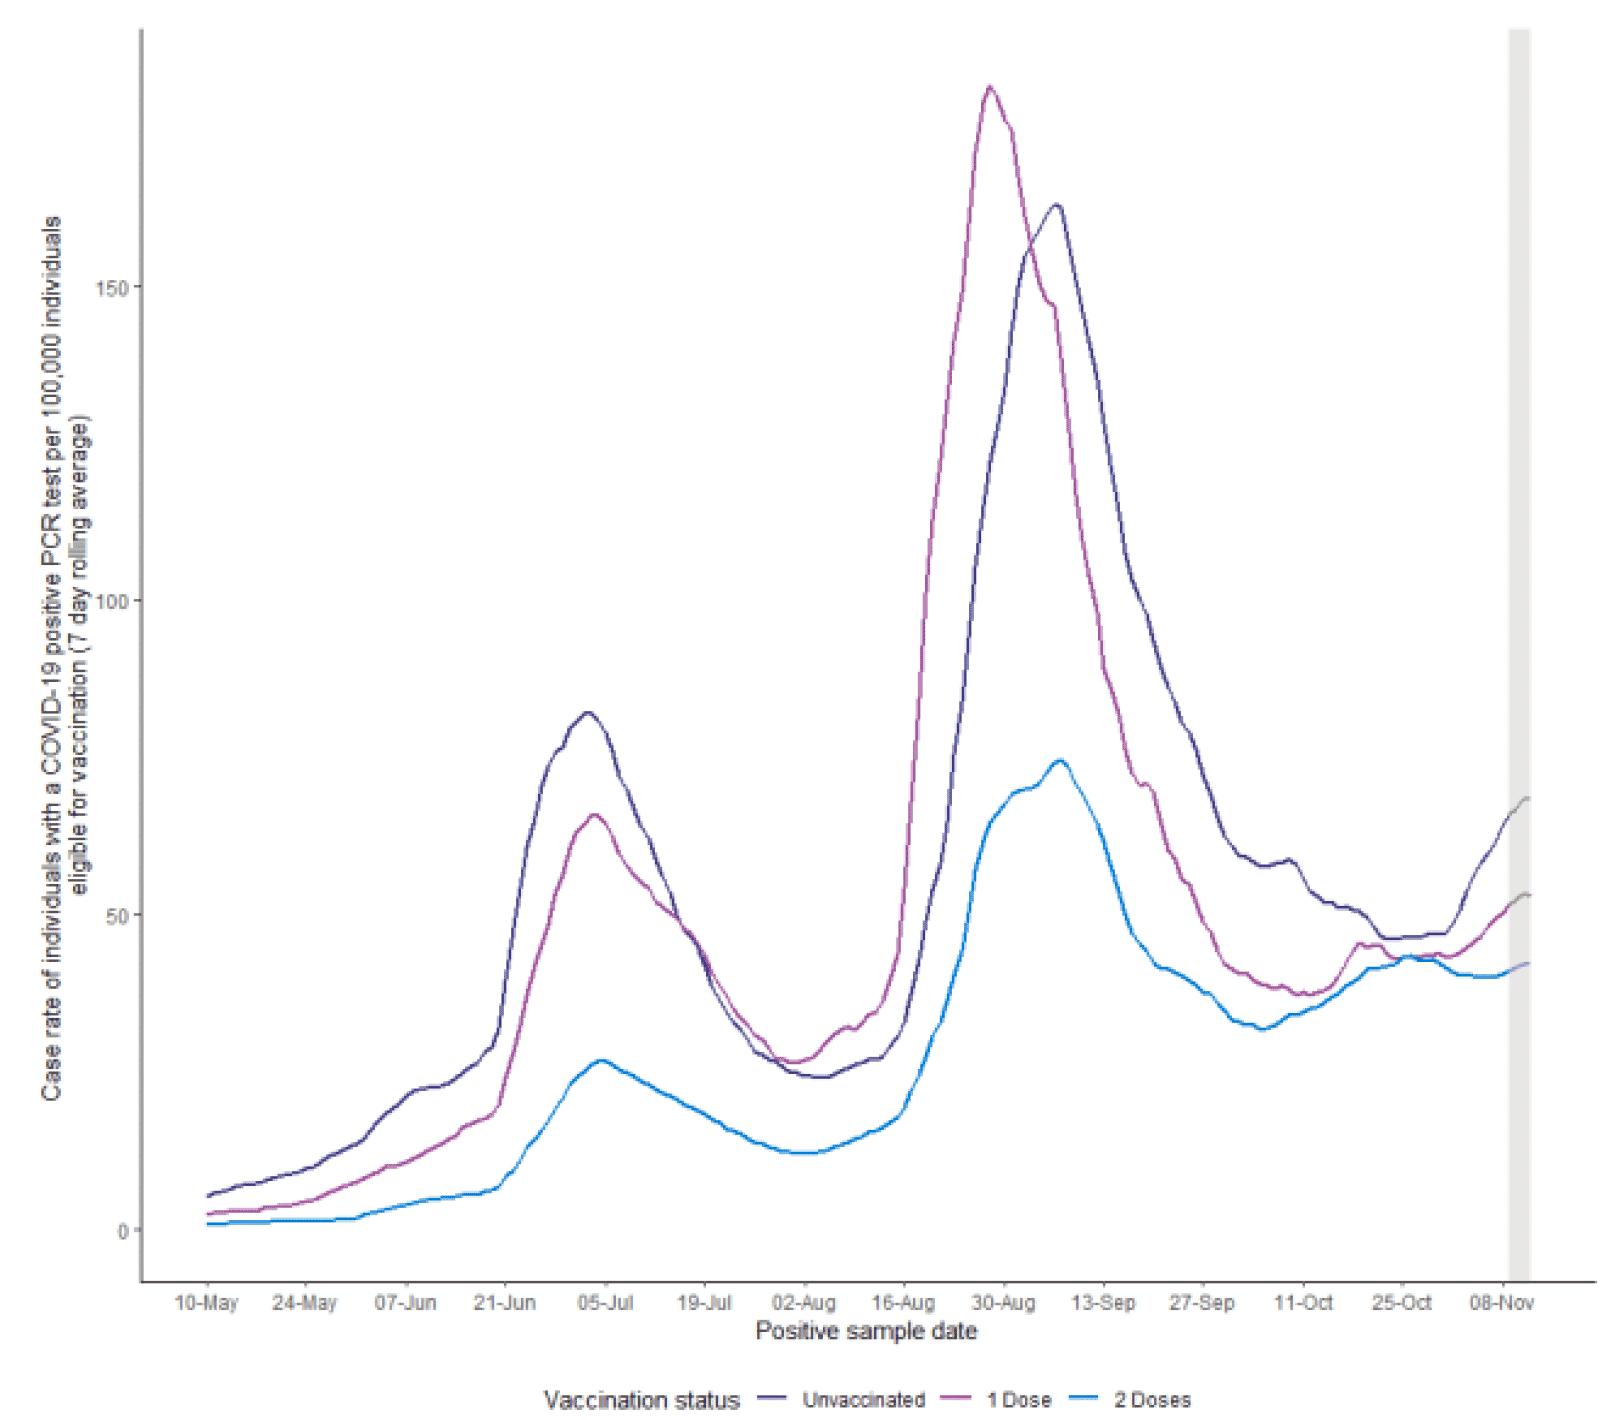
Note: Vaccination status is determined as at the date of PCR specimen date. The data displayed within the greyed-out section (3 days) are considered preliminary and are subject to change as more data is updated.
Source: Public Health Scotland - Scotland COVID-19 Statistical Report
COVID-19 related acute hospital admissions fluctuated over the past month but started to decrease[2]. Hospitalisation rates are higher among unvaccinated individuals (Figure 2).
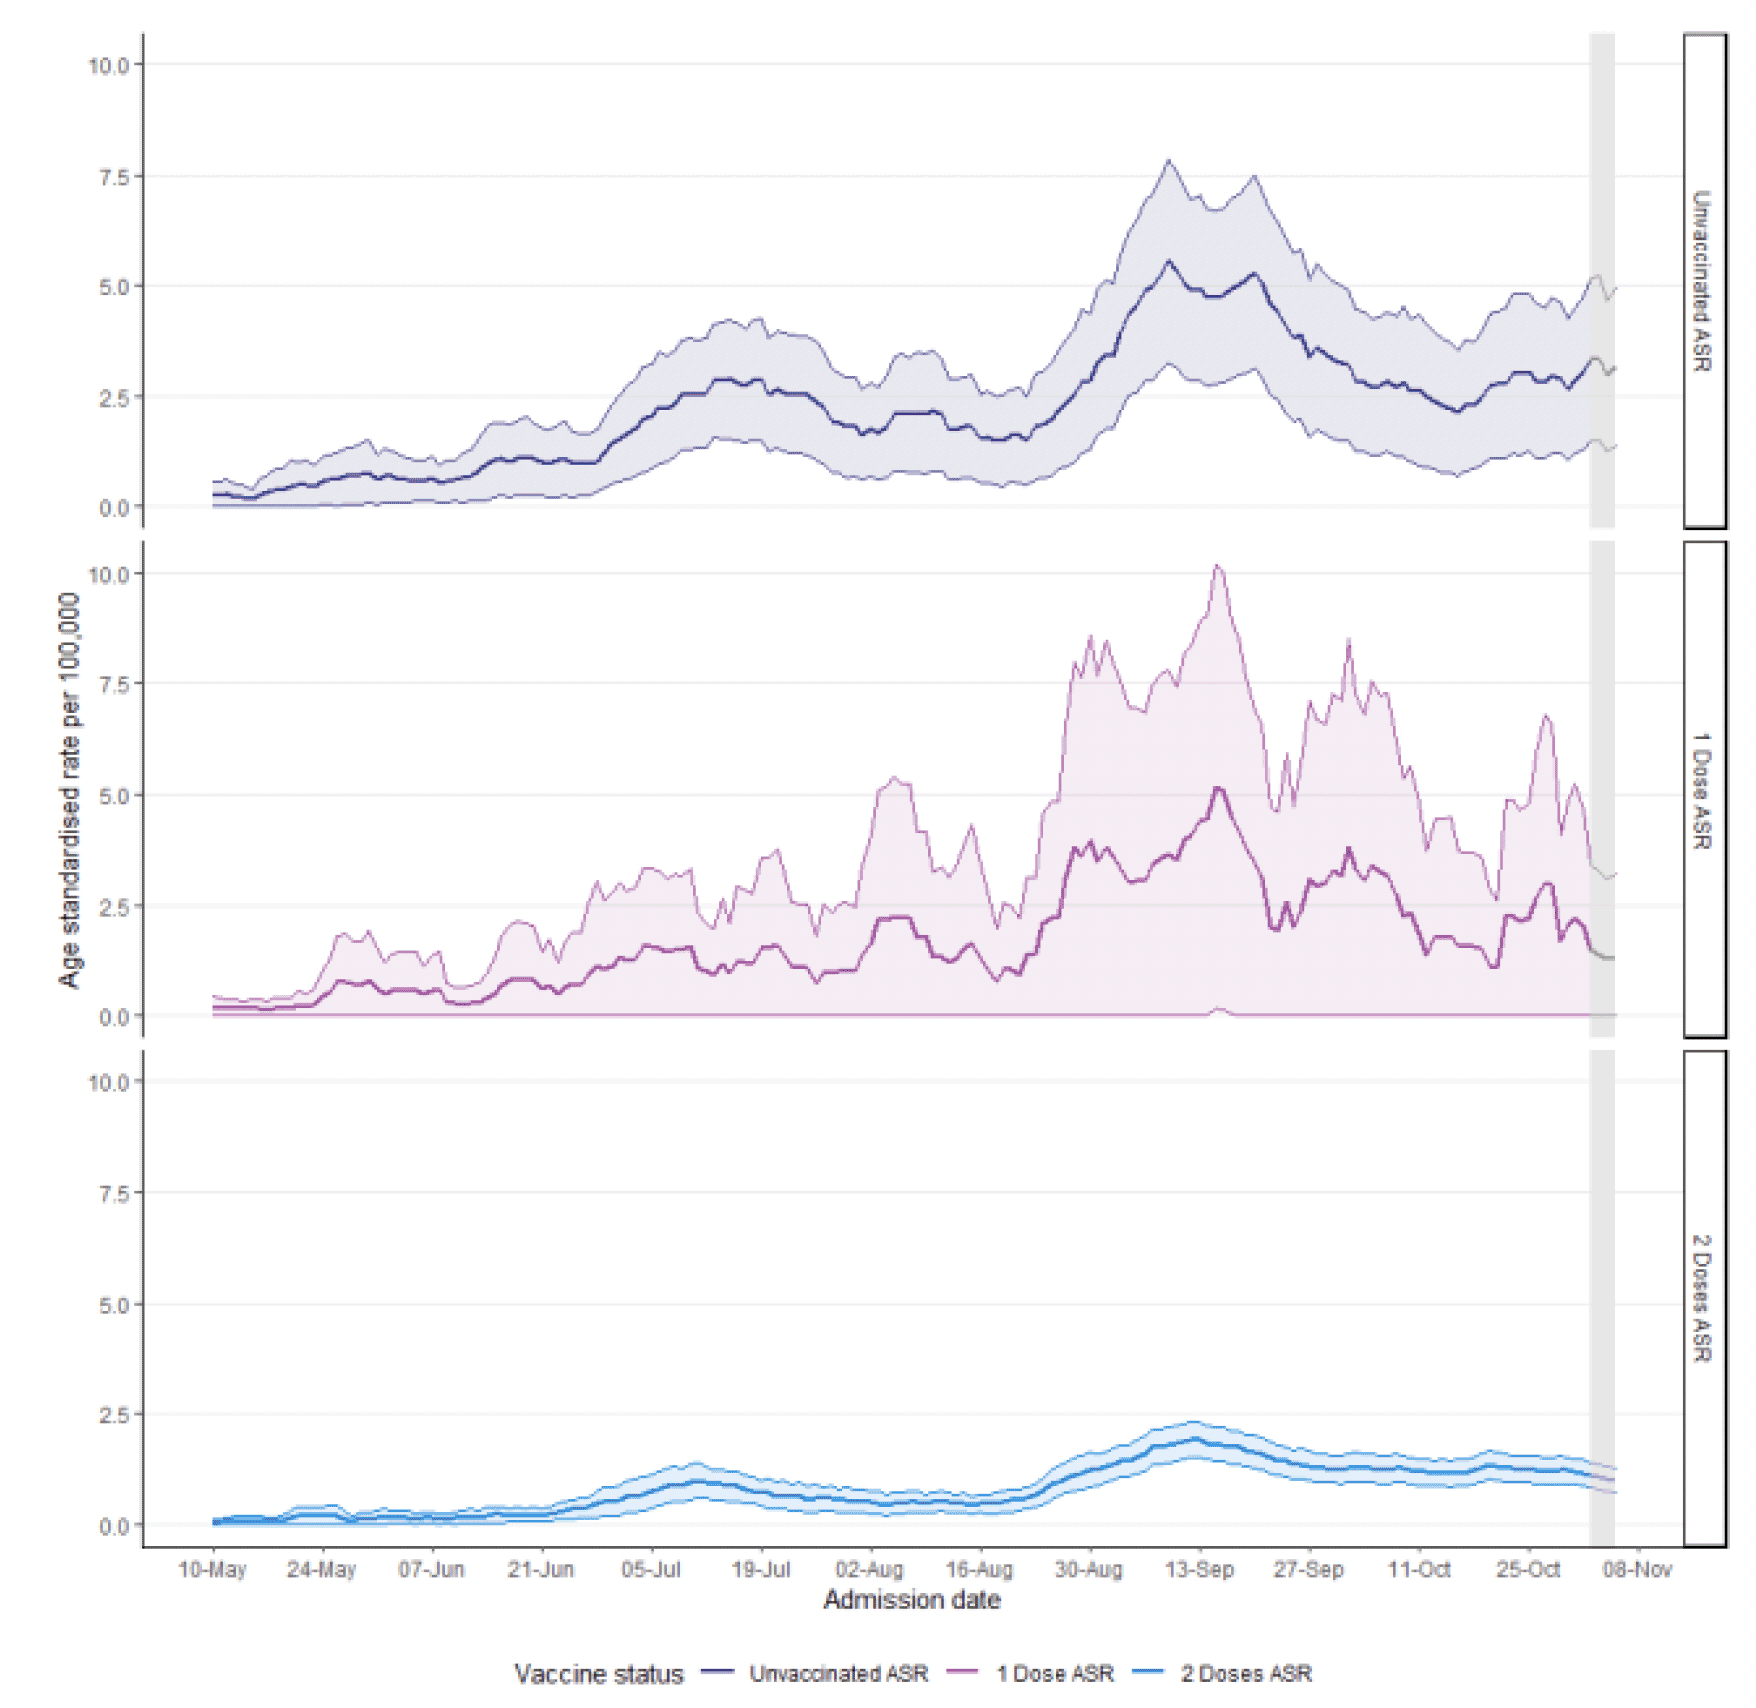
Note: Vaccination status is determined as at the date of positive PCR test. The data displayed within the greyed-out section (1 week) are considered preliminary and are subject to change as more data is updated. 95% confidence intervals are shown as the shaded regions. Age-standardised hospitalisation rates are per 100,000 people per week, standardised to the 2013 European Standard Population.
Source: Public Health Scotland COVID-19 Statistical Report 22 September 2021
Of those individuals that have been fully vaccinated, from 29 December 2020 to 5 November 2021, 0.034% have died with COVID-19 recorded as an underlying or contributory cause of death[3].More information on the current situation as of 12th November in Scotland can be found in the Coronavirus (COVID-19) state of the epidemic 12 November 2021 - gov.scot (www.gov.scot) which is updated and published on a weekly basis[4].
3.2 Forecasts for the medium term
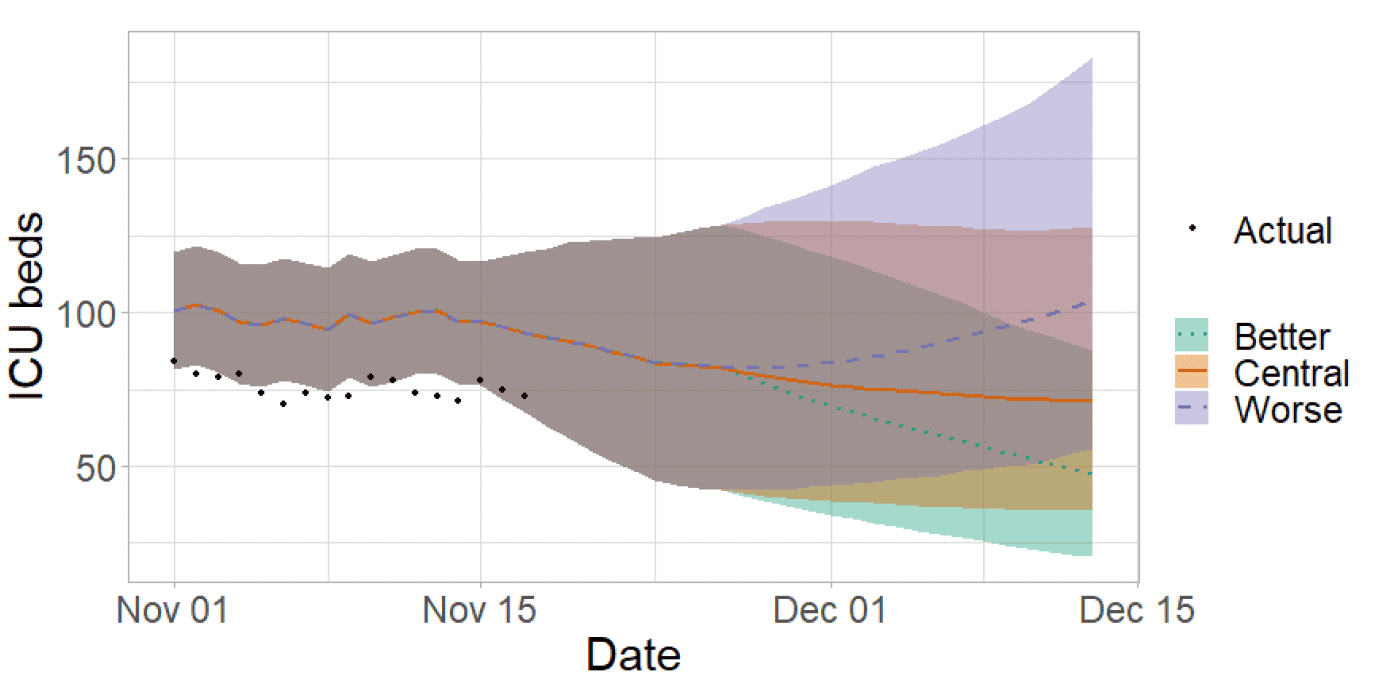
Predictions of the impact of Covid-19 on the NHS in terms of estimated number of infections, hospitalisations and ICU over the coming weeks are modelled by Scottish Government analysts (Figures 3, 4 & 5) and show three projections over the four weeks to 13th December.
'Central' assumes that infections will rise or plateau at the current level, resulting from a small rise in transmission. 'Worse' assumes a larger rise in transmission from the current level. 'Better' assumes a small drop in transmission[5].
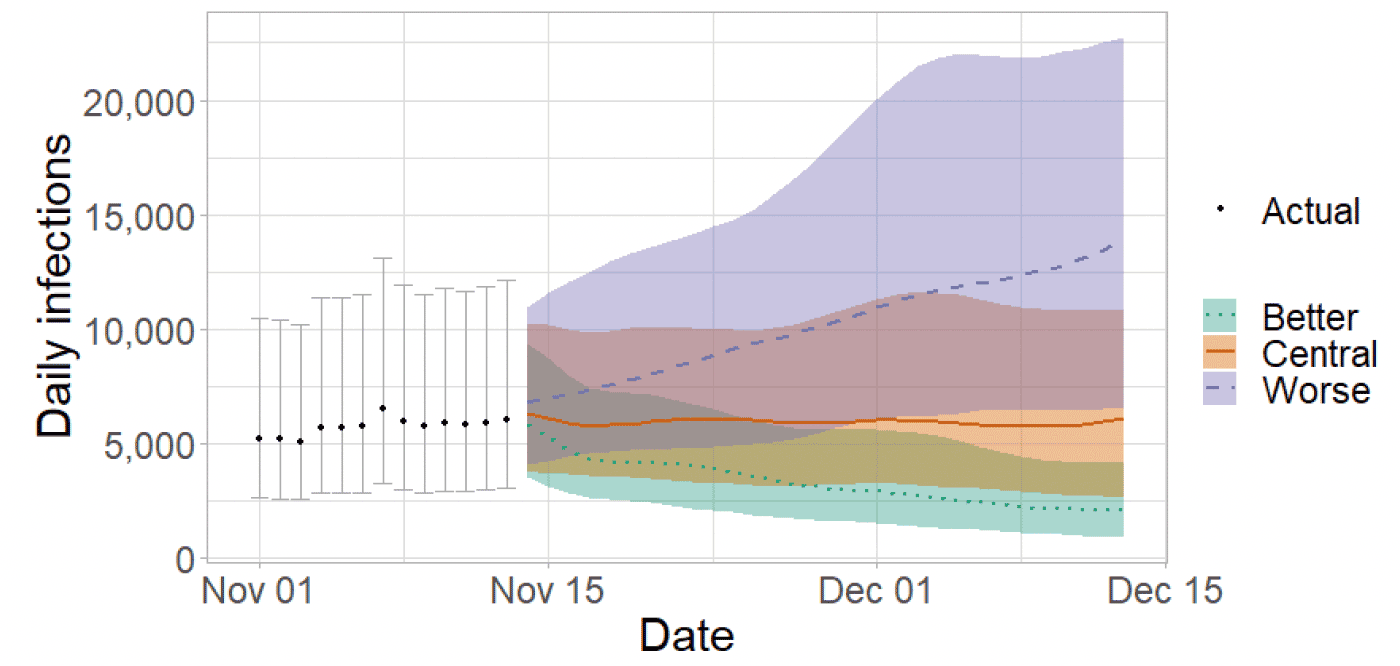
Source : Coronavirus (COVID-19): modelling the epidemic (issue no. 78) - gov.scot (www.gov.scot)
Figure 4 shows the impact of the projections on the number of people in hospital. The modelling includes all hospital stays, whereas the actuals only include stays up to 28 days duration that are linked to Covid-19. Hospital and ICU occupancies have plateaued. There continues to be uncertainty over hospital occupancy and intensive care in the next four weeks.
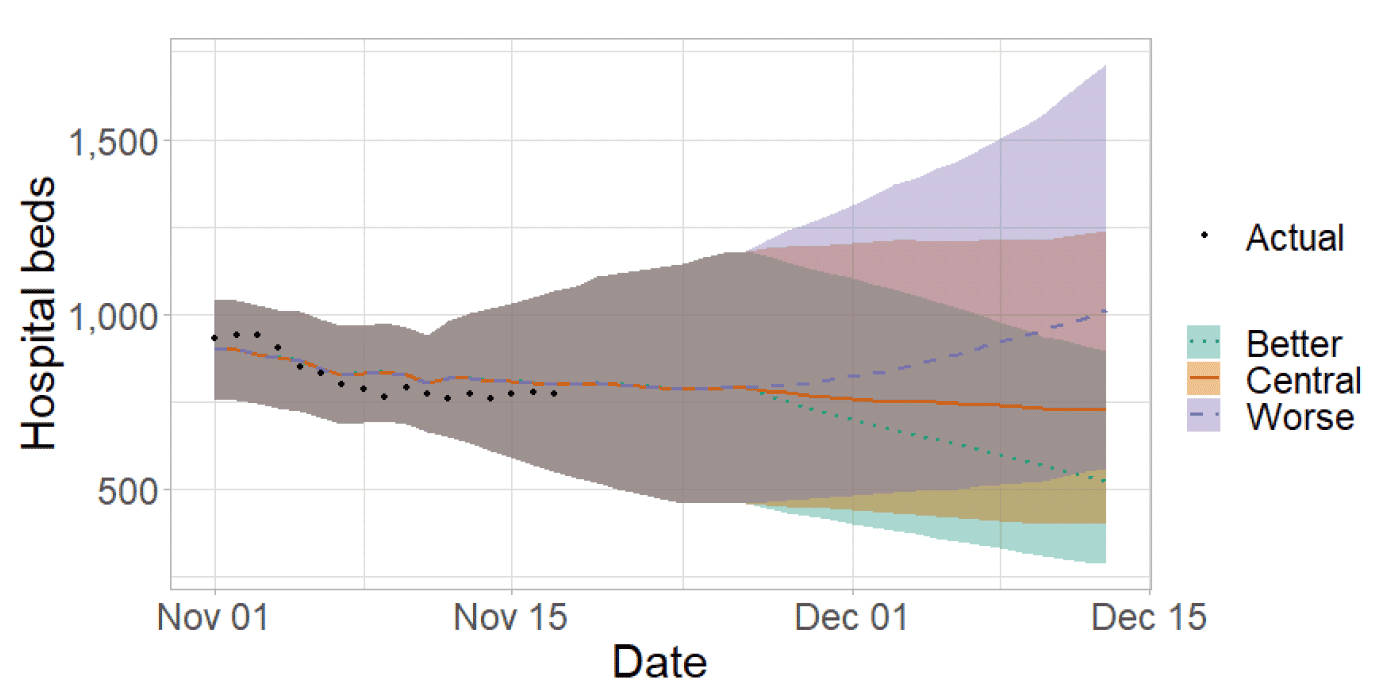
Source: Coronavirus (COVID-19): modelling the epidemic (issue no. 78) - gov.scot (www.gov.scot)
Source: Coronavirus (COVID-19): modelling the epidemic (issue no. 78) - gov.scot (www.gov.scot)
More information on the Scottish Government modelling can be found in the Coronavirus (COVID-19): modelling the epidemic in Scotland report which is updated and published on a weekly basis[8].
What the above predictions tell us is that there is still a degree of uncertainty about the future.
3.3 Vaccination progress
Vaccine uptake has progressed extremely well in the Scottish adult population with approximately 79% of 18 to 29 year olds and 77% of 16 to 17 year olds having received the first dose of the vaccine. Around 96% of people aged 40 and over have received two doses [9] [10], see Figure 6. This puts Scotland in a different position to a number of other countries where vaccination rates were much lower when certification was introduced.
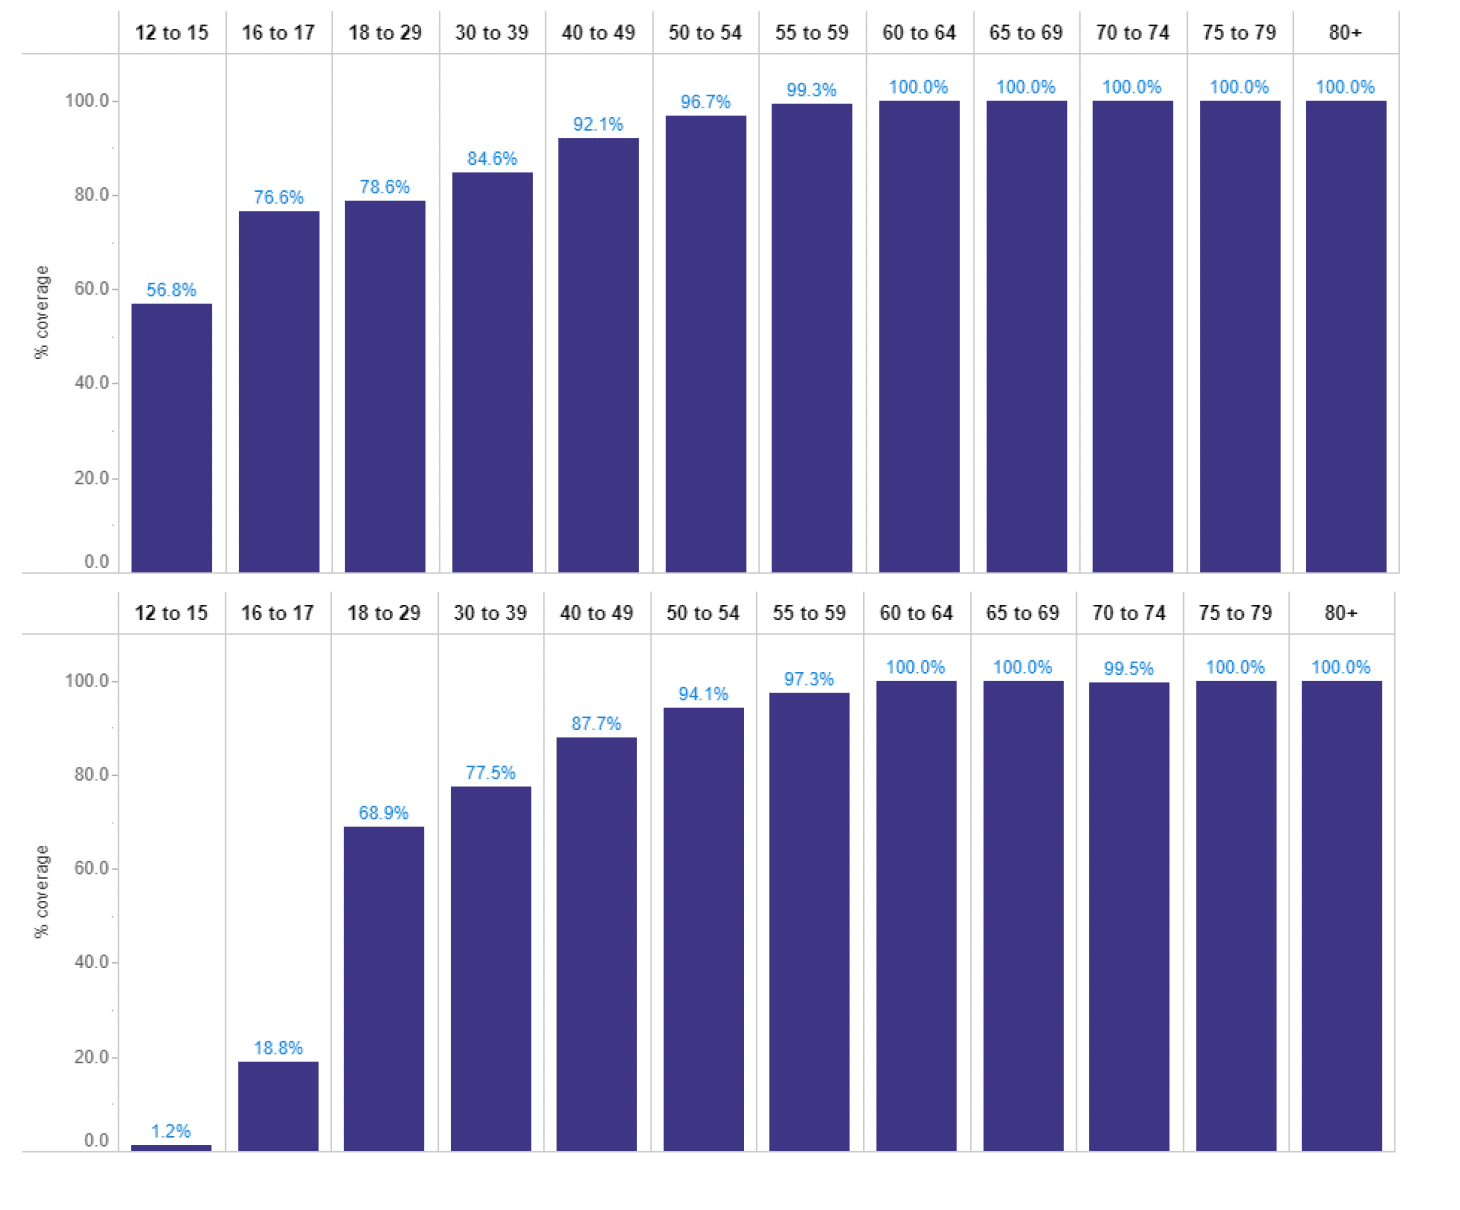
Source: COVID-19 Daily Dashboard | Tableau Public. Updated 17 November 2021, data related to 16 November
Projections of vaccination activity over the coming weeks in combination with estimated cohort sizes suggests a first dose coverage of the 16-40 year old population of around 81.5% and a second dose coverage of around 69.2% by early December. For over 40 year olds first and second dose coverage is projected to be around 98.4% and 97.1% respectively by early December.
3.4 The impact on the Health service
The COVID-19 pandemic is having an impact on health and social care in Scotland in a number of ways. Demand continues to be very significant, with general demand mirroring levels experienced during pre-Covid-19 winter months. However, it is important to note that the NHS and social care system is responding to these pressures within an environment constrained by Covid-19 and with sustained level of Covid-19 cases and occupancies. Pressures are driven in part by society returning to more normality and patients feeling more comfortable to use health and care services again as well as a significant level of acute and ICU capacity re-directed to caring for Covid-19 cases.
Urgent care, in terms of A&E and acute beds, has been the subject of significant pressures over many months. This is likely to be driven, at least in part, by Covid-19 cases and delayed discharges but also may reflect that patients with higher acuity are now attending A&E, requiring admission. In December 2020, when there were around 1,000 COVID patients in hospital, there were around 19,000 A&E attendances per week; now A&E attendances are around 24,000 per week. From the summer of 2021, performance against the A&E four hour standard has dropped below 80% and has remained at this rate for a prolonged period of time. During week ending 31 October 2021, 71.4% of attendances at A&E services were seen and resulted in a subsequent admission, transfer or discharge within 4 hours[11].
Hospitals are currently at, or very close to, capacity and have been in this position for many weeks now with several Health Boards operating within an environment of unprecedented pressure and heightened risk plus a requirement for military support. This affects how people are using those services, and how this impacts on health, demonstrated by the fact that there is a growing backlog in care developing. Since the onset of the pandemic (April 20-June 21), 46.8% fewer elective inpatient and day case patients have been seen compared to pre-pandemic (April 18-June 19); this represents approximately 164,000 patients in total. For the quarter ending June 2021, inpatient and day case activity was at 72.8% of pre-Covid levels (June 2019) and in the quarter ending June 2020 activity was at 20.7% of pre-Covid levels (June 2019)[12]. Statistics for the period up to the of end September 2021 will be published on 30 November 2021.
As we prepare for winter, our primary and secondary health and social care services are facing arguably the most significant and increasing pressures and demands in the history of the NHS. Whilst the number of people in hospital with recently confirmed COVID-19 has decreased from the recent high in mid-September, it remains stubbornly high and the future trend is uncertain. The rapid rise in Covid-19 cases and hospitalisations in Scotland between late August and early September justified the need to take action to reduce transmission in high risk settings in order to reduce the risk of serious illness and death and alleviate pressures on the NHS.
There is uncertainty as to how much Covid-19 infections will increase or decrease in coming weeks. As we move into the traditionally challenging winter months, Hospital and ICU Covid-19 occupancies appear to be plateauing but the scale of any future change in hospital occupancy and intensive care use is highly uncertain, and depends on the number of infections[13] and the success of the booster programme.