Coronavirus (COVID-19): state of the epidemic - 11 February 2022
This report brings together the different sources of evidence and data about the Covid epidemic to summarise the current situation, why we are at that place, and what is likely to happen next.
Situation by Local Authority within Scotland
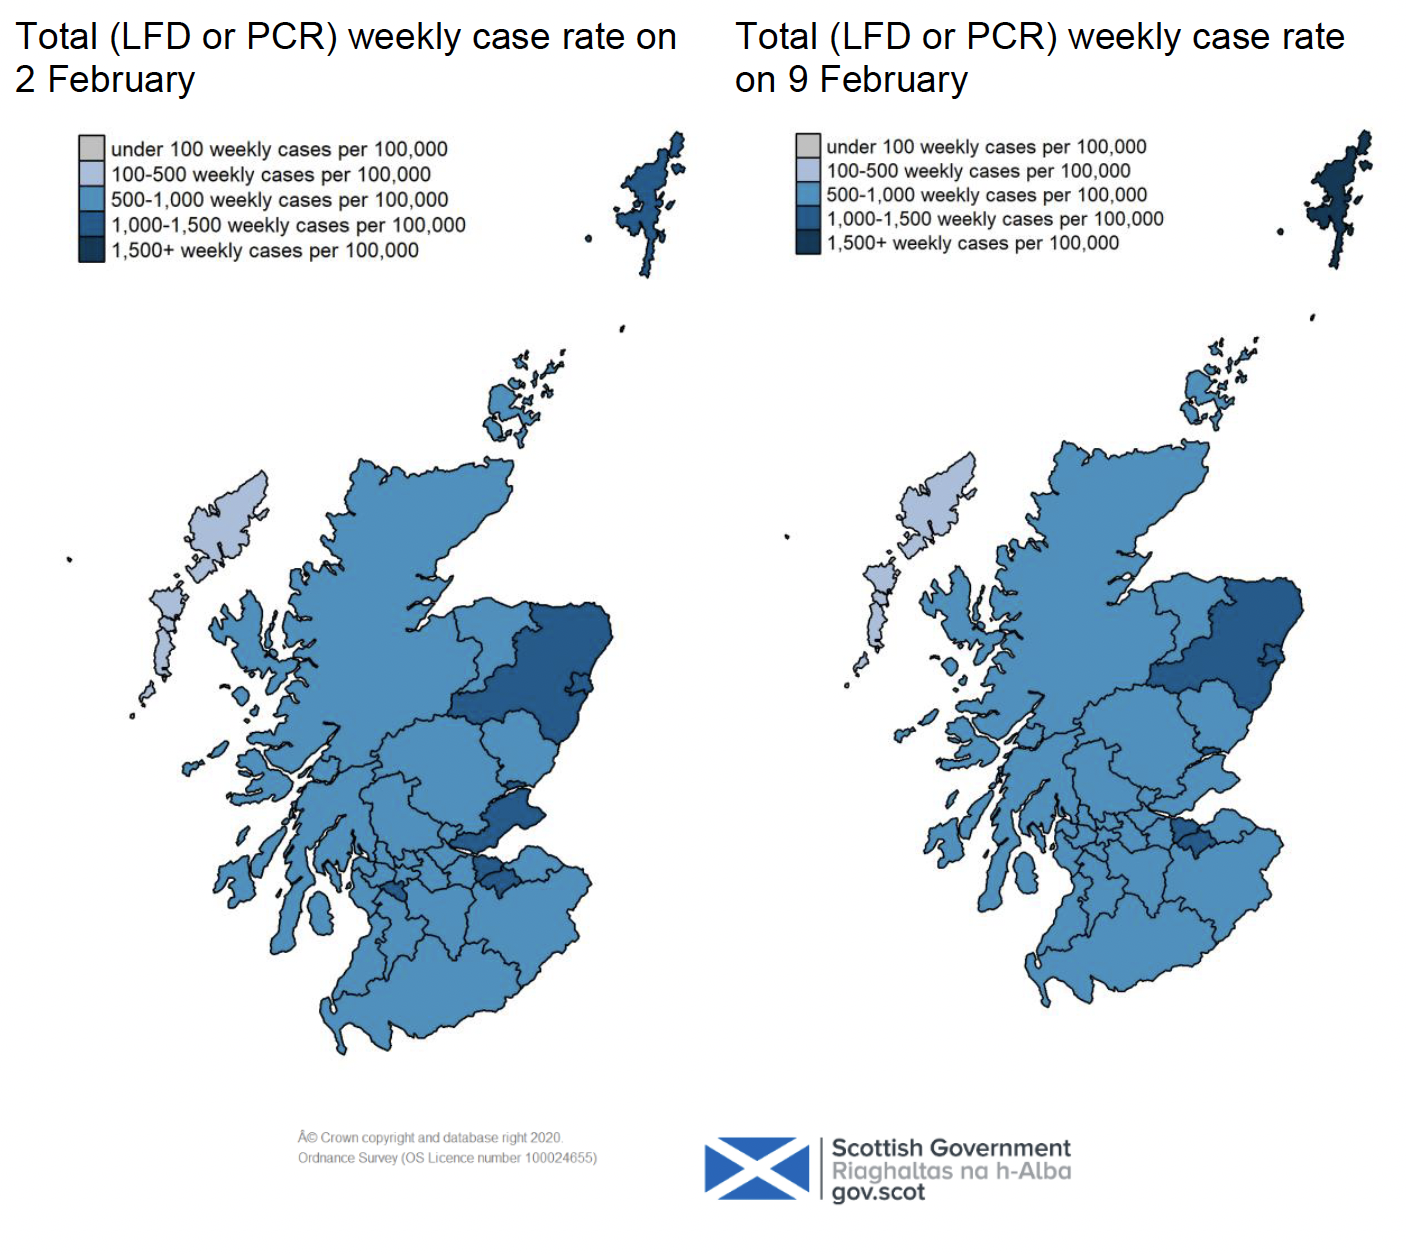
Please note that the methodology for comparing case rates between local authorities has changed following the testing policy changes announced on 5 January 2022. Previously this section presented a weekly PCR case rate per 100,000 population by specimen date. This has changed to a total weekly case rate based on either only PCR, only LFD or a combined PCR and LFD case rate per 100,000 by reporting date. This means that the results presented in this section are not comparable to previous State of the Epidemic Report publications.
In the week leading up to 9 February 2022, Shetland Islands had the highest combined PCR and LFD weekly case rate by reporting date, reporting 1,810 cases per 100,000 population. Na h-Eileanan Siar had the lowest weekly combined LFD and PCR case rate in the same time period, reporting 374 cases per 100,000. The total combined LFD and PCR weekly case rates by reporting date per 100,000 had increased in 9 local authorities in the week leading up to 9 February 2022 compared with the weekly case rate leading up to 2 February 2022, while 22 local authorities saw a decrease in the same period (Figure 11)[56].
Please note that the following local authority hotspot modelling uses data to 7 February 2022 from several academic groups to give an indication of whether a local authority is likely to experience high levels of Covid-19. This has been compiled via UKHSA into a consensus. The modelled weekly case rate below is not directly comparable to the weekly case rate reported in the section and figure above.
This has not been compiled via UKHSA into a consensus this week and is based on one modelling group due to issues with some of the models converging. Some of the models contributing to this analysis are informed by both PCR and LFD positive tests whilst others are currently informed by PCR only.
Modelled rates of positive tests per 100,000 using data to 7 February indicate that, for the week commencing 20 February 2022, 29 of the 32 local authorities are expected to exceed 50 cases per 100,000 with at least 75% probability. The exceptions are Na h-Eileanan Siar, Orkney Islands and Shetland Islands.
28 local authorities are expected to exceed 100 cases per 100,000, with at least 75% probability. The exceptions are South Ayrshire, Na h-Eileanan Siar, Orkney Islands and Shetland Islands.
Four local authorities are expected to exceed 300 cases per 100,000, with at least 75% probability. These are Aberdeen, Edinburgh, Dundee and Midlothian. Only one local authority, Dundee, is expected to exceed 500 cases per 100,000, with at least 75% probability[57].