Coronavirus (COVID-19): state of the epidemic - 11 February 2022
This report brings together the different sources of evidence and data about the Covid epidemic to summarise the current situation, why we are at that place, and what is likely to happen next.
Severe Illness: Hospitalisation, ICU and Deaths
Hospital and ICU Occupancy and Admissions
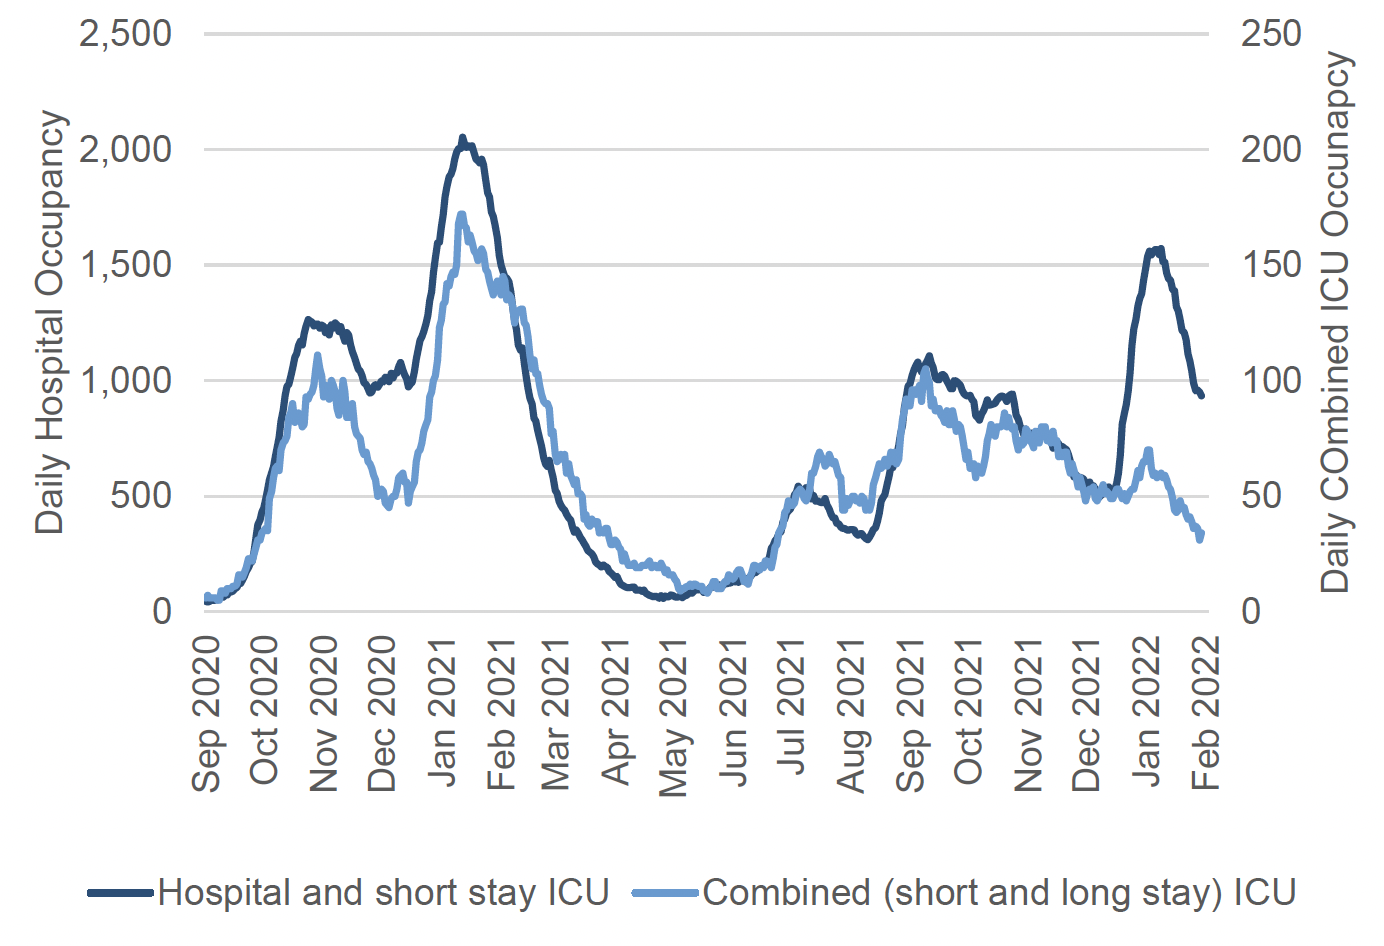
In the week to and including 9 February, daily Covid-19 hospital occupancy continued to decrease. NHS boards reported 934 patients in hospital including short stay ICU on 9 February with recently confirmed Covid-19, compared to 1,116 on 2 February. This is a decrease of 182 patients, or 16%, from a week previously, and compares with 2,053 patients in hospital at the peak in January 2021 (Figure 8).
Combined ICU occupancy (including short and long stay) has decreased to 34 patients on 9 February, a decrease of 6 patients or 15% compared to 2 February. The number of combined ICU occupancy remains lower than the peak of 172 ICU patients recorded in January 2021. There was a 25% decrease in the daily number of patients in short stay ICU (for 28 days or less), while the number of long stay ICU patients (more than 28 days) has continued to plateau in the week leading up to 9 February (Figure 8)[34].
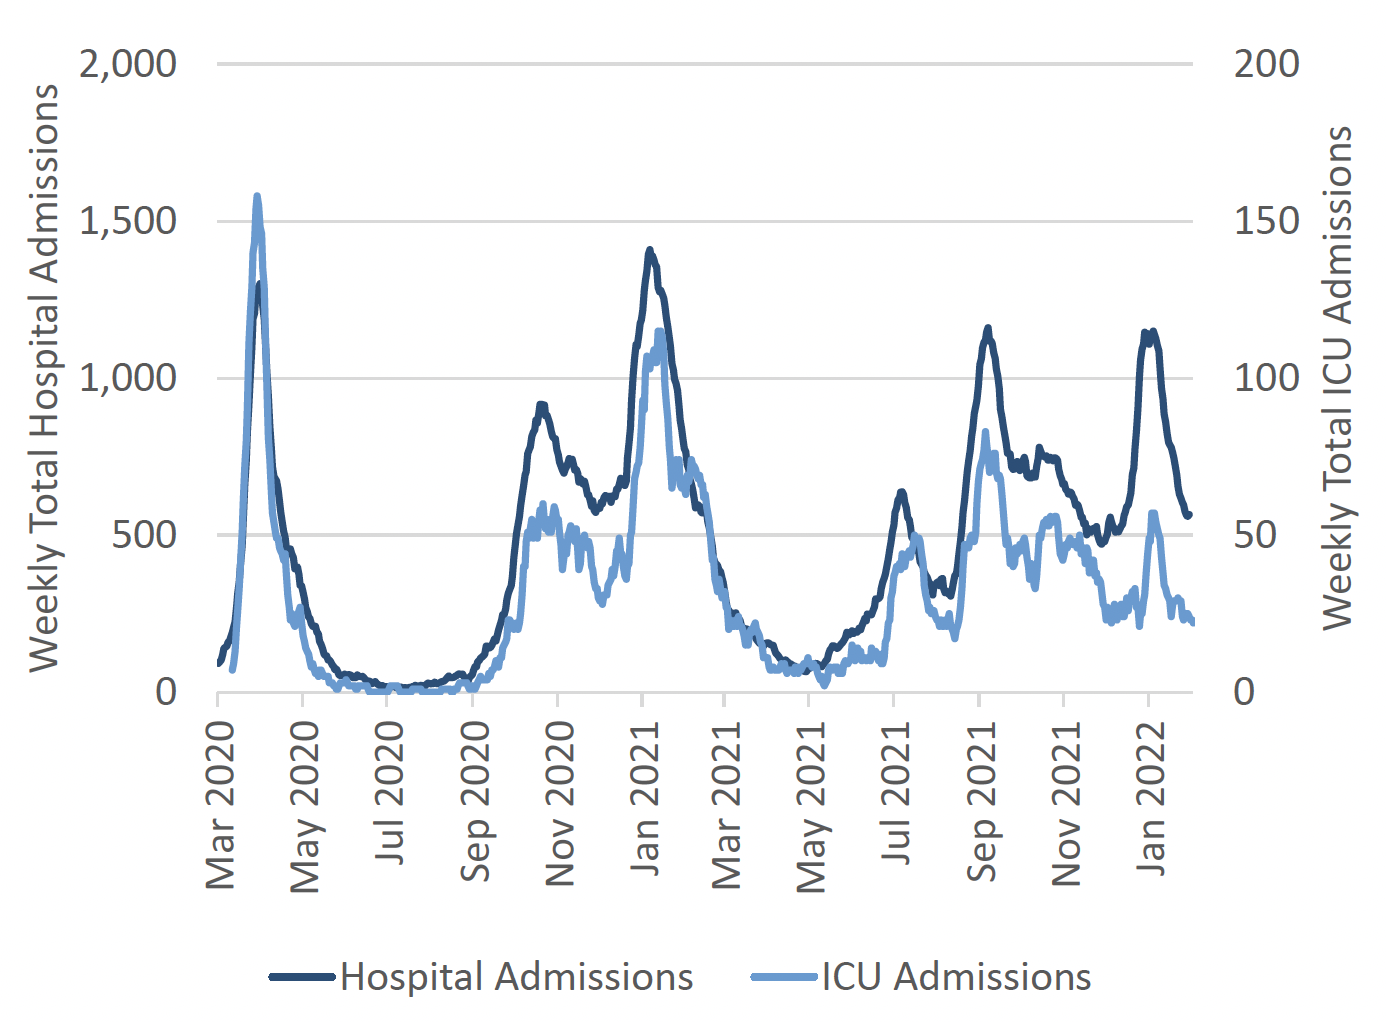
Admissions to hospital have decreased over the last week, with 565 admissions to hospital for people with confirmed Covid-19 in the week to 5 February compared to 630 in the week to 29 January. This is a 10% decrease (Figure 9)[36].
The latest data from PHS shows 22 new Covid-19 patients admitted to ICU in the week to 8 February, compared to 23 in the week to 1 February. This is a slight decrease of 4%, but the number has been fluctuating (Figure 9)[37].
Average hospital admissions (three-week rolling average) related to Covid-19 in children and young adults (aged under 22) have decreased in all age groups, except for those aged between 2 and 11, in the three weeks leading up to 2 February compared to the previous three-week period leading up to 26 January. Among those aged 2 to 4 average hospital admissions increased further by 6% compared to the previous three-week period, while it further increased by 17% in the age group 5 to 11. Overall hospital admissions related to Covid-19 in children and young adults remain higher than the previous peak in September 2021, but have decreased from the previous three-week period. The highest number (three-week rolling average) of hospital admissions in children and young adults was seen among those aged 1 or younger and 5 to 11 in the three weeks leading up to 2 February[39]. These figures refer both to young patients in hospital because of Covid-19 and with Covid-19 and only include PCR linked cases.
While it may be helpful to compare hospital occupancy between the UK nations, any comparisons must be made with caution. Definitions are not consistent across the nations and data are not reported daily by each nation. Data from Scotland, Wales and Northern Ireland is updated retrospectively if errors come to light, while data from England is not revised retrospectively, but instead is corrected in the following day's data update. This means Covid-19 death figures are not directly comparable across the four nations. For more information see UK Government website.
The seven-day average hospital occupancy in Scotland per 100,000 people was 19 patients in the week leading up to 8 February 2022. The seven-day average hospital occupancy per 100,000 population in the same period for other UK nations were as follows[40]:
- England: 21 per 100,000
- Northern Ireland: 22 per 100,000
- Wales: 24 per 100,000
In Scotland, there was a seven-day average of 1 hospital admission per 100,000 people in the week leading up to and including 05 February 2022. Seven-day average hospital admissions per 100,000 population in the same period for other UK nations were as follows[41]:
- England: 2 per 100,000
- Northern Ireland: 2 per 100,000
- Wales: 1 per 100,000
Deaths
After a period of decreasing numbers of Covid-19 deaths throughout the last three months of 2021, the week to 23 January 2022 saw a peak of 146 Covid deaths. This came after three weeks of increasing numbers of deaths, largely consisting of fatalities among those aged 45 or above, as Covid-19 deaths among younger age groups have remained at similar low levels throughout the pandemic.
The overall number of Covid-19 deaths has continued to decrease in the week leading up to 6 February. Compared to the previous week ending 30 January, the number of deaths decreased slightly by 3%, or 4 deaths, to a total of 118 deaths in the week leading up to 6 February. This figure is 82% lower than the peak in 2020, when the week ending 27 April saw a total of 663 deaths where Covid-19 was mentioned on the death certificate[42].
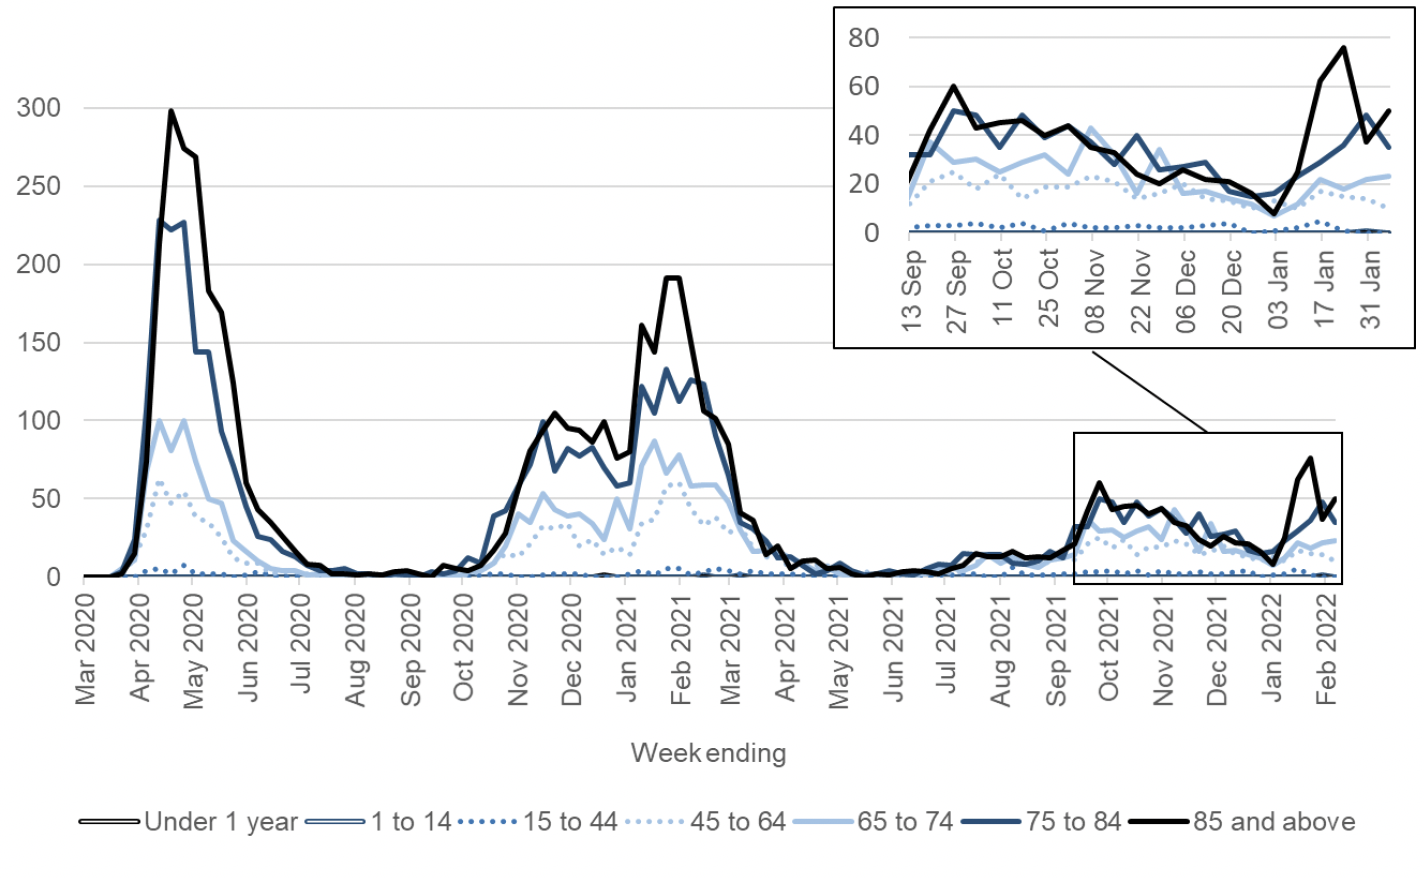
When it comes to deaths in different age groups compared to the previous week, the number of deaths decreased slightly among the age groups 45 to 64 and 75 to 84, who saw 10 and 35 Covid deaths respectively in the week leading up 7 February. Death numbers increased slightly among the age groups 65 to 74 and 85 or older, where these age groups saw a total of 23 and 50 deaths in the most recent week (Figure 10). There were no deaths among those under age 44 in the week to 6 January. National Records of Scotland publish a weekly detailed analysis on deaths involving Covid-19 in Scotland in their weekly report[43].
Excess deaths are the total number of deaths registered in a week minus the average number of deaths registered in the same week over the previous five years (excluding 2020). Measuring excess deaths allows us to track seasonal influenza, pandemics and other public health threats. Excess deaths include deaths caused by COVID-19 and those resulting from other causes.
In the week leading up to 6 February 2022, deaths from all causes were 6% below average levels for this time of year. This constitutes the fifth week in a row where deaths were below average[44].
Data from England, Northern Ireland, Scotland and Wales use different methodologies, so they cannot be directly compared. Additionally, deaths within 28 days of positive has been updated on 1 February 2022 to include deaths following the most recent episode of infection, using the new episode-based case definition in England. For more information see UK Government website.
There were 3 average daily deaths per one million population in the week leading up to 09 February 2022 in Scotland. In the same time period, average daily deaths for the other UK nations were as follows[45] [46].
- England: 3 per one million
- Northern Ireland: 1 per one million
- Wales: 3 per one million