Coronavirus (COVID-19) state of the epidemic 10 June 2022
This report brings together the different sources of evidence and data about the Covid epidemic to summarise the current situation, why we are at that place, and what is likely to happen next.
Covid-19 Prevalence
R value, Growth Rate and Estimated New Daily Infections
This edition of the State of the Epidemic Report does not include the estimates of R, growth rate or incidence. UKHSA is publishing R and growth rates next on 24 June 2022 as indicated here. These results will also be summarised in the Modelling the Epidemic Report publication scheduled for 23 June.
Covid-19 Infection Survey – Headline Estimates
The Covid-19 Infection Survey is a UK wide study carried out by the Office for National Statistics (ONS) and the University of Oxford. The survey invites people living in private households to test whether they have the infection, regardless of whether they have symptoms, using a PCR test. This means the study is unaffected by testing policy changes. Participants are also asked to provide a blood sample to test for antibodies.
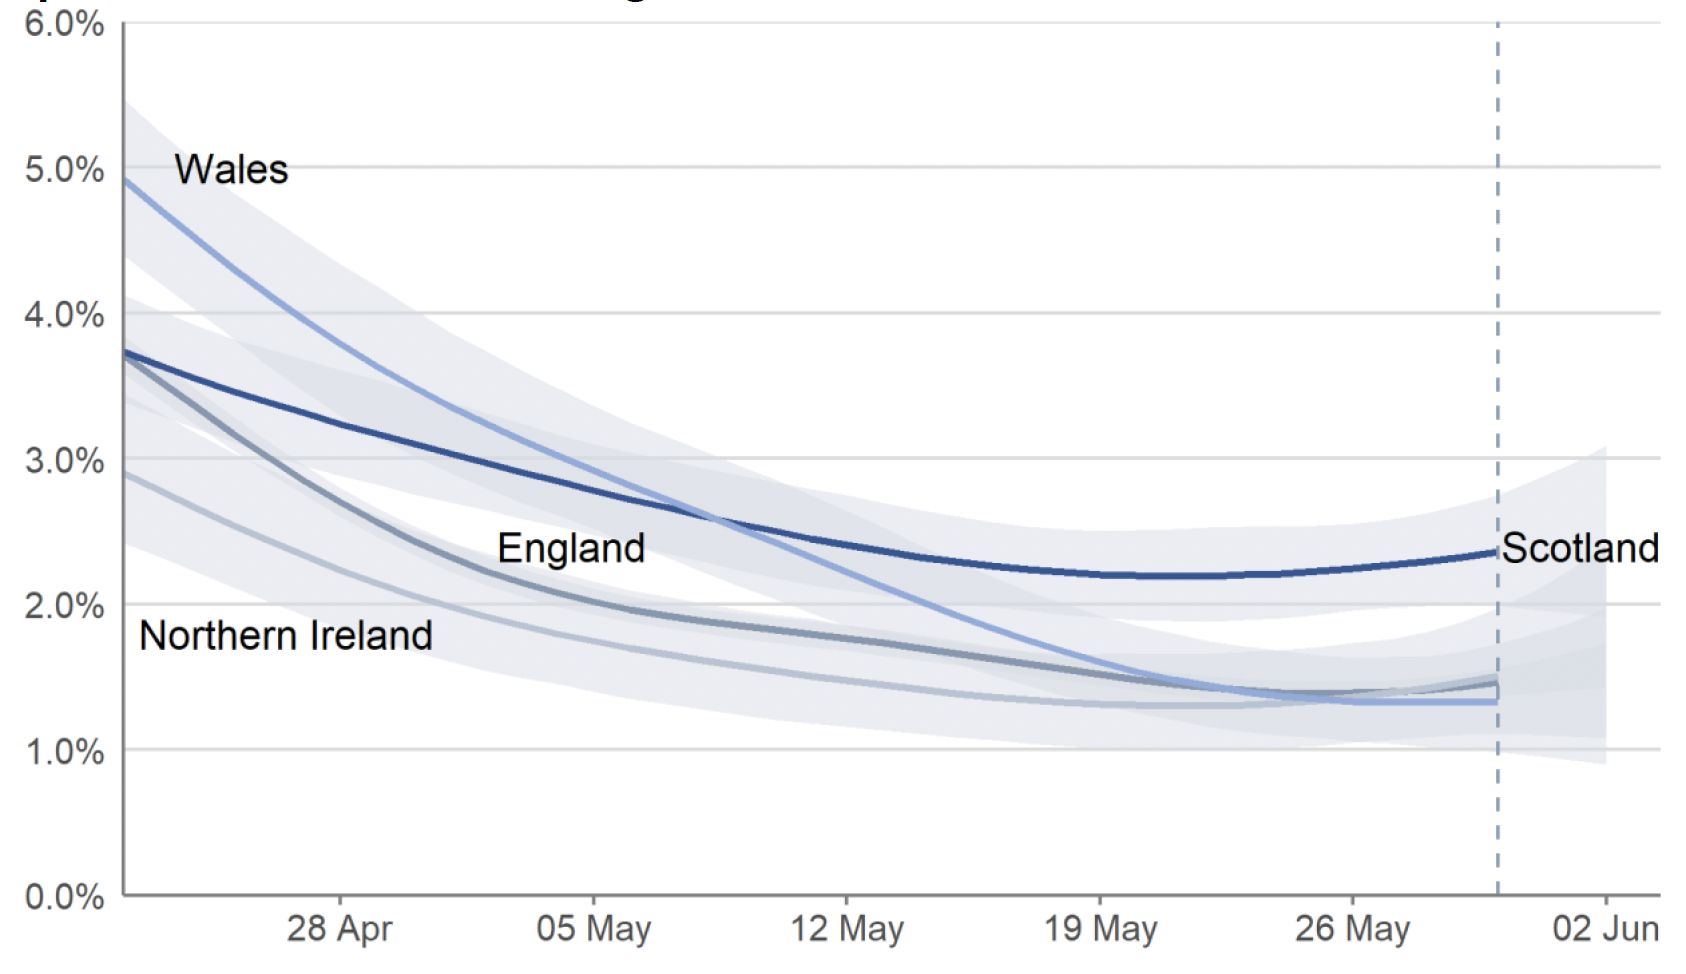
In Scotland, the trend in the percentage of people living in private households testing positive for Covid-19, as estimated by the Covid-19 Infection Survey, is uncertain in the most recent week (27 May to 2 June), as seen in Figure 1[3]. The estimated percentage of people testing positive in Scotland had been decreasing since late March. This follows a peak in the week 14 to 20 March 2022 which saw the highest estimate for Scotland since the survey began. The estimated percentage of people testing positive for Covid-19 in the week 27 May to 2 June in Scotland is 2.36% (95% credible interval: 1.99% to 2.75%)[4], equating to around 1 in 40 people (95% credible interval: 1 in 50 to 1 in 35).
In the week 27 May to 2 June 2022, there were early signs of a possible increase in the estimated percentage of people testing positive for COVID-19 in England and Northern Ireland due to increases in infections compatible with Omicron variants BA.1, BA.4 and BA.5; the trend was uncertain in Wales, as in Scotland.
In the same week, estimates for the other nations of the UK are as follows and can be seen in Figure 1:
- In England, the estimated percentage of people testing positive for COVID-19 was 1.46% (95% credible interval: 1.37% to 1.56%), equating to around 1 in 70 people (95% credible interval: 1 in 75 to 1 in 65).
- In Wales, the estimated percentage of people testing positive for COVID-19 was 1.33% (95% credible interval: 0.99% to 1.73%), equating to around 1 in 75 people (95% credible interval: 1 in 100 to 1 in 60).
- In Northern Ireland, the estimated percentage of people testing positive for COVID-19 was 1.51% (95% credible interval: 1.11% to 1.97%), equating to around 1 in 65 people (95% credible interval: 1 in 90 to 1 in 50).
The estimated percentage of people living in private households in Scotland testing positive for Covid-19 is uncertain for most age groups in the most recent week, but there are possible signs of an increase among those aged around 30 to 40 years[6].
Covid-19 Infection Survey and New Variants
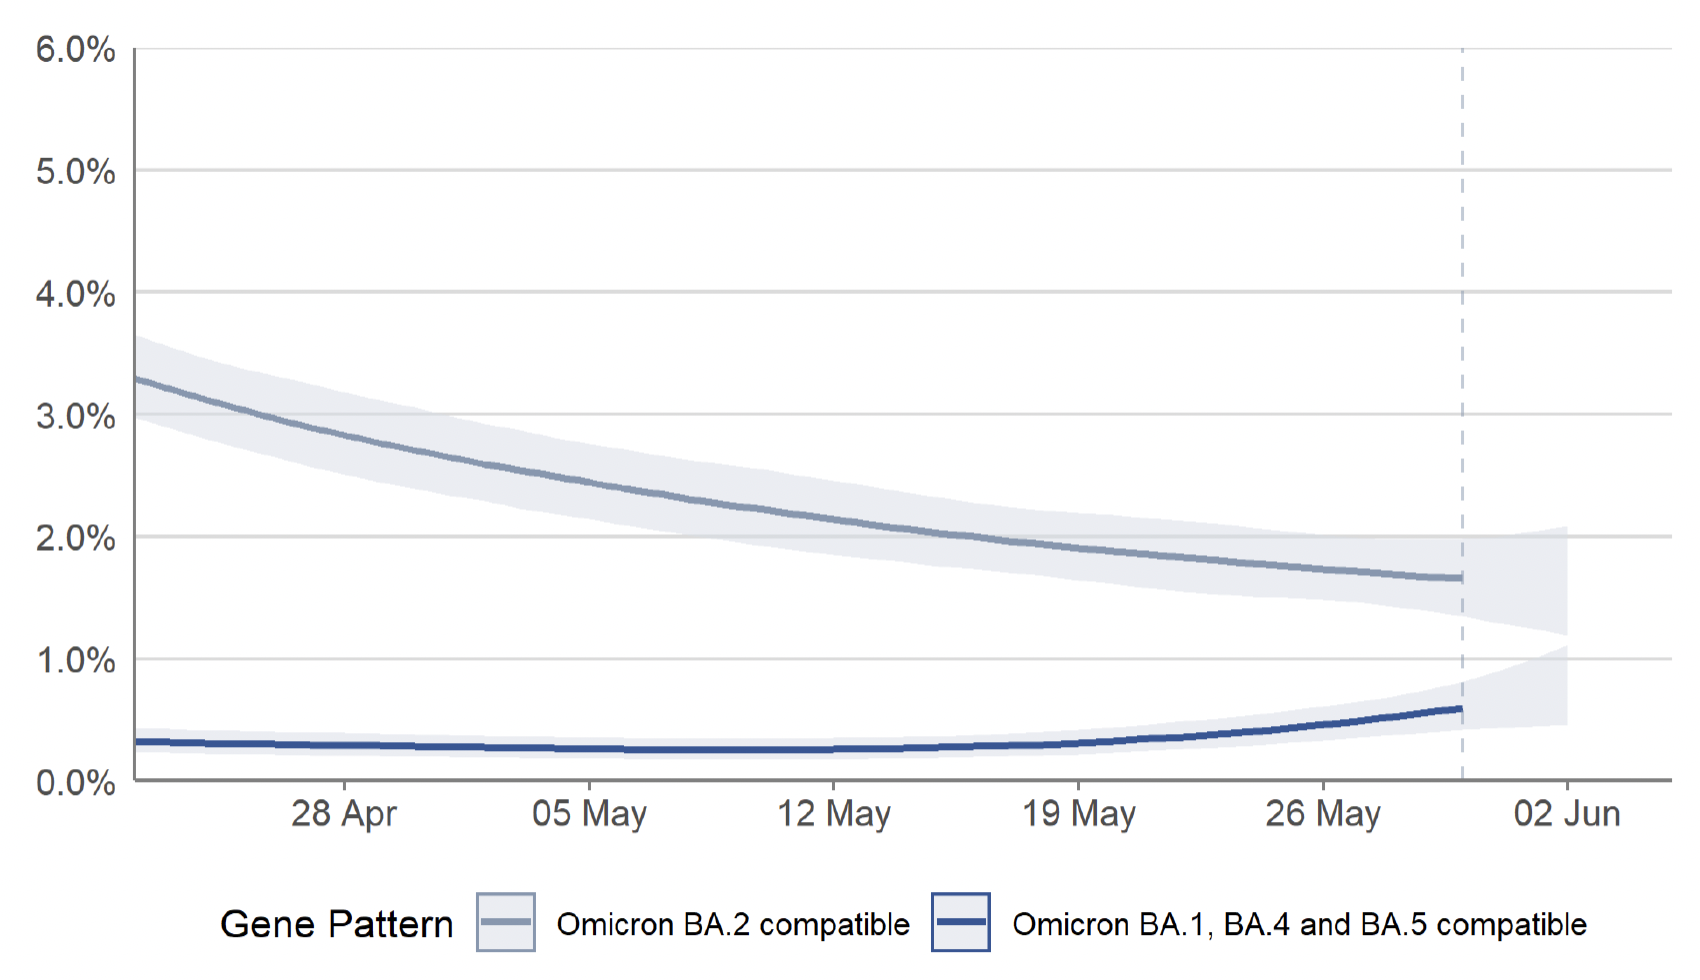
VOC-22JAN-01 (Omicron sub-lineage BA.2) remains dominant in the United Kingdom (UK) based on sequencing data[7]. There is some diversity developing within this variant. The UKHSA has elevated classification of two Omicron sub-lineages BA.4 and BA.5 to variants of concern (VOCs) naming them VOC-22APR-03 and VOC-22APR-04 respectively[8]. This change was introduced on the basis of the growth advantage of BA.4 and BA.5 over currently dominant Omicron BA.2. There can be several reasons for growth advantage, but in the case of BA.4 and BA.5, laboratory data suggests a degree of immune escape is likely to contribute[9]. Small numbers of BA.4 and BA.5 sequences continue to be detected in the UK[10]. There is currently insufficient data to draw conclusions on the disease severity of BA.4 and BA.5[11].
In response to an increase in the COVID-19 Omicron variants BA.4 and BA.5, the ONS has reintroduced its main variant analysis. The following main variant analysis is not based on genome sequencing but is based on whether the S gene is detected in the swab tests. It measures the estimated percentage of the population with a positive test compatible with the Omicron BA.1, BA.4 and BA.5 variants or BA.2 variants. For more information, see the Covid Infection Survey Headline Estimates publication.
In Scotland, the percentage of people testing positive for COVID-19 compatible with Omicron variants BA.1, BA.4 and BA.5 increased in the week 27 May to 2 June 2022. In the same week, the trend in the percentage of people testing positive for COVID-19 compatible with the Omicron variant BA.2 was uncertain in Scotland (Figure 2)[12].
Covid-19 Infection Survey – Regional Analysis
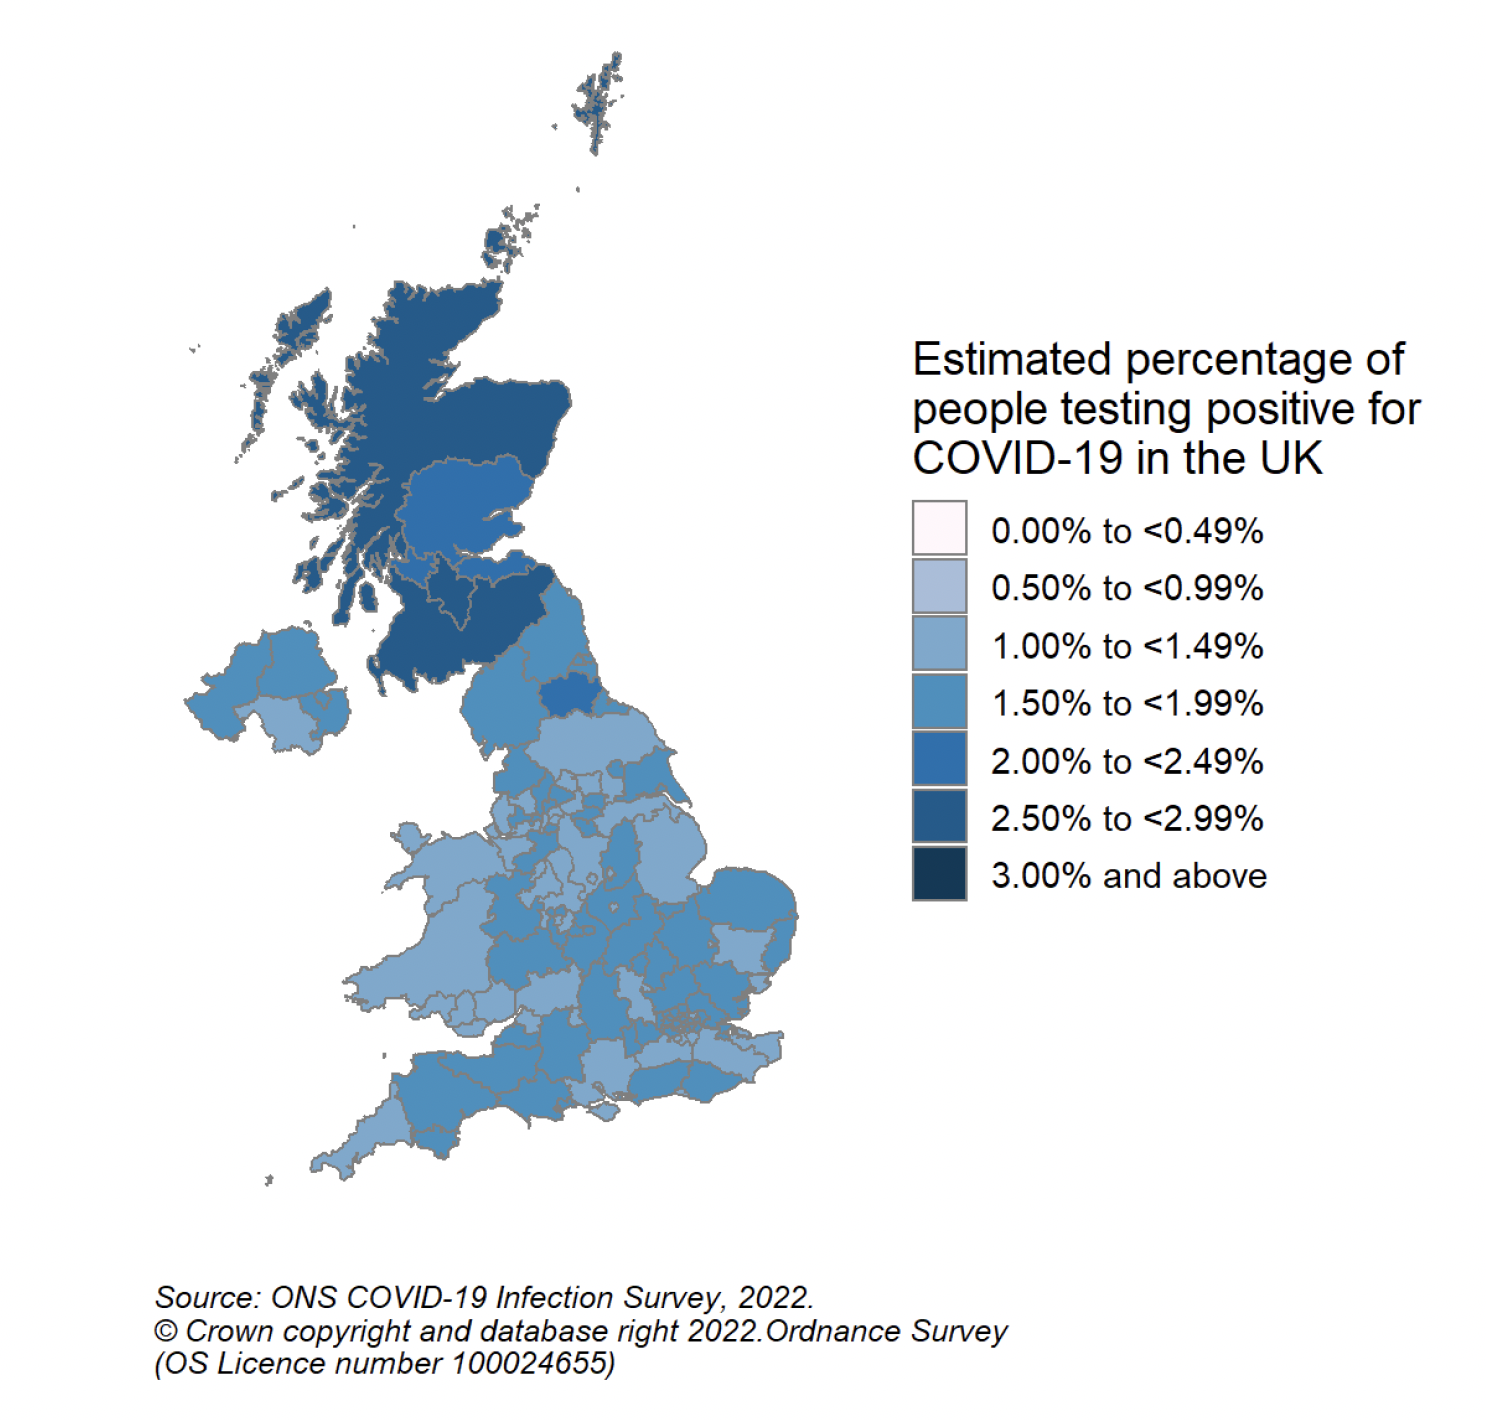
The ONS have created sub-regions across the UK for the purposes of providing Covid-19 positivity estimates for the residential populations on a lower level than the four nations. In Scotland, these sub-regions are comprised of Health Boards (for an overview on how these align with local authorities, please see Table 1 in the Technical Annex).
In the most recent week (27 May to 2 June 2022), estimates for the percentage of people testing positive were similar for all CIS Regions in Scotland and ranged from 2.32% in CIS Region 126 (NHS Lothian) (95% credible interval: 1.90% to 2.81%) to 2.55% in CIS Region 128 (NHS Ayrshire & Arran, NHS Borders and NHS Dumfries & Galloway) (95% credible interval: 2.11% to 3.12%) (Figure 3)[14] [15]. Figure 3 is also available as a dynamic map.
Covid-19 Wastewater Estimates
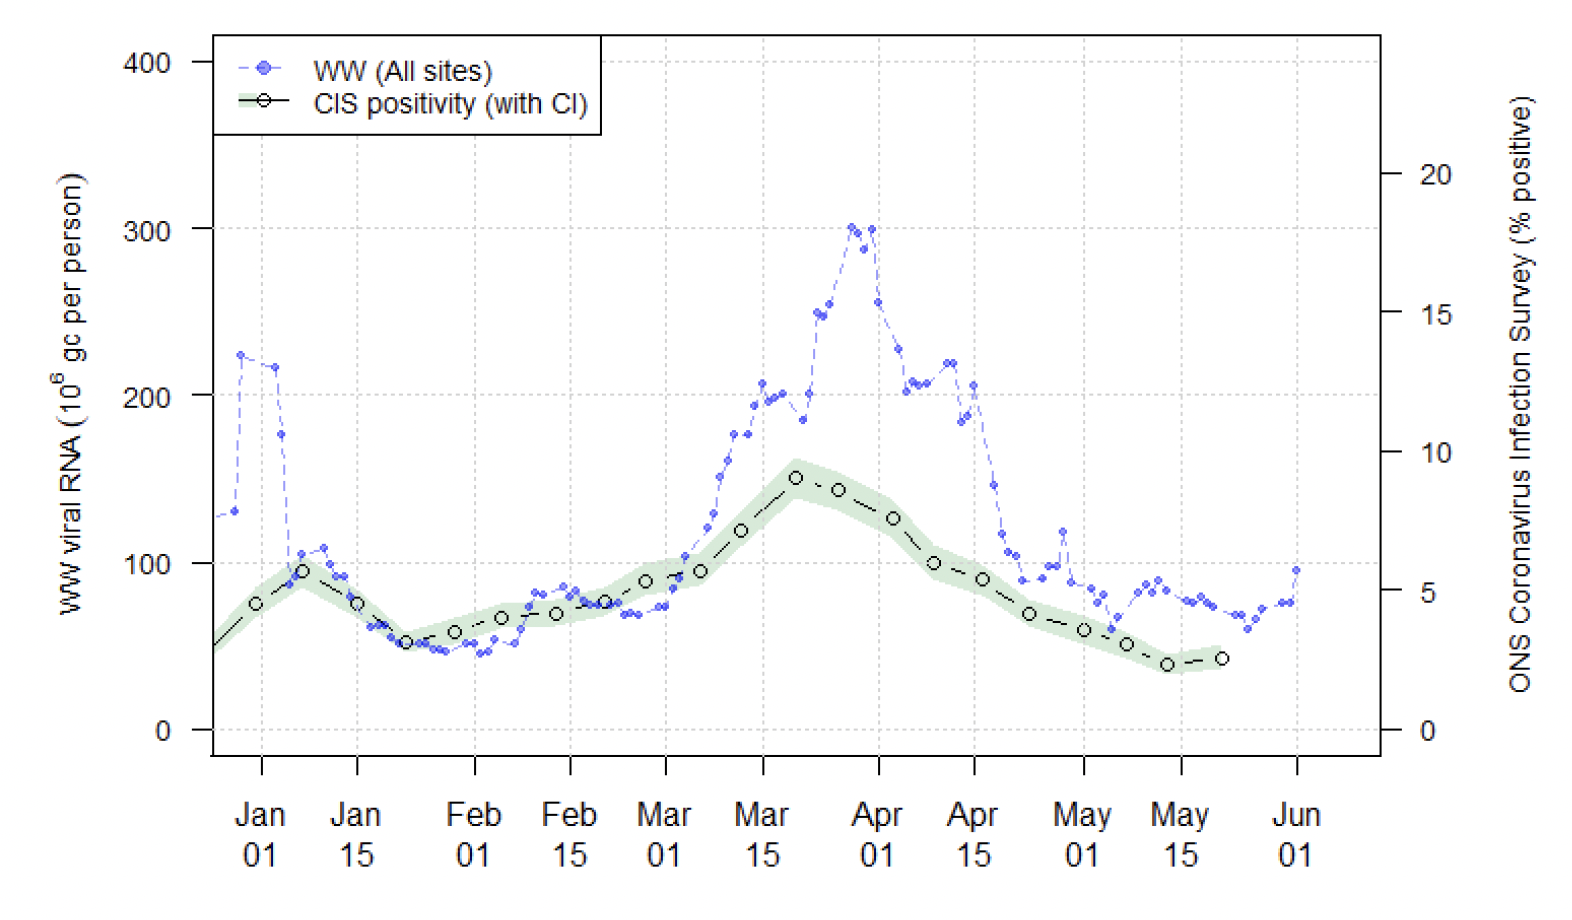
The Scottish Government has been working with the Scottish Environment Protection Agency (SEPA) to detect and analyse fragments of Covid-19 virus RNA in wastewater. The levels of SARS-CoV-2 in wastewater are monitored at 141 sites around Scotland. In contrast to Covid-19 case records, virus shedding into wastewater is a biological process. This means that wastewater data is unaffected by factors that impact whether testing is done.
Nationwide, Covid-19 wastewater levels have remained between 50 and 100 million gene copies per person per day (Mgc/p/d) since the start of May 2022, but there is variability in the data and the trend is uncertain. Figure 4 shows an apparent increase in viral levels in the most recent set of samples that were collected on 1 June and analysed on 2 June. However, this may be attributable to the variability in the data[17].
Although overall wastewater Covid-19 levels have remained at a similar level in Scotland over the last two weeks, 7 local authorities have decreased their levels over the past week. Decreases were reported in Aberdeenshire, Argyll and Bute, Clackmannanshire, Dumfries and Galloway, Orkney Islands, Shetland Islands and Stirling. Please note that comparisons for Na h-Eileanan Siar and Perth and Kinross are not possible due to sampling coverage.
Reported Covid-19 Cases
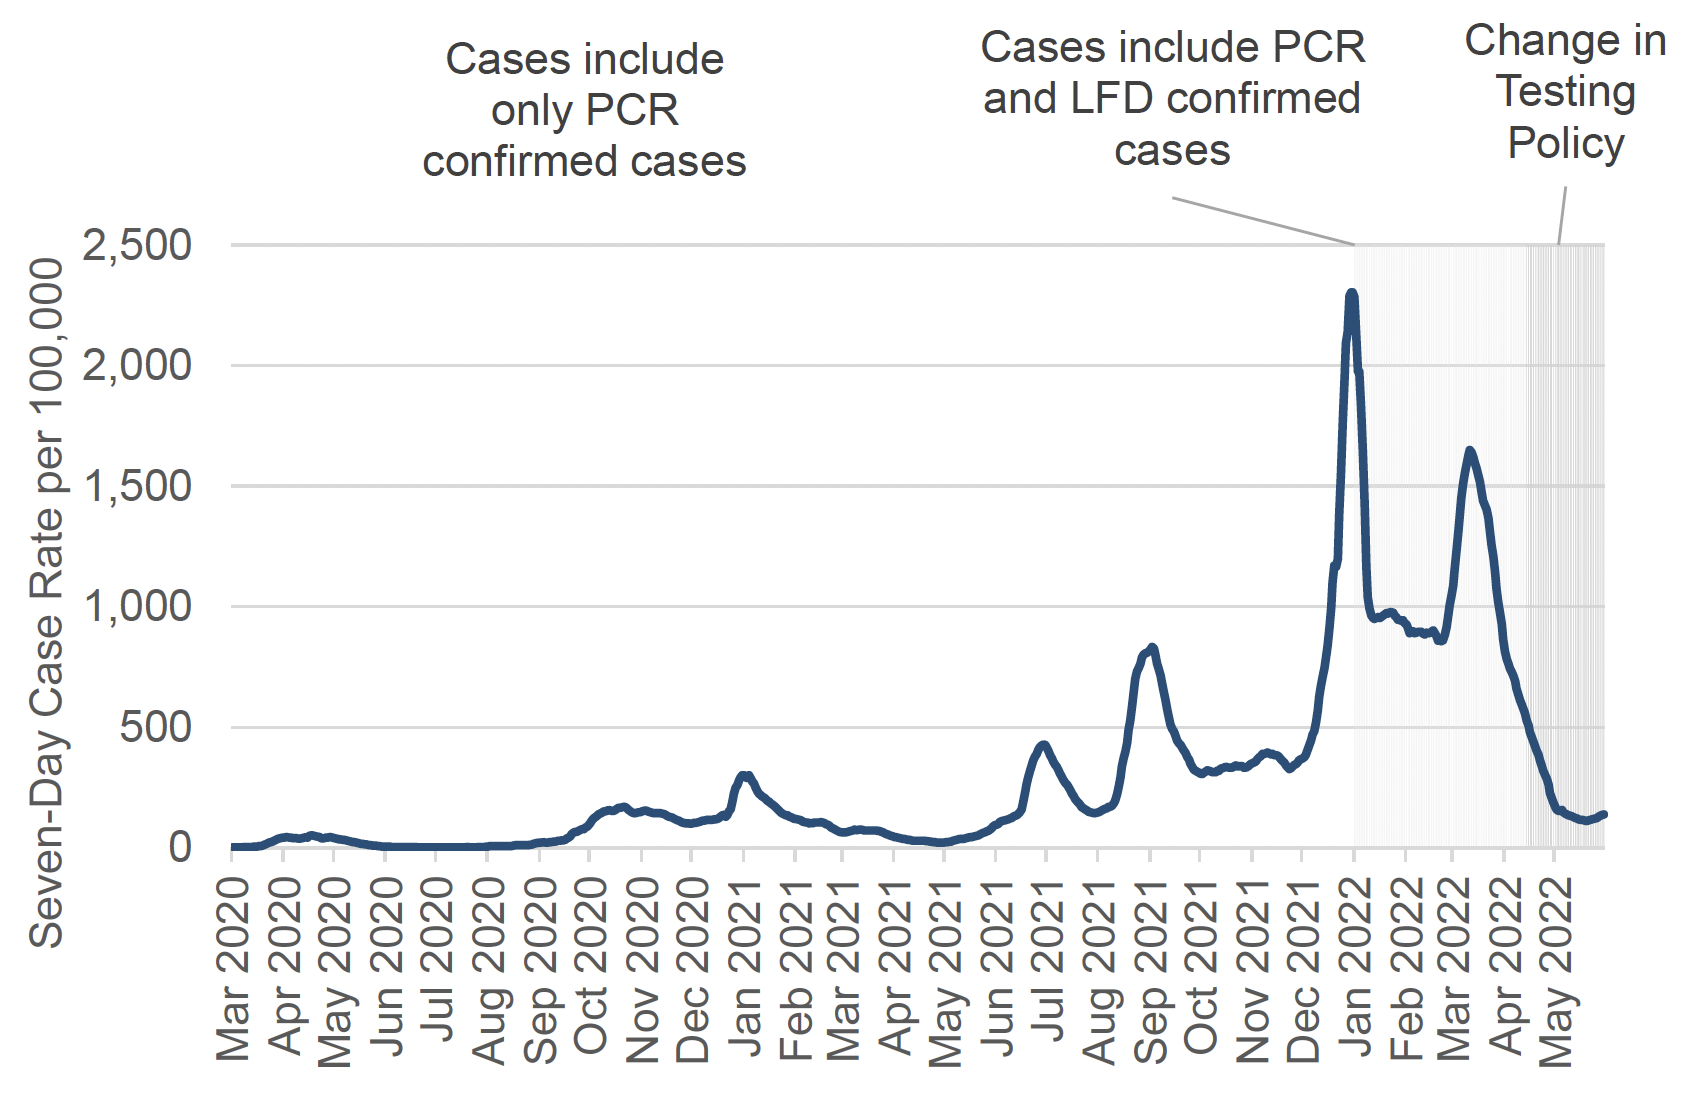
The LFD Universal Offer for asymptomatic testing came to an end on 18 April 2022. In addition, on 1 May 2022 the purpose of COVID-19 testing shifted from population-wide testing to reduce transmission, to targeted testing and surveillance. Reported cases will no longer be representative of all COVID-19 cases in Scotland, and caution is advised when comparing trends in cases over time. For more information, see the Scottish Government Covid-19 Test and Protect Transition Plan.
Please note that due to testing policy changes, reported cases will no longer be representative of all COVID-19 cases in Scotland, and caution is advised when comparing trends in cases over time. The regular analyses on case rates in different age groups and among care home residents are no longer included in this report. By specimen date, there were 138 weekly combined PCR and LFD cases (including reinfections) per 100,000 population in the week to 3 June (Figure 5)[21]. Following a period of sharply decreasing case rates since mid-March, this represents a slight increase from the previous week.
The proportion of reinfections among the total weekly cases has decreased in the most recent week. By specimen date, there was a total number of 902 reinfection cases confirmed by either a PCR or LFD test in the week leading up to 3 June. This represents 12.0% of reported cases[24]. However, this number is likely affected by testing changes and this figure may no longer be comparable over time. The proportion of reinfections have increased rapidly since December 2021 and the emergence of the Omicron variant.
While the LFD Universal Offer for asymptomatic testing came to an end on 18 April 2022 in Scotland, 90,574 LFD tests were reported in the week to 5 June. This is a 3% decrease from the week previously (week to 29 May), when 92,923 LFD tests were reported. This compared to a peak of 865,561 tests being reported in the week to 26 December 2021, while the LFD Universal Offer was still in place[25].
The Scottish Contact Survey[26] continues to ask whether people use LFD tests and if so how often. Approximately 37% of individuals had taken at least one lateral flow test within the last 7 days for the survey pertaining to the period 26 May to 1 June, decreasing from 40% two weeks prior[27].
Antimicrobial Resistance and Healthcare Associated Infection Scotland (ARHAI Scotland) provide analyses on hospital onset acquired Covid-19 infections, where patients are likely to have been infected after being admitted to hospital, based on the date when the sample was collected for a first positive Covid-19 test. Cases where the sample was collected before a hospital admission are considered community onset cases, while samples collected on day eight or later are considered nosocomial cases, or cases likely to have been acquired in a hospital setting. For more information, see this ARHAI weekly publication.
According to data from ARHAI Scotland, 105 nosocomial Covid-19 cases were reported in the week ending 15 May[28]. The total number of COVID-19 cases reported to ARHAI Scotland this week (week ending 15 May 2022) was 341. The number of nosocomial cases peaked in early January and again in late March, and has since been decreasing[29].
In line with recent changes to testing policy and transitions to long term strategies in the four UK nations, cases comparison between countries will no longer be included in the report. For more information see following links for England, Scotland, Wales, and Northern Ireland.
To compare trends in estimated infection levels in private residential households across the UK, please see the previous section on the Covid-19 Infection Survey.