A Circular Economy Strategy for Scotland – Strategic Environmental Assessment (SEA)
Strategic Environment Assessment (SEA) for the Circular Economy Strategy
Appendix A
Causal Loop Diagrams
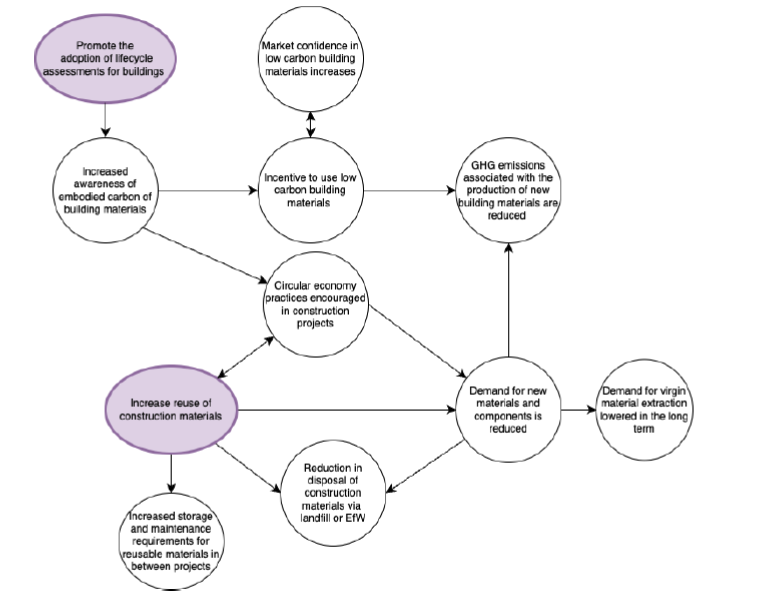
The image is a diagram titled ‘Figure 1 Casual loop diagram used to assess the anticipated environmental consequences of the measures within the Built Environment section of the Circular Economy Strategy’.
It consists of circles and text and is linked to the Built Environment section of the Strategy.
The focus of the diagram is to show the benefits to the environment of the adoption of lifecycle assessments for building and increase in the reuse of construction materials and how these are all connected when applying circular economy principles.
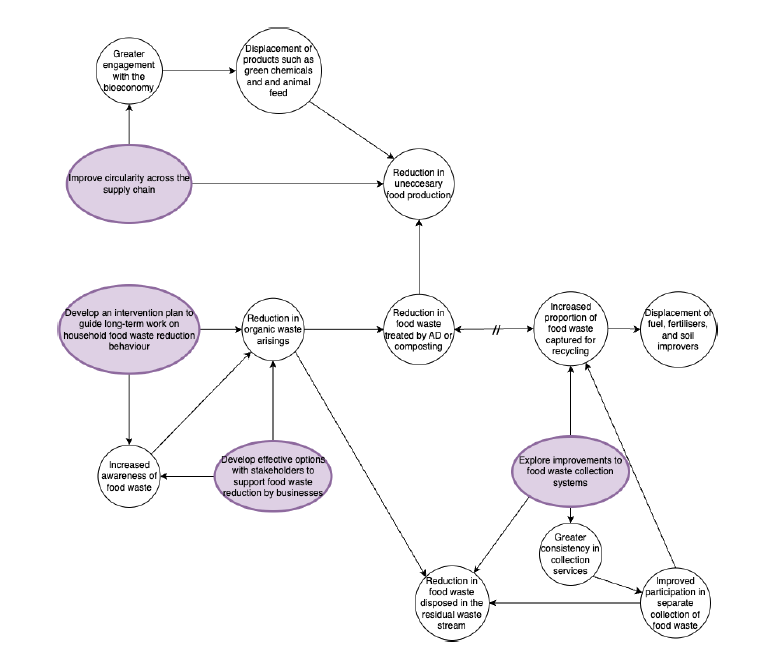
The image is a diagram titled 'Figure 2 Causal loop diagram used to assess the anticipated environmental consequences of the measures within the Food Systems section of the Circular Economy Strategy’
It consists of circles and text and is linked to the Food System section of the Strategy.
The focus of the diagram is to show the benefits to the environment of improving circularity across the supply chain, developing an intervention plan to guide long-term work on household food waste reduction behaviour, developing effective options with stakeholder to support food waste reduction by businesses and exploring improvements to food waste collection systems and how these are all connected when applying circular economy principles.
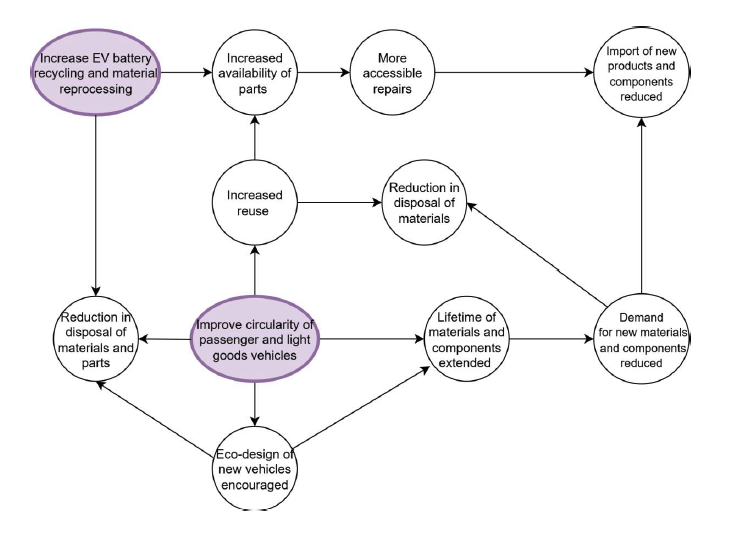
The image is a diagram titled ‘Figure 3 Causal loop diagram used to assess the anticipated environmental consequences of the measures within the Transport section of the Circular Economy Strategy’.
It consists of circles and text and is linked to the Transport section of the Strategy.
The focus of the diagram is to show the benefits to the environment of increasing Electric Vehicle battery recycling and material reprocessing and improving circularity of passenger and light goods vehicles and how these link together
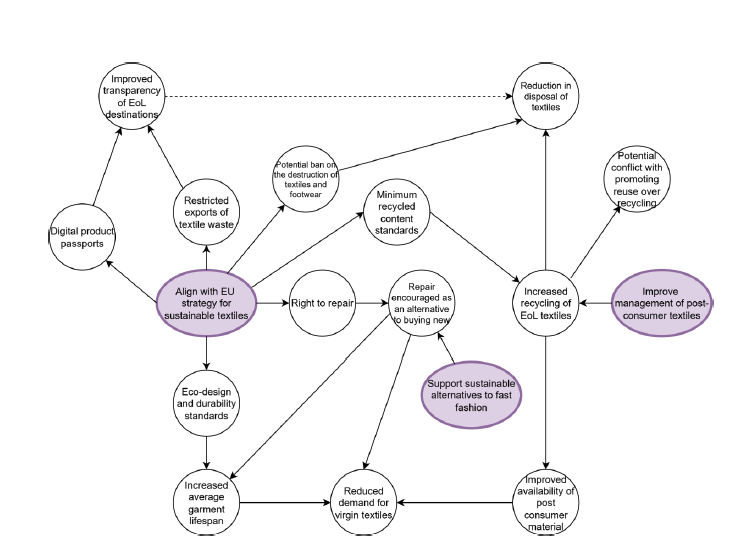
The image is a diagram titled ‘Figure 4 Causal loop diagram used to assess the anticipated environmental consequences of the measures within the Textiles section of the Circular Economy Strategy’.
It consists of circles and text and is linked to the Textiles section of the Strategy.
The focus of the diagram is to show the benefits to the environment of aligning with the EU strategy for sustainable textiles, supporting sustainable alternatives to fast fashion and improving management of post-consumer textiles and how these link together.
Contact
Email: circulareconomy@gov.scot