Children's Social Work Statistics, Scotland 2020-21
Children's Social Work Statistics for Scotland for 2020 to 2021, including data on children and young people looked after, on the child protection register and in secure care accommodation.
Child Protection
Children on the Child Protection Register
↓ The number of children on the Child Protection Register decreased by 20% since the previous year.
2,104 children were on the Child Protection Register – the lowest figure since 2002 (Chart 4).
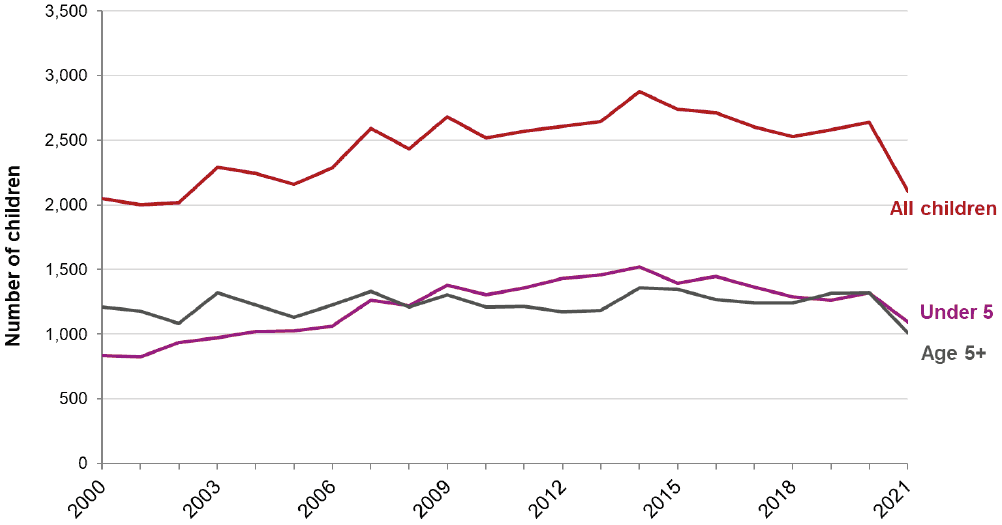
Characteristics of children on the Child Protection Register
52% were below the age of 5 years
48% were aged 5+ years
48% were male
47% were female
| Number | Percentage | |||||
|---|---|---|---|---|---|---|
| 2011 | 2020 | 2021 | 2011 | 2020 | 2021 | |
| Male | 1,282 | 1,256 | 1,014 | 50% | 48% | 48% |
| Female | 1,209 | 1,261 | 985 | 47% | 48% | 47% |
| Unborns[1] | 80 | 124 | 105 | 3% | 5% | 5% |
| All Children | 2,571 | 2,641 | 2,104 | 100% | 100% | 100% |
[1] Unborn children include some children with a known sex and those with an unknown sex. Please refer to Publication Table 2.1 for breakdowns of these.
Child Protection Case Conferences
In total, 6,374 concerns were identified at Child Protection Case Conferences. Of all concerns identified, the most common concerns were: domestic abuse (16%), neglect (15%), parental mental health problems (15%), parental substance use (15%), and emotional abuse (12%; Chart 5).
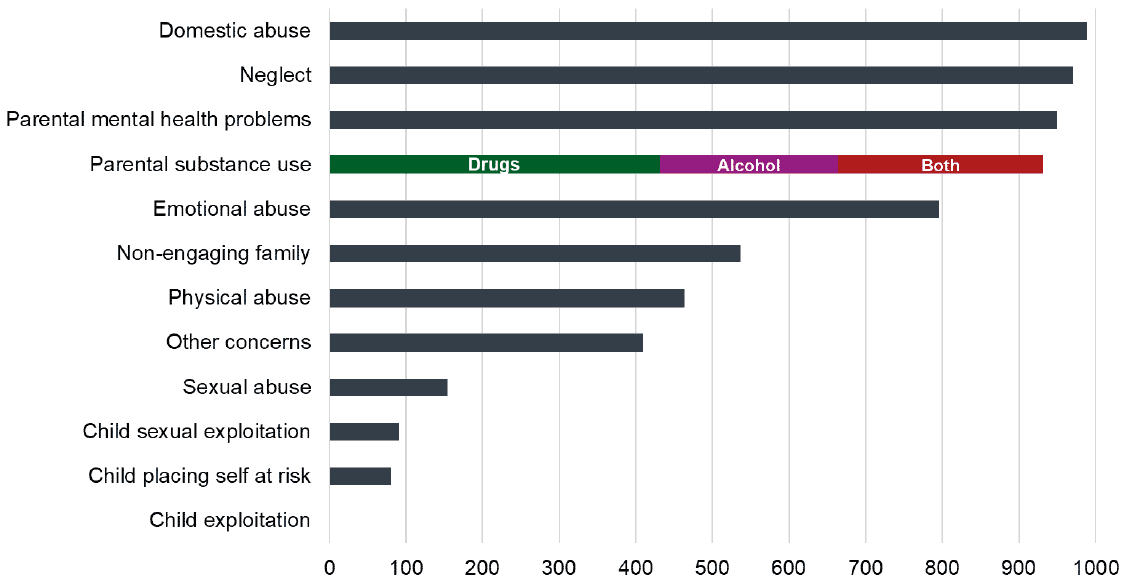
[1] Multiple concerns can be recorded (rather than just the main category of concern). This means that the total number of concerns will be greater than the total number of registrations.
[2] We are aware of ongoing change in terminology – from ‘Child Protection Case Conferences’ to ‘Child Protection Planning Meetings’. We are committed to implementing this change in future reports, but will refer to ‘Case Conferences’ here to reflect the terminology used during the time spanning the 2021 collection period.
Child Protection registrations and de-registrations
Registrations
↓ The number of child protection registrations decreased by 13% since 2020.
80% of registrations were for children who had never been registered before, the same as the proportion in 2020 (Table 2.2).
20% of registrations were for children who had been registered before. As in 2020, 11% of all registrations were for children previously registered two years ago or more.
| Time since last deregistration | Number | Percentage | ||||
|---|---|---|---|---|---|---|
| 2010 | 2020 | 2021 | 2010 | 2020 | 2021 | |
| Never been registered before | 2,971 | 3,166 | 2,753 | 84% | 80% | 80% |
| Registered before but time unknown | 0 | 0 | 0 | 0% | 0% | 0% |
| Less than 6 months | 81 | 104 | 75 | 2% | 3% | 2% |
| 6 months to under 1 year | 98 | 81 | 80 | 3% | 2% | 2% |
| 1 year to under 18 months | 67 | 89 | 92 | 2% | 2% | 3% |
| 18 months to under 2 years | 60 | 59 | 67 | 2% | 1% | 2% |
| 2 years or more | 269 | 446 | 363 | 8% | 11% | 11% |
| Unknown if child registered before | 5 | 22 | 24 | 0% | 1% | 1% |
| Total | 3,551 | 3,967 | 3,454 | 100% | 100% | 100% |
[1] This is calculated as a proportion of registrations excluding cases where it is not known if a child had been registered before.
De-registrations
↑ The number of de-registrations increased by 2% since 2020.
56% of de-registrations were due to improved home situation (Table 2.3).
81% of de-registrations were for children who were on the Child Protection Register for less than one year.
Table 2.3: Number of de-registrations by length of time on register and reason for de-registration [1]
| Number | Percentage | |||||
|---|---|---|---|---|---|---|
| 2010 | 2020 | 2021 | 2010 | 2020 | 2021 | |
| Less than 6 months | 1,592 | 1,866 | 1,826 | 42% | 48% | 46% |
| 6 months to under 1 year | 1,483 | 1,479 | 1,386 | 39% | 38% | 35% |
| 1 year to under 18 months | 460 | 363 | 443 | 12% | 9% | 11% |
| 18 months to under 2 years | 168 | 101 | 158 | 4% | 3% | 4% |
| 2 years or more | 123 | 55 | 74 | 3% | 1% | 2% |
| No date of registration information | 0 | 38 | 98 | 0% | 1% | 2% |
| Number | Percentage | |||||
|---|---|---|---|---|---|---|
| 2010 | 2020 | 2021 | 2010 | 2020 | 2021 | |
| Child taken into care & risk reduced | 538 | 477 | 404 | 14% | 12% | 10% |
| Child with other carers | 275 | 312 | 288 | 7% | 8% | 7% |
| Child died | 4 | 10 | 6 | 0% | 0% | 0% |
| Removal of perpetrator | 81 | 123 | 139 | 2% | 3% | 3% |
| Improved home situation | 1,220 | 2,083 | 2,229 | 32% | 53% | 56% |
| Child automatically de-registered because of age | 8 | 6 | 7 | 0% | 0% | 0% |
| Child moved away - no continued risk | 26 | 31 | 13 | 1% | 1% | 0% |
| Other reason | 1,674 | 860 | 899 | 44% | 22% | 23% |
| Reason not known | 0 | 0 | 0 | 0% | 0% | 0% |
| Total | 3,826 | 3,902 | 3,985 | 100% | 100% | 100% |
[1] Includes where a child transferred to another local authority and where reason has not been recorded.
Comparisons with previous years
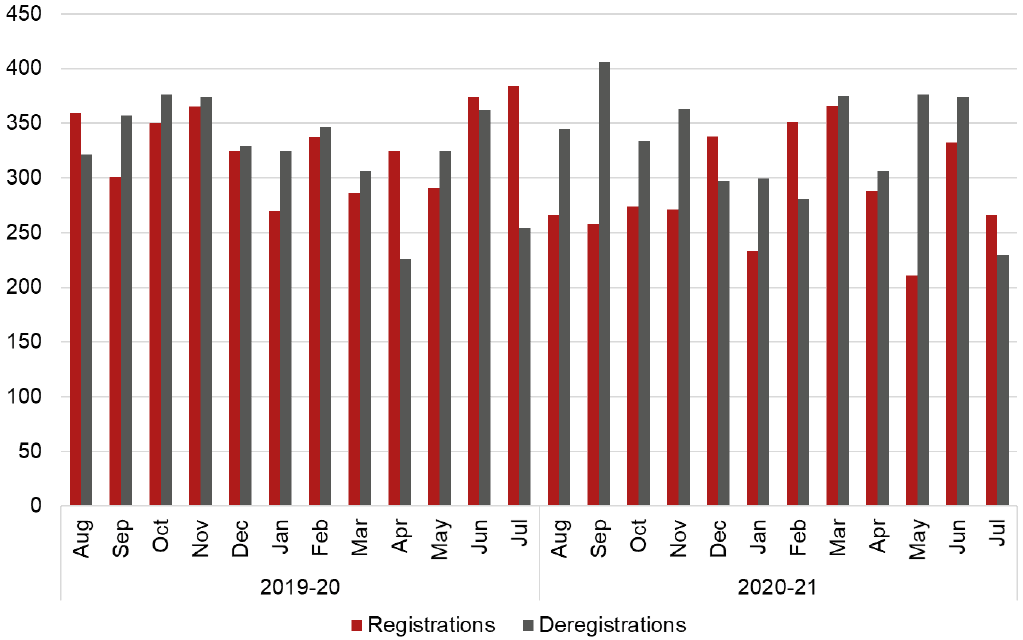
Monthly breakdowns of the number of children registered and de-registered from the Child Protection Register in 2020 and 2021 are provided in Chart 6. May 2021 saw the lowest number of registrations (n=211), while April 2020 saw the lowest number of de-registrations (n=225) from the Child Protection Register. While the pattern over these last two years is unclear, there was greater disparity between the number of registrations and de-registrations observed in 2021 where, during most months, the number of de-registrations was greater than the number of registrations.
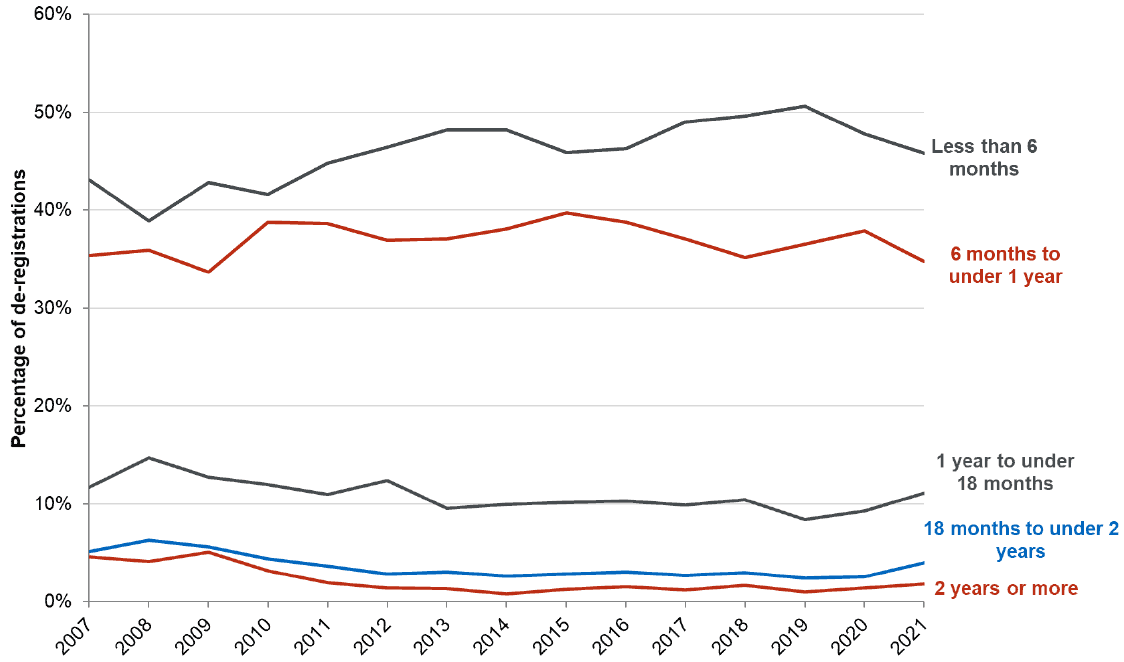
Since 2015, the percentage of de-registrations of children spending less than six months on the Register increased, peaking in 2019 (51%), followed by a decrease in 2020 (48%). This year saw a further decrease in the proportion of de-registrations of children spending less than six months on the Register (Chart 7).
Geographical comparisons
Children on the Child Protection Register within Scotland
The Local Authority breakdowns of children on the Child Protection Register in Scotland are shown in Table 2.4. The rate of children on the Child Protection Register ranged from 0.4 per 1,000 children aged 0-15 years in East Renfrewshire to 5.2 per 1,000 in North Ayrshire.
Please note that there is substantial variability from year to year in the numbers of children on the Child Protection Register at a local authority level due to the small numbers of children involved in each local authority
| Local authority | 2010 | 2020 | 2021 | |||
|---|---|---|---|---|---|---|
| Number | Rate[1],[2] | Number | Rate[1],[2] | Number | Rate[1],[2] | |
| Aberdeen City | 119 | 3.7 | 142 | 4.0 | 83 | 2.3 |
| Aberdeenshire | 51 | 1.1 | 111 | 2.3 | 73 | 1.5 |
| Angus | 92 | 4.5 | 35 | 1.9 | 25 | 1.3 |
| Argyll and Bute | 43 | 2.9 | 49 | 3.9 | 32 | 2.5 |
| City of Edinburgh | 256 | 3.6 | 95 | 1.2 | 97 | 1.2 |
| Clackmannanshire | 56 | 5.9 | 43 | 4.8 | 41 | 4.6 |
| Dumfries and Galloway | 100 | 3.9 | 26 | 1.1 | 34 | 1.5 |
| Dundee City | 70 | 2.9 | 102 | 4.3 | 84 | 3.5 |
| East Ayrshire | 42 | 1.9 | 75 | 3.6 | 71 | 3.4 |
| East Dunbartonshire | 28 | 1.5 | 37 | 1.9 | 23 | 1.2 |
| East Lothian | 70 | 3.8 | 45 | 2.3 | 29 | 1.5 |
| East Renfrewshire | 31 | 1.7 | 9 | 0.5 | 8 | 0.4 |
| Falkirk | 73 | 2.6 | 142 | 5.1 | 101 | 3.6 |
| Fife | 220 | 3.4 | 147 | 2.3 | 152 | 2.4 |
| Glasgow City | 286 | 3.0 | 413 | 4.1 | 282 | 2.8 |
| Highland | 99 | 2.4 | 129 | 3.4 | 96 | 2.5 |
| Inverclyde | 35 | 2.5 | 61 | 4.9 | 31 | 2.5 |
| Midlothian | 96 | 6.2 | 49 | 2.7 | 38 | 2.1 |
| Moray | 44 | 2.6 | 31 | 1.9 | 35 | 2.2 |
| Na h-Eileanan Siar | * | * | 3 | 0.7 | 5 | 1.2 |
| North Ayrshire | 60 | 2.4 | 136 | 6.1 | 115 | 5.2 |
| North Lanarkshire | 63 | 1.0 | 118 | 1.9 | 117 | 1.9 |
| Orkney Islands | * | * | 9 | 2.5 | * | * |
| Perth and Kinross | 49 | 1.9 | 95 | 3.9 | 66 | 2.7 |
| Renfrewshire | 119 | 3.9 | 98 | 3.2 | 71 | 2.4 |
| Scottish Borders | 32 | 1.6 | 34 | 1.8 | 34 | 1.8 |
| Shetland Islands | 10 | 2.2 | 9 | 2.2 | 8 | 1.9 |
| South Ayrshire | 43 | 2.3 | 29 | 1.7 | 19 | 1.1 |
| South Lanarkshire | 135 | 2.4 | 157 | 2.8 | 116 | 2.1 |
| Stirling | 43 | 2.7 | 53 | 3.5 | 56 | 3.7 |
| West Dunbartonshire | 27 | 1.6 | 67 | 4.3 | 57 | 3.7 |
| West Lothian | 119 | 3.4 | 92 | 2.6 | 103 | 2.9 |
| Scotland | 2,518 | 2.7 | 2,641 | 2.9 | 2,104 | 2.3 |
[1] Per 1,000 population aged 0-15 years. Source: National Records of Scotland mid-year population estimates.
[2] The rate shown in this table includes unborn children who are on the register.
Child Protection Investigations within Scotland
A Child Protection Investigation refers to a joint investigation between social work, police and health services (as well as any other relevant agencies). The purpose of the investigation is to determine whether any child protection action is needed and whether a Case Conference should be held.
Local Authority breakdowns relating to Child Protection Investigations in Scotland are shown in Table 2.5. The rate of Child Protection Investigations ranged between 0.6 per 1,000 in East Renfrewshire and 33.2 per 1,000 in Clackmannanshire.
Table 2.5 also provides Local Authority breakdowns relating to initial and pre-birth Case Conferences, as well as the number of registrations arising as a result of these. The rate of initial and pre-birth Case Conferences ranged between 0.9 per 1,000 in East Renfrewshire to 12.6 per 1,000 in North Ayrshire.
The rate of registrations from these initial and pre-birth Case Conferences ranged between 0.9 per 1,000 in East Renfrewshire to 10.7 per 1,000 in North Ayrshire.
Notably, for 664 out of 4,397 total initial and pre-birth Case Conferences (15%), no investigation was recorded within 90 days prior to the Case Conference. This suggests that the investigations for these may be missing from the figures shown. There may be other legitimate reasons for the investigation not being within 90 days prior to the Case Conference.
| Local authority | Child Protection Investigations | Initial and pre-birth Case Conferences | ||||
|---|---|---|---|---|---|---|
| Total | Rate[1],[2] | Number with an investigation recorded within 90 days of Case Conference | Number with no investigation recorded within 90 days of Case Conference[3] | Total | Rate[1],[2] | |
| Aberdeen City | 199 | 5.6 | 154 | 2 | 156 | 4.4 |
| Aberdeenshire | 400 | 8.2 | 100 | 2 | 102 | 2.1 |
| Angus | 238 | 12.6 | 36 | 73 | 109 | 5.8 |
| Argyll and Bute | 97 | 7.7 | 28 | 26 | 54 | 4.3 |
| City of Edinburgh | 818 | 10.3 | 145 | 49 | 194 | 2.5 |
| Clackmannanshire | 295 | 33.2 | 82 | 12 | 94 | 10.6 |
| Dumfries and Galloway | 269 | 11.7 | 67 | 17 | 84 | 3.6 |
| Dundee City | 730 | 30.5 | 140 | 7 | 147 | 6.1 |
| East Ayrshire | 344 | 16.5 | 175 | 2 | 177 | 8.5 |
| East Dunbartonshire | 192 | 9.8 | 84 | 4 | 88 | 4.5 |
| East Lothian | 451 | 22.9 | 40 | 14 | 54 | 2.7 |
| East Renfrewshire | 12 | 0.6 | 10 | 8 | 18 | 0.9 |
| Falkirk | 393 | 14.1 | 132 | 19 | 151 | 5.4 |
| Fife | 905 | 14.1 | 289 | 0 | 289 | 4.5 |
| Glasgow City | 1,171 | 11.7 | 545 | 0 | 545 | 5.4 |
| Highland | 350 | 9.1 | 6 | 102 | 108 | 2.8 |
| Inverclyde | 171 | 13.8 | 88 | 26 | 114 | 9.2 |
| Midlothian | 501 | 27.7 | 103 | 0 | 103 | 5.7 |
| Moray | 258 | 16.1 | 32 | 21 | 53 | 3.3 |
| Na h-Eileanan Siar | 42 | 10.2 | 39 | 3 | 42 | 10.2 |
| North Ayrshire | 454 | 20.4 | 281 | 0 | 281 | 12.6 |
| North Lanarkshire | 680 | 10.9 | 263 | 10 | 273 | 4.4 |
| Orkney Islands | 72 | 20.2 | 5 | 2 | 7 | 2.0 |
| Perth and Kinross | 340 | 14.0 | 98 | 6 | 104 | 4.3 |
| Renfrewshire | 310 | 10.3 | 130 | 49 | 179 | 5.9 |
| Scottish Borders | 136 | 7.2 | 52 | 3 | 55 | 2.9 |
| Shetland Islands | 80 | 19.2 | 15 | 6 | 21 | 5.1 |
| South Ayrshire | 92 | 5.3 | 37 | 0 | 37 | 2.1 |
| South Lanarkshire | 780 | 14.0 | 323 | 24 | 347 | 6.2 |
| Stirling | 45 | 3.0 | 1 | 68 | 69 | 4.6 |
| West Dunbartonshire | 234 | 15.1 | 108 | 46 | 154 | 9.9 |
| West Lothian | 667 | 18.9 | 125 | 63 | 188 | 5.3 |
| Scotland | 11,726 | 12.8 | 3,733 | 664 | 4,397 | 4.8 |
| Local authority | Registrations from initial and pre-birth Case Conferences | |||
|---|---|---|---|---|
| Number with an investigation recorded within 90 days of Case Conference | Number with no investigation recorded within 90 days of Case Conference | Total | Rate[1],[2] | |
| Aberdeen City | 135 | 2 | 137 | 3.8 |
| Aberdeenshire | 90 | 2 | 92 | 1.9 |
| Angus | 34 | 59 | 93 | 4.9 |
| Argyll and Bute | 28 | 20 | 48 | 3.8 |
| City of Edinburgh | 118 | 42 | 160 | 2.0 |
| Clackmannanshire | 62 | 12 | 74 | 8.3 |
| Dumfries and Galloway | 35 | 17 | 52 | 2.3 |
| Dundee City | 138 | 7 | 145 | 6.1 |
| East Ayrshire | 119 | 2 | 121 | 5.8 |
| East Dunbartonshire | 63 | 1 | 64 | 3.3 |
| East Lothian | 32 | 14 | 46 | 2.3 |
| East Renfrewshire | 10 | 8 | 18 | 0.9 |
| Falkirk | 106 | 12 | 118 | 4.2 |
| Fife | 255 | 0 | 255 | 4.0 |
| Glasgow City | 342 | 0 | 342 | 3.4 |
| Highland | 5 | 92 | 97 | 2.5 |
| Inverclyde | 45 | 14 | 59 | 4.8 |
| Midlothian | 83 | 0 | 83 | 4.6 |
| Moray | 25 | 19 | 44 | 2.7 |
| Na h-Eileanan Siar | 9 | 0 | 9 | 2.2 |
| North Ayrshire | 238 | 0 | 238 | 10.7 |
| North Lanarkshire | 197 | 10 | 207 | 3.3 |
| Orkney Islands | 5 | 1 | 6 | 1.7 |
| Perth and Kinross | 77 | 5 | 82 | 3.4 |
| Renfrewshire | 83 | 28 | 111 | 3.7 |
| Scottish Borders | 51 | 2 | 53 | 2.8 |
| Shetland Islands | 12 | 6 | 18 | 4.3 |
| South Ayrshire | 31 | 0 | 31 | 1.8 |
| South Lanarkshire | 218 | 14 | 232 | 4.2 |
| Stirling | 1 | 65 | 66 | 4.4 |
| West Dunbartonshire | 51 | 21 | 72 | 4.6 |
| West Lothian | 92 | 59 | 151 | 4.3 |
| Scotland | 2,790 | 534 | 3,324 | 3.6 |
[1] Rate per 1,000 population aged 0-15. Source: National Records of Scotland, mid-year 2020 population estimates.
[2] The rate shown in this table includes unborn children who are on the register.
[3] Case Conferences with no investigation recorded within 90 days are cases where no investigation was recorded in the data provided to Scottish Government in the 90 days preceding the Case Conference.
Cross UK comparisons
The proportion of children on the Child Protection Register has remained broadly stable in Scotland over the last decade, and is notably lower compared with the rest of the UK (Chart 8). Scotland did not experience the large increases in children on the Child Protection Register during 2007-2011 as seen in the rest of the UK. There is more information on the comparability of child protection data across the UK on the Scottish Government website.
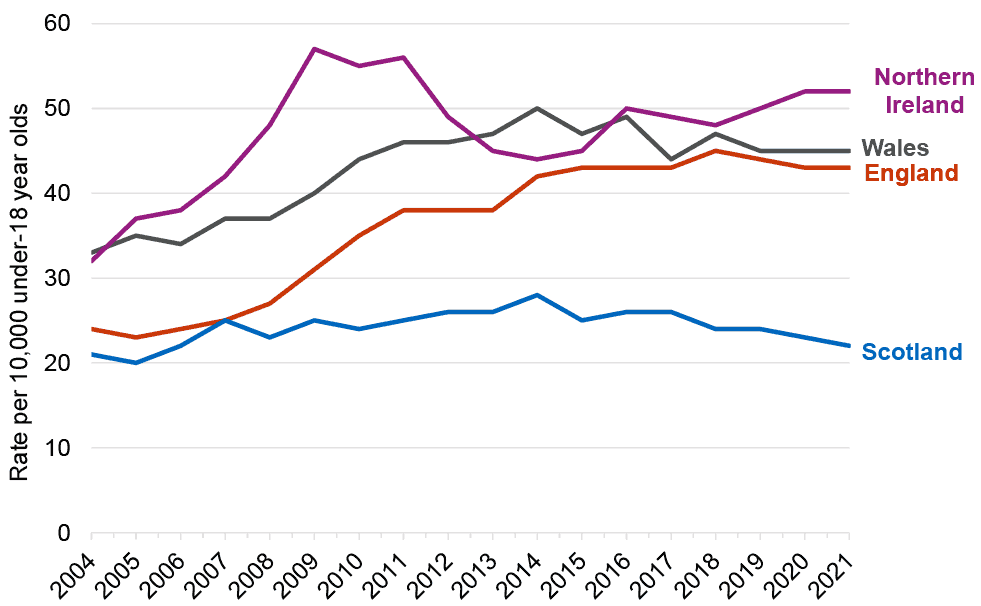
[1] Scotland data used here is as at 31st March 2021 for comparability purposes with other UK countries. Please refer to Cross-UK comparability background notes for further information.
[2] England data source: Characteristics of children in need 2021
[3] Wales data source: Children on the child protection register
[4] Northern Ireland Source: Children's Social Care Statistics for Northern Ireland 2020/21
[5] Rate per 10,000 calculates using NRS mid 2020 population estimates for those aged under 18 years.