Child and parental wellbeing: measuring outcomes and understanding their relation with poverty
Enhancing wellbeing is a crucial element of supporting the lives of children, young people and families living in poverty. This report represents a first step in assessing wellbeing outcomes and understanding their relation with poverty for low income families.
Exploring parental measures of wellbeing
Key messages
Children and young people's lives are shaped by the world around them. Parents and carers play a significant role in the lives of children and young people. Subsequently, understanding parental and carer wellbeing is essential in supporting the wellbeing of children and young people.
The three indicators considered are drawn from the areas of mental wellbeing (WEMWBS) and social capital (feelings of loneliness and neighbourhood rating).
Over time, there is a consistent gap in WEMWBS scores between the top and bottom income quintiles. With those on the highest income consistently more likely to report higher wellbeing scores than those in the lowest quintile.
The social capital indicators of loneliness and neighbourhood rating further show a gap between the top and bottom household income bands, with those on higher household annual incomes more likely to report lower levels of loneliness and higher levels of neighbourhood rating than those in the lowest household annual incomes.
Discussion on relevant indicators
Parental measures of wellbeing are included in this report as experimental indicators in order to ascertain the suitability and usability of such outputs. The original children and young people outcomes framework does not include indicators on parental or carer wellbeing.
There is a widespread understanding that child poverty targets are not an end in themselves. Tackling child poverty needs to support child and parental wellbeing in order to improve quality of life and life chances, and ensure that any reduction in poverty is sustained. We also know that a child or young person's wellbeing is influenced by the world around them, and by the different experiences they have.[56],[57]
Therefore, considering parental wellbeing is essential in then supporting the wellbeing of children and young people. Further, we are also aware of the unintended consequences of policies. For example, encouraging a lone parent to increase their hours may impact negatively upon the wellbeing of them and their child. Therefore, parental wellbeing measures may allow us to monitor associations with drivers and policies in long-term poverty reduction policies in order to better understand the connections between wellbeing and poverty.
These indicators are to be used to open this discussion and to inform future directions for reporting on poverty and wellbeing.
The subsequent sections consider three indicators across the areas of mental wellbeing and social capital.
Mental wellbeing
The following data presented from SHeS reports on the mean WEMWBS scores by equivalised household income (across five income bands) among adults living in a household with children. Figure 9 displays the 2021 by equivalised household income bands, while Figure 10 displays the trend data, from 2016 to 2021, for the bottom quintile and top quintile equivalised income bands.
Figure 9 highlights how those with the lowest household incomes report a lower mean WEMWBS score than those in the highest household income quintiles. This remains true across all adults (49.4 for the top quintile and 44.2 for the bottom quintile) and all adults living in a household with children (49.7 for the top quintile and 45.3 for the bottom quintile). However, there is some fluctuation amongst the middle income bands (2nd to 4th quintiles). Further, it appears that adults living in a household with children are more likely to report a higher mean WEMWBS score compared to all adults.
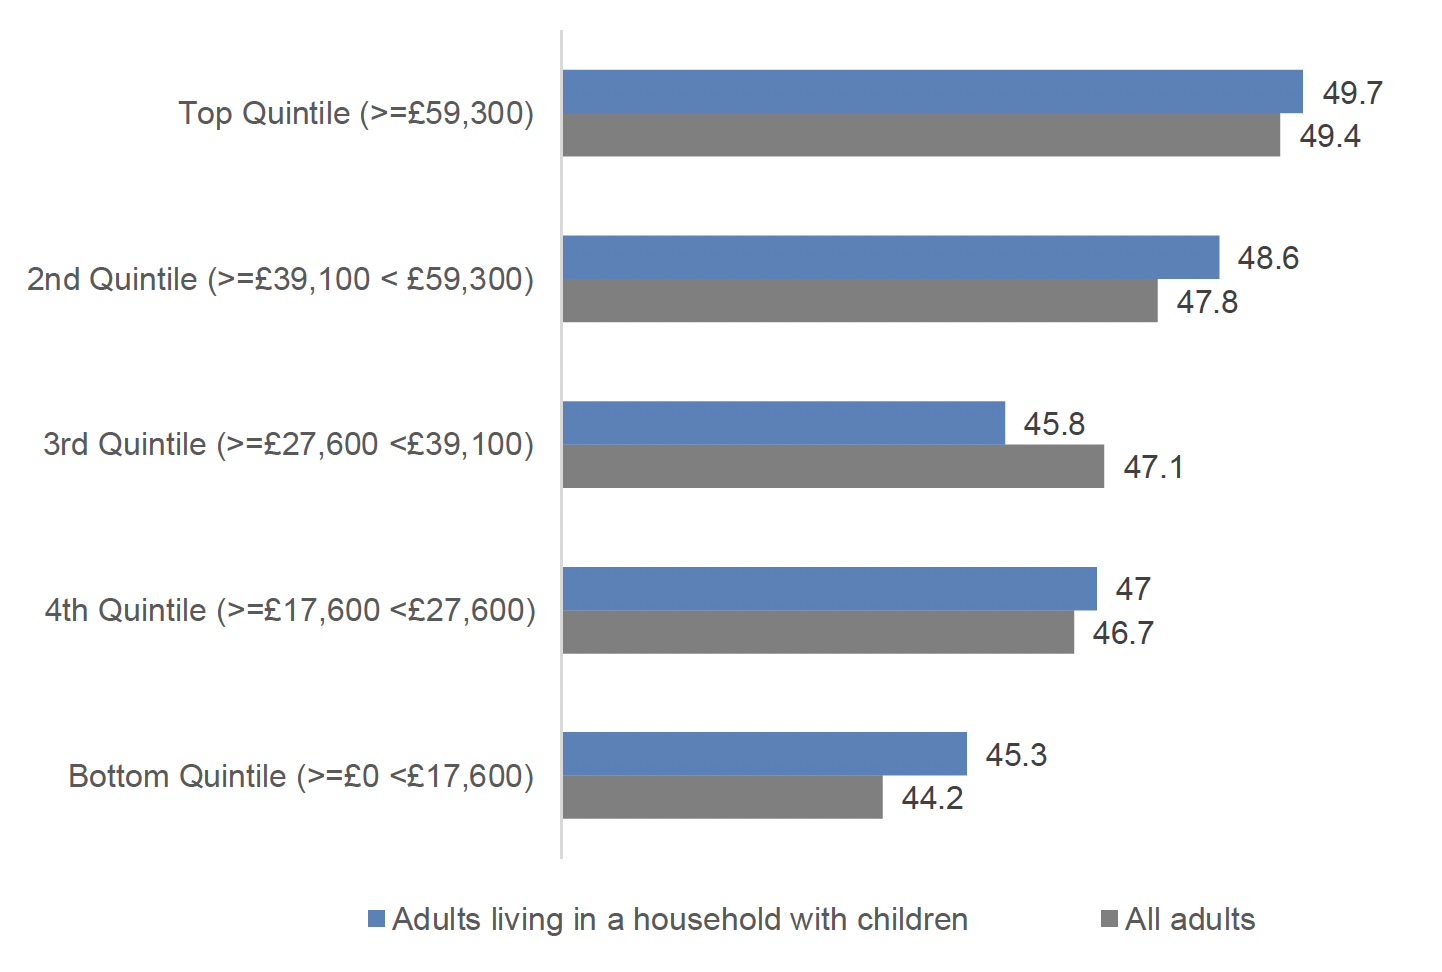 WEMWBS scores for all adults and adults living in a household with children, by equivalised household income bands. There are two bars displayed alongside each income band - the grey bars represent the data for all adults while the blue bars represent the data for all adults living in a household with children."/>
Over time, there is a consistent gap in wellbeing between the top and bottom income quintiles, with those on the highest income are consistently more likely to report higher wellbeing scores that those in the lowest quintile. However, across all household income quintiles, mean WEMWBS scores for households with children are the lowest they have been since 2016. See Figure 10 for more detail.
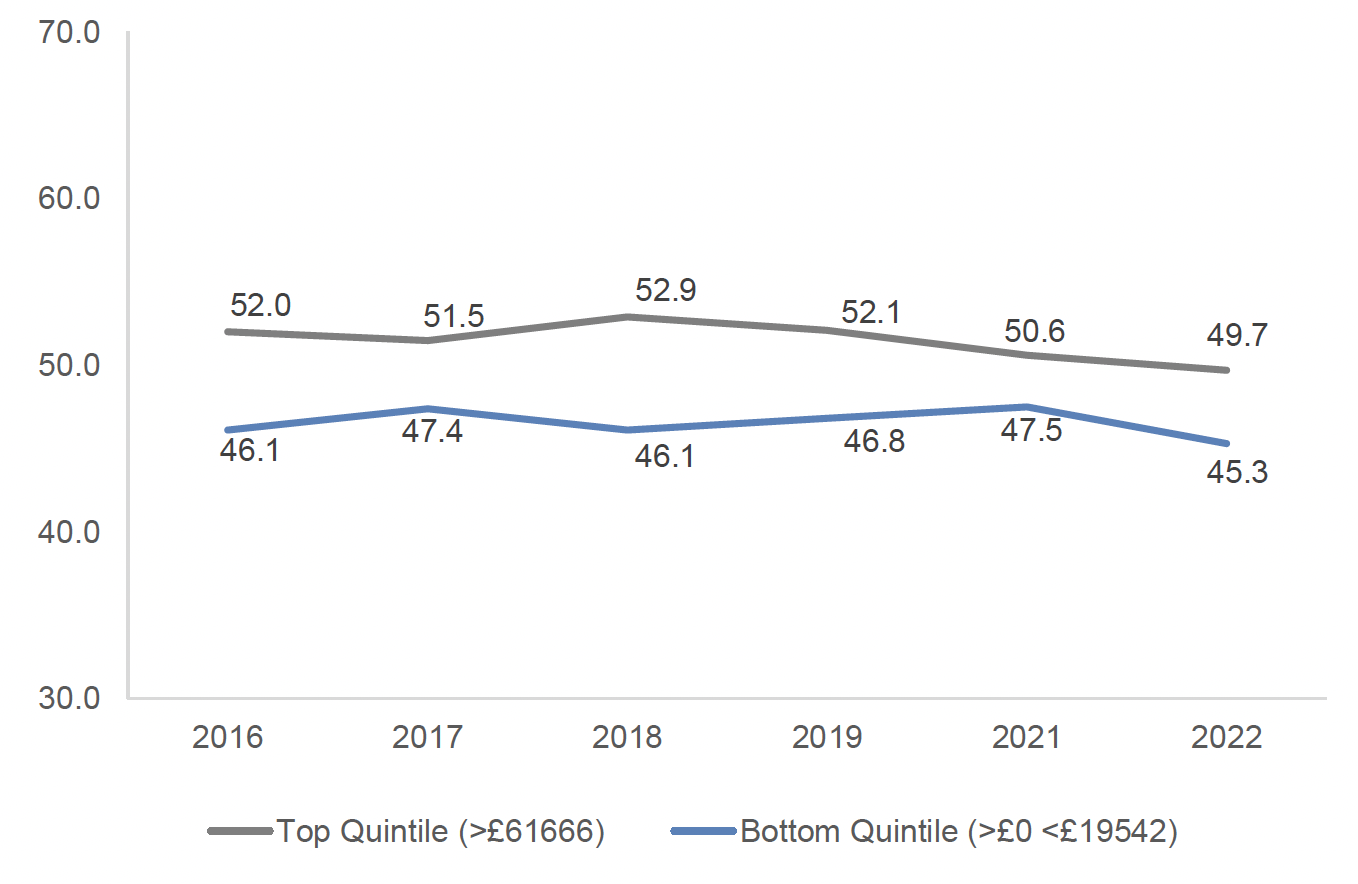 WEMWBS scores by equivalised household income bands. There are two lines displayed on the chart - the grey line represent the data points for those households with children living in the top household income quintiles, while the blue line represent the data for households with children living in the bottom household income quintiles."/>
Social capital
Social capital provides insight into the social connections which contribute to people's quality of life, health, safety, economy and wellbeing in the neighbourhoods where they lives.[58]
A Scottish Government report, Social Capital in Scotland, explores four inter-related aspects of social capital: social networks; community cohesion; social participation; and, community empowerment.. It shows a social capital index, compiled across 18 survey questions:
In our consideration of social capital, we explore two survey questions which fall under the themes of social networks (felt lonely in the last week) and community cohesion (neighbourhood rating). These particular questions were selected to give us a starting point for assessing parental wellbeing. Further, the question on loneliness is included in the National Performance Framework, while loneliness is related to interconnected communities and the notion of having (or not having) meaningful relationships.[59] Meanwhile, the survey question on neighbourhood rating is the broadest and most overarching questions asked of respondents relating to community cohesion.
This data is from the Scottish Household Survey (SHS). Due to changes in survey methodology in 2020, as a result of the COVID-19 pandemic, the SHS 2020 results are not directly comparable to SHS results for previous years. Therefore, we have used the 2018 and 2022 data as our primary sources for the social networks indicator, while for the community cohesion data we have excluded the 2020 data from the presented trend data. Further information on the adaptations to the SHS 2020 methodology can be found in the methodology and impact of change in mode publication.
Social networks
The social network theme considers the indicator of loneliness with the associated SHS question: 'How much of the time during the past week have you felt lonely?'. This indicator includes three of the five response options: 'some of the time', 'most of the time', 'all or almost all of the time'.
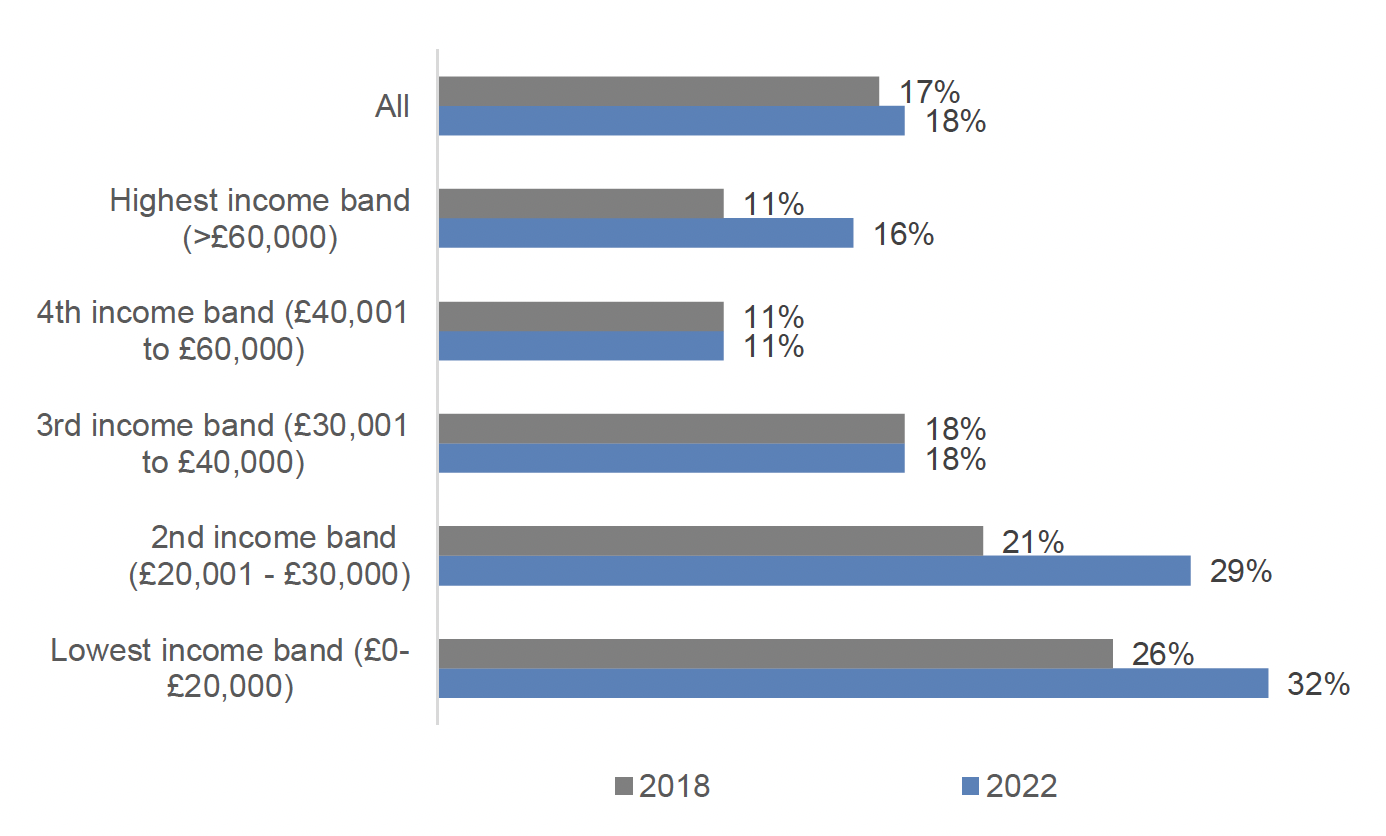
The following data reports on loneliness by annual household income (across five income bands) among households with children. Figure 11 illustrates how feelings are closely associated with household income – with loneliness levels tending to decrease as household income increased. In 2022, 18% of all adults with children in the household felt lonely some, most, all or almost all of the time. By household income, there is a marked difference in levels of loneliness with a third of adults (32%) living in the lowest household income band (up to £20,000) reporting feeling lonely at some point in the past week, while this fell to 16% of adults for those in the highest household income band (£60,000 and over). However, the lowest reported level of loneliness was in the fourth household income band, where one in ten (11%) reported feelings of loneliness at some point in the past week.
Looking across the two time periods, 2018 and 2022, it is notable that those in the bottom two income bands tended to report greater levels of loneliness when compared to households with higher income. Further, lower income households also reported greater increases over time, from 2018 to 2022.
Community cohesion
The community cohesion theme considers the indicator of neighbourhood rating with the associated SHS question: 'Thinking now about the neighbourhood you live in, how would you rate it as a place to live?' This indicator includes two of the four response options: 'fairly good' and 'very good'.
The following data reports on neighbourhood rating (the percentage reporting a 'very good' or 'fairly good' response to neighbourhood rating) by annual household income (across five income bands) among households with children.
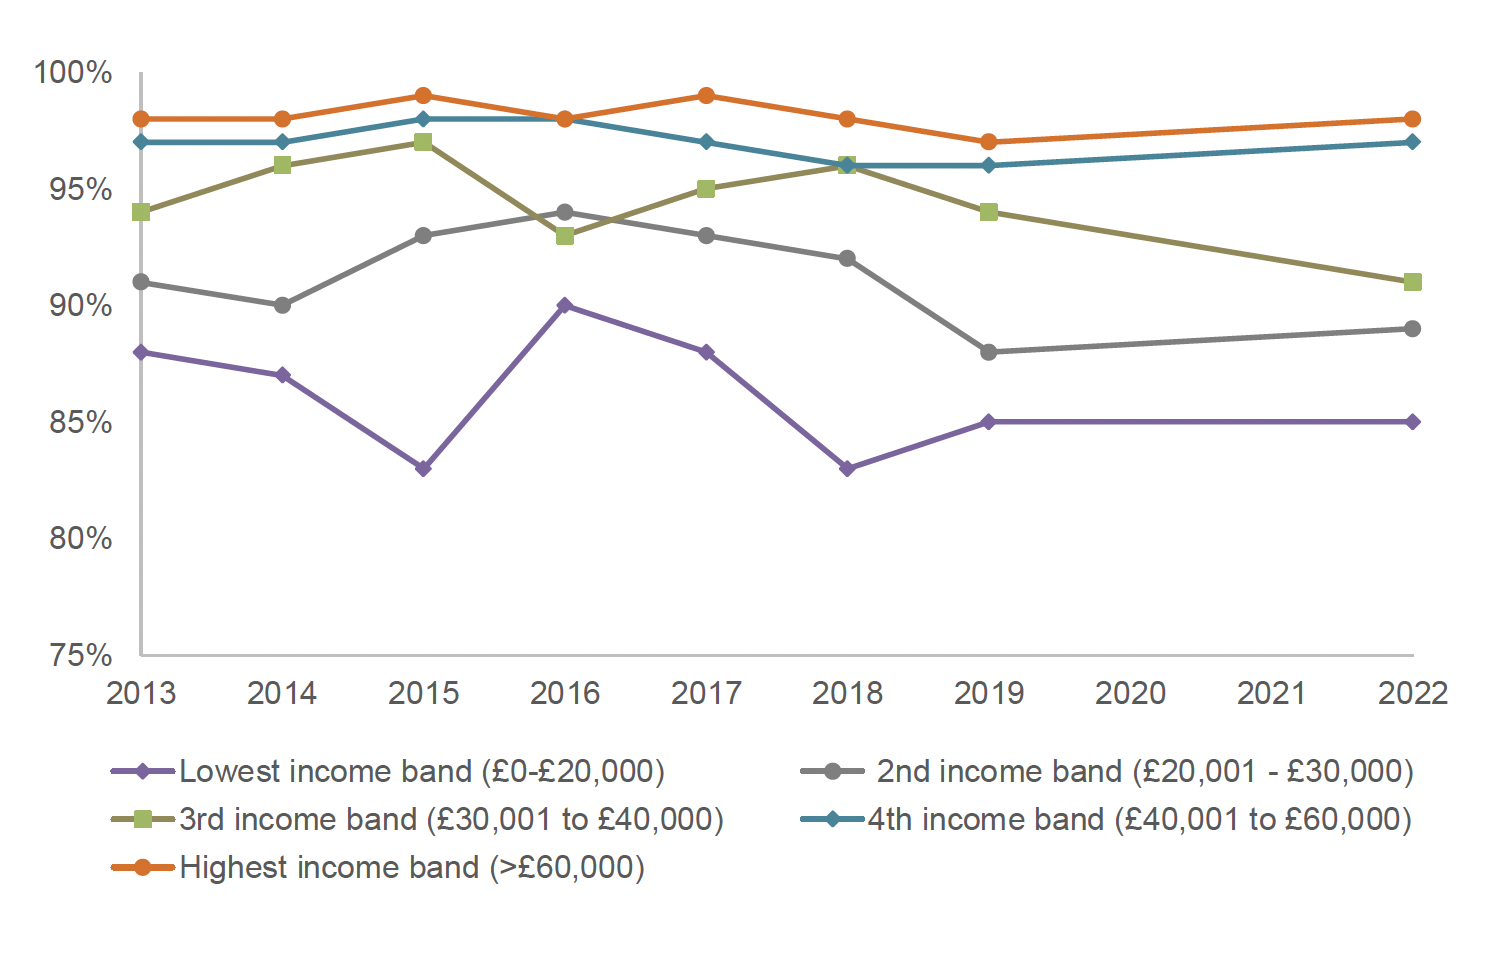
Figure 12 displays the trend data from 2013 to 2022 for neighbourhood rating by household annual income. This chart highlights how those in lower income households, and particularly in the lowest income households, tend to perceive their neighbourhood less positively than those in higher income households. For households in the lowest income band (of up to £20,000), neighbourhood rating fluctuates between 83-90% during this period, while for households in the highest income band neighbourhood rating is more stable between 97-99%. For households in the three middle income bands (£20,001 to £30,00; £30,001 to £40,00; £40,001 to £60,000), they tend to follow a general trend of increasing income associated with an increase in neighbourhood rating.