Child and parental wellbeing: measuring outcomes and understanding their relation with poverty
Enhancing wellbeing is a crucial element of supporting the lives of children, young people and families living in poverty. This report represents a first step in assessing wellbeing outcomes and understanding their relation with poverty for low income families.
My wider world
Key messages
Despite the wider economic pressures, child poverty levels in Scotland have remained stable over the medium term. Having paid work can be an effective way out of poverty, but having a job is not always enough. Many families with children live in poverty despite working.
Low income households with children spend a greater proportion of their income on housing costs. Spend on housing has been relatively stable in recent years. From a wellbeing perspective, the child wellbeing indicator relating to housing, looks at temporary accommodation. The number of children in temporary accommodation continues to increase due to the knock on effects of the COVID-19 pandemic.
Where you live also plays a role in how you interact with the world. Those from more deprived communities are less likely than those in the least deprived communities to:
- Agree their local area is a good place to live
- Feel safe when out in their local area.
The policy context
The premise of Best Start, Bright Futures (BSBF) is to lay out the plan of action to achieve the interim and final child poverty targets. This includes work across the main drivers of poverty (income and cost of living). Therefore, BSBF features key policies focused in the areas of employability, housing and digital connectivity. All of these are indicators used to see progress on this side of the 'My World Triangle'.
When looking at the wider world, it is important to consider the range of different societal and political changes and economic crises of recent years. From Brexit, through the COVID-19 pandemic to the most recent cost of living crisis. Evidence shows that low income households have entered the latest crisis in a highly vulnerable position with few, or no, options left to reduce household costs.[46] Further, evidence highlights that the cost of living crisis is significantly impacting upon the mental health of both parents and children.[47]
As such, progress towards the child poverty targets is likely to positively impact on the wider wellbeing of families.
Child Poverty
The child poverty indicator is the relative child poverty rate after housing costs.
In 2021-22, 23% of children were living in relative poverty after housing costs. This is broadly similar to previous, recent years (see Figure 6). After falling during the late 1990s into the 2010s, with the rate slowing prior to the 2008/09 recession, child poverty has gradually risen in the past decade, but has stabilised in recent years.
Some types of households with children are known to be at a particularly high risk of poverty. These include households with single parents, three or more children, disabled household members, of a minority ethnic background, with a child aged under one, or a mother aged under 25. These groups do not cover everyone at higher risk of poverty, but taken together, they cover the majority of households with children that are in poverty.[48]
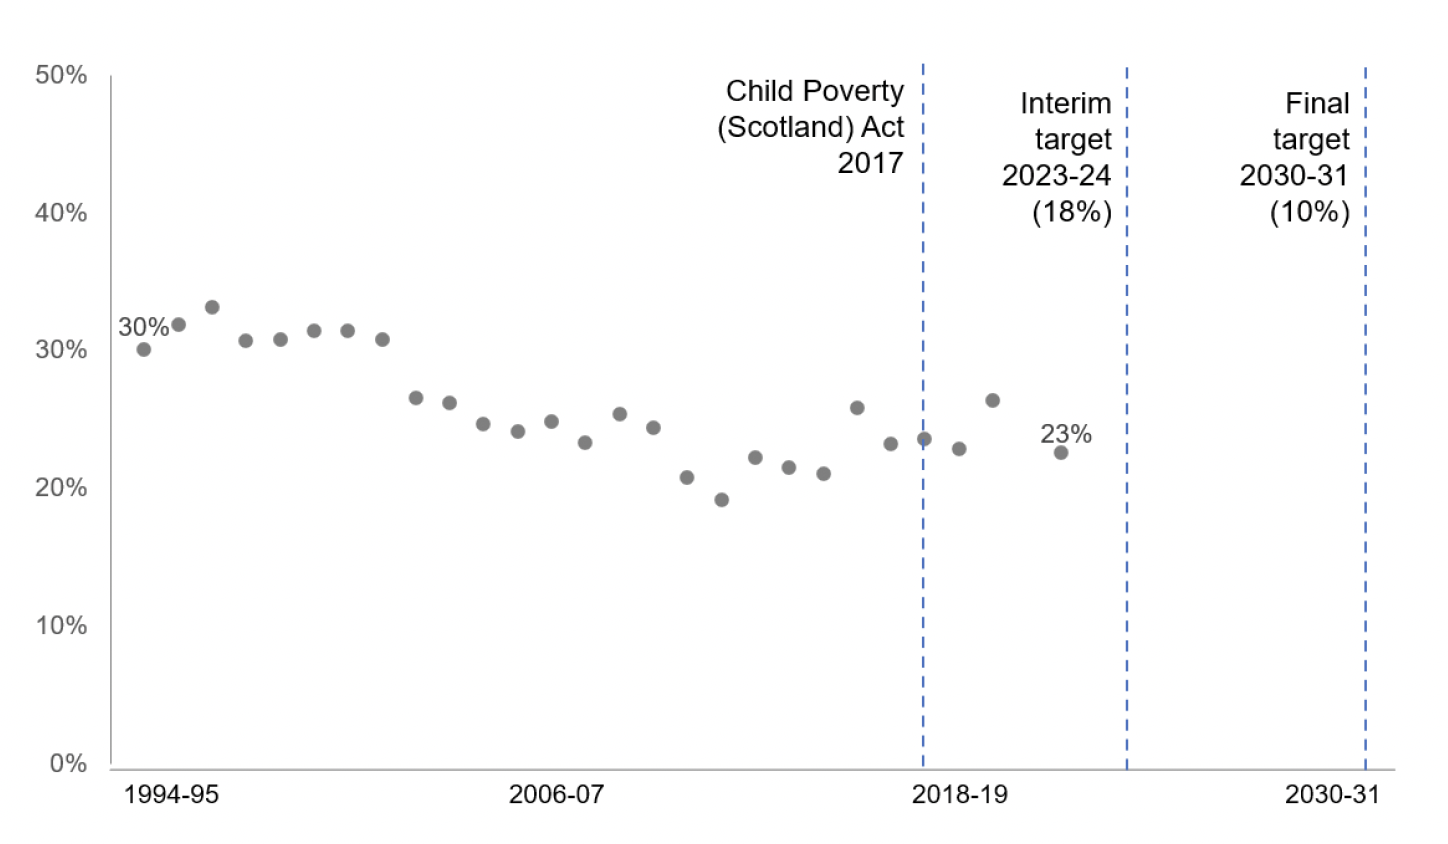
Note: Dots and labels show single-year estimates.
Housing
The housing indicator for the purpose of this report, is the number of children in temporary accommodation at 31 March of a given year. A child is defined as (a) anyone aged under 16, or (b) anyone aged 16, 17 or 18 either receiving or about to begin full-time education or training, or unable to support themselves for some other reason (e.g. they have a learning disability) and are dependent on an adult household member.
On 31 March 2023, there were 9,595 children living in temporary accommodation. This is a 9% increase on the figure from 2022, and follows a general upward trend since 2015 (see Figure 7 below).
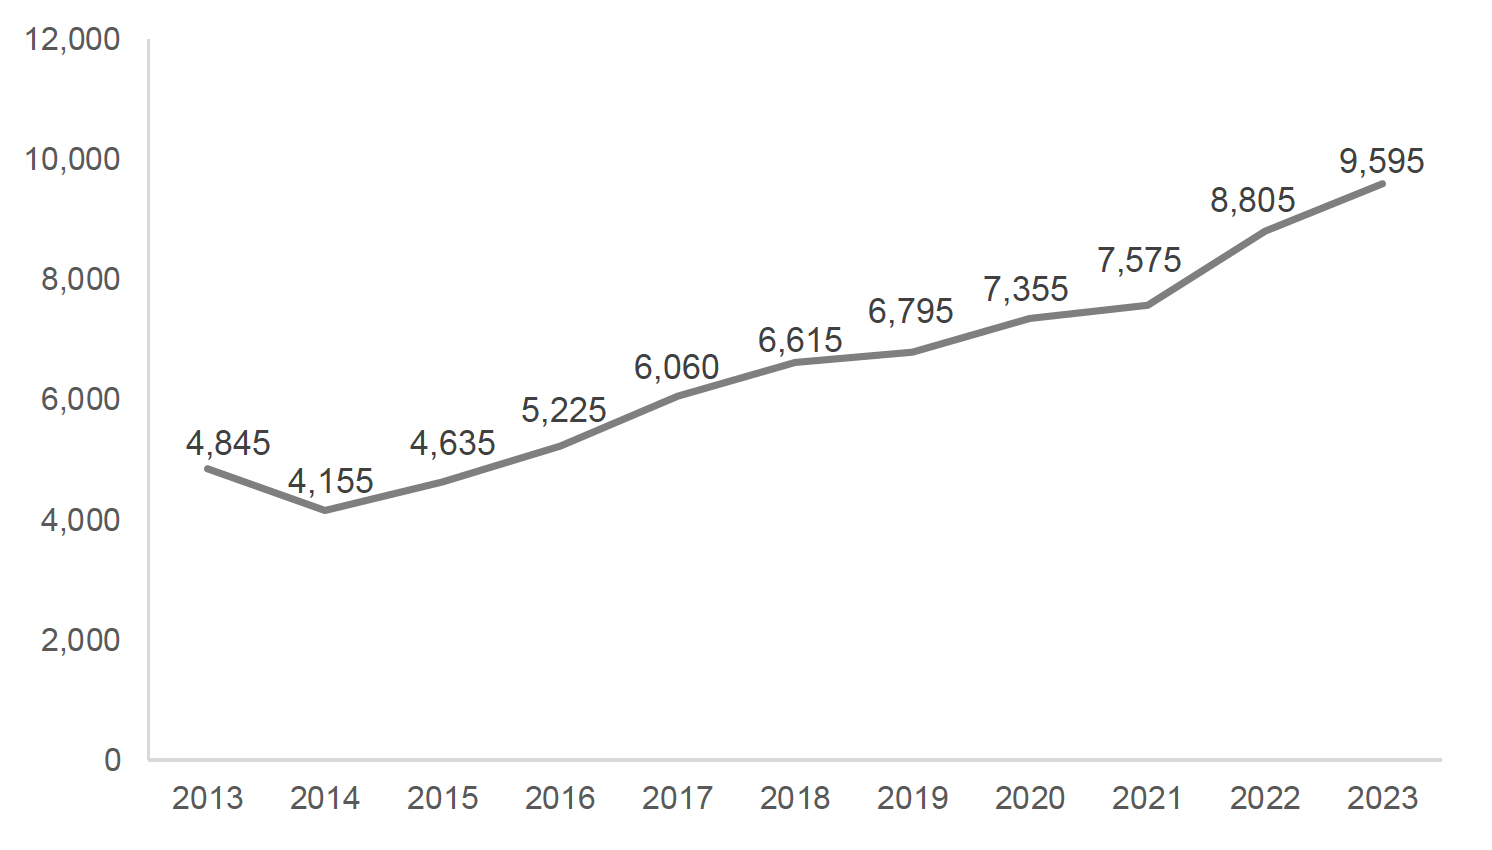
As reported in the national reporting of the core wellbeing indicators there has been an increased demand for temporary accommodation arising from, and following, the COVID-19 pandemic. This is due to informal arrangements, such as staying with friends, no longer being suitable due to lockdown and social distancing measures. Post-pandemic numbers have remained high due to the backlog of applications and cost and supply issues of materials and trades people.[49] While the most recent year is reported to also be affected by the cost of living crisis.[50]
Adult employment
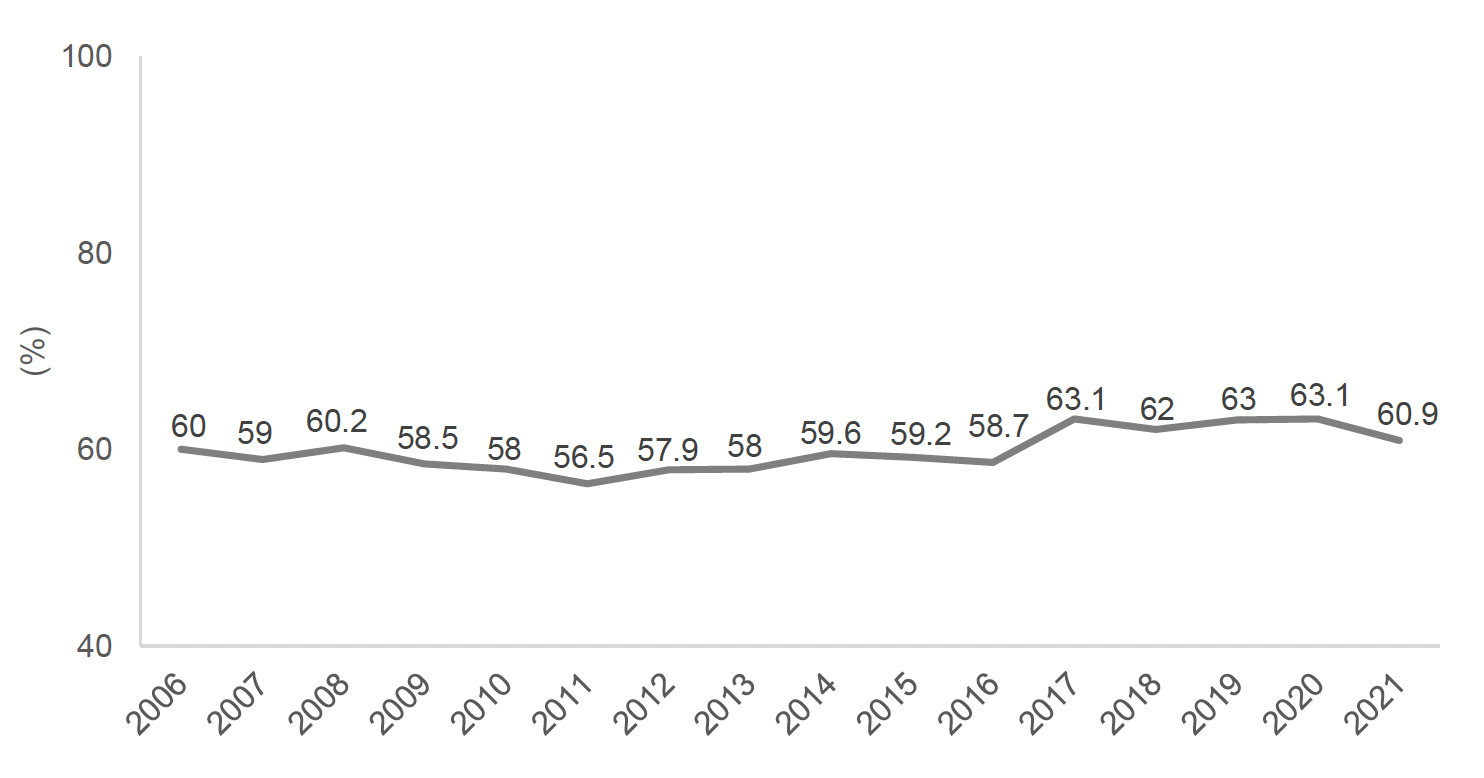
The adult employment indicator is the percentage of children under 16 who live in households where all adults are in employment (working households). This indicator can be understood best alongside the child poverty rate to give a fuller picture of the economic wellbeing of families.
In 2022, two-thirds of children and young people (66%) under the age of 16 were living in a working household. Figure 8 illustrates how the percentage of children living in working households fell between 2006 and 2011 (from 60% to 56.5%) before increasing and remaining somewhat constant between 2017-2020 (varying between 62-63.1%).
Living in a household where no adult is in paid employment is one of the biggest poverty risks. However, having a job is not always enough. In fact, 88% of children in relative poverty do live in a household where someone works. This is what is called in-work poverty. The main driver of in-work poverty is limited flexibility and low pay across many sectors.[51] The evidence provides recommendations to tackle in-work poverty. Some of these recommendations are to improve the quality and flexibility of available employment and ensure childcare availability and flexibility that matches job requirements. Evidence also highlights the need to address structural barriers such as discrimination (unfair treatment) and undervaluation (being paid less for equally demanding jobs), particularly for women, people with a disability and people form a minority ethnic group.
Digital inclusion
The digital inclusionindicator is the percentage of children and young people in P5 to S6 who have regular access to the internet at home. This could be on a phone or another device. The digital inclusion indicator comes from the Health and Wellbeing Census.
In 2021/2022, 98% of children and young people reported internet access at home, on a phone or another device. There was no difference by area of deprivation, with digital access being generally very high. 98% in the most deprived areas (SIMD 1) and 99% in the least deprived areas (SIMD 5).
As highlighted in the national reporting of the core wellbeing indicators the usefulness of this indicator is limited as it does not tell us about the quality of internet access (e.g. speed of the internet) nor the quality of device (e.g. useability of the device for the task at hand). Such measures may be more meaningful. For example, the Connecting Scotland evaluation found that prior to receiving a device many people relied on using a mobile phone as their main means of accessing the internet. This limited their ability to: complete school or college work; edit and save documents, such as CVs; and, access a range of applications restricting the ways in which people used their connectivity. [52] Additionally, the on-going costs of continued connectivity and electricity can causes financial issues for some lower income households. Thus, limiting a household's digital inclusion.[53]
Neighbourhood satisfaction
The neighbourhood satisfaction indicator is the percentage of children and young people in P5 to S6 who agree that their local area is a good place to live. The neighbourhood satisfaction indicator comes from the Health and Wellbeing Census.
In 2021/22, two-thirds of children and young people (66%) thought their areas was a good place to live. By area deprivation, the percentage of children and young people thinking their area was a good place to leave increased as area deprivation decreased – 47% in the most deprived areas (SIMD 1) compared to 82% in the least deprived areas (SIMD 5).
A similar trend has been found in other datasets with the 2018 HBSC Scotland study reporting based on family affluence, young people (aged 13 and 15 years) with low levels of family affluence were less likely to agree, than those with higher family affluence) that their local area was a really good place to live (28% and 59% respectively).[54]
Neighbourhood safety
The neighbourhood safetyindicator is the percentage of children and young people in P5 to S6 who say they feel safe when out in their local area always or most of the time. The neighbourhood safety indicator comes from the Health and Wellbeing Census.
In 2021/22, 87% of children and young people feel safe in their local area always or most of the time. There was variation by area deprivation with feeling safe increasing alongside falling deprivation. For example, 78% of children and young people from the most deprived areas (SIMD 1) reported feeling safe always or most of the time, compared to 93% of those from the least deprived areas (SIMD 5).
As with neighbourhood satisfaction, the 2018 HBSC Scotland study reports a similar trend with young people (aged 13 and 15 years) from lower levels of family affluence less likely, than their peers from families with higher affluence, to always feel safe in their local area (50% and 72%, respectively).[55]